Investors diversified their portfolios long before the advent of modern portfolio theory (MPT) in the mid-twentieth century. For the United Kingdom, there is a consensus in the literature that “the practice of spreading capital among numerous investments was being adopted” at least from the last quarter of the nineteenth century (Cheffins Reference Cheffins2010, p. 127; Foreman-Peck and Hannah Reference Foreman-Peck and Hannah2011, p. 1222; Kennedy Reference Kennedy1987, p. 145), with studies even investigating diversification as early as in the aftermath of the Glorious Revolution in the late seventeenth century (Carlos, Fletcher, and Neal Reference Carlos, Fletcher and Neal2015). The diversification principle is quite simple in its naïve version—put equal amounts in a number of different securities—and its adoption by active investors could thus seem a “natural and inevitable” result (Cole Reference Cole and Cole1935, p. 58). Pre-MPT approaches to diversification, often framing themselves as “scientific investment” (Jefferys Reference Jefferys1977, p. 416) or investment as an “exact science” (Lowenfeld Reference Lowenfeld1907) put forward a more sophisticated set of investment rules. By WWI, investors were applying the concept, if not the mathematics, of correlation, and the recommendations made by contemporary advisers were consistent with the recommendations of MPT with respect to portfolio selection strategies (see also Rutterford and Sotiropoulos Reference Rutterford and Sotiropoulos2016).
To date, there has been very limited empirical research into how U.K. investors attempted portfolio diversification before MPT. Most discussions go no further than simply acknowledging the existence of portfolio diversification by U.K. investors from the late nineteenth century onwards.Footnote 1 Research has been hampered by the lack of data at the micro level, still a critical issue for any study of contemporary financial transactions.
A limited number of studies offer some evidence from early stock exchange security transactions and related asset holdings (portfolios), but without explicitly discussing diversification. For example, Peter Earle has studied the portfolio holdings of 375 middle-class individuals who died between 1665 and 1720 and emphasizes the rising share of investment in government debt and corporate securities during the so-called Financial Revolution of the late seventeenth century (Earle Reference Earle1989, p. 146). Based on death duty records between 1870 and 1902, David Green, Alastair Owens, Josephine Maltby, et al. investigated the composition of wealth by age and gender stressing that shares became more important over the life course for both men and women (Green, Owens, Maltby, et al. Reference Green, Owens, Maltby and Rutterford2009). Janette Rutterford, Green, Maltby, et al., looking at 223 share records of 47 companies registered in England and Wales over the period 1870 to 1935, captured the gradual rise of share ownership of male and female investors (Rutterford, Green, Maltby, et al. Reference Rutterford, Green and Matlby2011).
Early portfolio diversification is explicitly discussed only by Ann Carlos, Erin Fletcher, and Larry Neal (Reference Carlos, Fletcher and Neal2015) and W. Kennedy and R. Britton (Reference Kennedy, Britton and Tilly1985). Carlos, Fletcher, and Neal compiled a dataset of share ownership for those joint-stock companies whose security prices were listed in the commercial newspaper, the Course of the Exchange.Footnote 2 On the basis of their sample, Carlos, Fletcher, and Neal examined individual portfolio holdings in the 1690s as well as between 1718 and 1723. They found that about 80 percent of active investors in these equities held shares in just one company: a sign of poor diversification (Carlos, Fletcher, and Neal Reference Carlos, Fletcher and Neal2015, p. 1). Kennedy and Britton (Reference Kennedy, Britton and Tilly1985) is probably the only existing study explicitly looking at Victorian portfolios in Scotland. They examined a sample of 477 financial portfolios from probate records between 1876 and 1913, comparing them with the efficient frontier (for which they used sectoral economic outputs instead of financial returns). Their discussion does not extend beyond the fact that Scottish individual investors held sub-optimal portfolios; a finding that tallies nicely with Kennedy’s argument that biases in Victorian capital markets and poor diversification opportunities hindered financial investment from reaching risky yet dynamic economic sectors (Kennedy and Britton Reference Kennedy, Britton and Tilly1985, p. 72; Kennedy Reference Kennedy1987, p. 144).
Perhaps due to a lack of historical information on individual investment decisions at the micro level, systematic empirical research on portfolio holdings appeared only after the 1970s (in other words, after the formulation of MPT and of a special case of MPT, the Capital Asset Pricing Model or CAPM).Footnote 3 Marshall Blume and Irwin Friend (Reference Blume and Friend1975), using U.S. survey data for 1962 and income tax records for 1971, showed that a large number of households held poorly diversified equity portfolios (see also Blume, Crockett, and Friend Reference Blume, Crockett and Friend1974). William Goetzmann and Alok Kumar (Reference Goetzmann and Kumar2008), using 1990s discount brokerage data, found evidence of under-diversified equity portfolios (especially among younger, low-income, less-educated, and less-sophisticated investors). Other research based on surveys of consumer finances also reports weak diversification among households in the 2000s (Polkovnichenko Reference Polkovnichenko2005; Kelly Reference Kelly1995).
Apart from Kennedy and Britton (Reference Kennedy, Britton and Tilly1985), there are, to our knowledge, no other studies which use financial portfolio data to explicitly discuss diversification in the late nineteenth century. This period is particularly important. Given the global distribution of capital, diversification was being widely recommended by financial analysts at the time. Also, during this period, international diversification could be achieved with low currency risk given the gold standard regime. In addition, there was an increasing number of limited liability companies in the wake of the 1856 and 1862 Companies Acts, and a growing number of types of domestic and international securities (ordinary shares, preferred shares, and fixed interest securities) and sectors listed on both the London Stock Exchange (LSE) and on provincial stock exchanges.
A few studies emphasize the importance of portfolio diversification in the late nineteenth century in the context of financial developments. They attempt to explain some stylized facts in U.K. financial history on the basis of modern portfolio theory, such as the preference for non-domestic stocksFootnote 4 (major outflows of capital from the United Kingdom) or the preference for railway stocks (Mitchell, Chambers, and Crafts Reference Mitchell, Chambers and Crafts2012), relying on market returns and sectoral indices, not on actual individual holdings, to argue in a hypothetical fashion that diversification would have had gains had investors chosen to diversify. Michael Edelstein (Reference Edelstein1982), for instance, found that foreign holdings earned on average 1.58 percent risk-adjusted return per annum more than domestic holdings (using an international CAPM model over the period 1870 to 1913). William Goetzmann and Andrey Ukhov, extending Edelstein’s analysis, considered whether investors during this period may have instinctively taken account of the historic correlations (for the period 1870 to 1913) between different asset classes when choosing their portfolio asset allocation. They argue that the optimal percentage of overseas securities for investors to have held before the outbreak of WWI was not far from the actual proportion of all foreign securities listed on the LSE in nominal terms (see Goetzmann and Ukhov Reference Goetzmann and Ukhov2006).Footnote 5
Following Goetzmann and Ukhov, Cécile Edlinger, Maxime Merli, and Antoine Parent (Reference Edlinger, Merli and Parent2013) argue that, for French investors, a preference for European investment would have been in line with optimal portfolio analysis, and that late nineteenth century investors’ disregard of European securities in favor of other foreign investments was suboptimal in terms of the risk-return trade off. Benjamin Chabot and Christopher Kurz (Reference Chabot and Kurz2010) reach a similar conclusion to that of Goetzmann and Ukhov. Brian Mitchell, David Chambers, and Nicholas Crafts (Reference Mitchell, Chambers and Crafts2012) identify the optimal portfolio percentages, not for international investments, but for British railways, which investors should have held in the decades up to WWI.
None of the earlier research had access to individual investor portfolios with which to confirm their macro level results. In contrast, this study draws upon a sample of portfolio holdings carefully reconstructed from existing probate records from 1870 to 1902. This is the first study to investigate the diversification of actual investor portfolios during the second half of the nineteenth century.
The Geographic Distribution of Risk: Naive Diversification from the 1870s
Investors are generally assumed to be risk averse; maximizing their expected investment return (generally agreed to be the total of income and capital gain over a particular period) for a given level of risk. Alternatively, they are assumed to be satisfied with the least possible risk relative to the return they seek. The measure most commonly used to quantify risk is the standard deviation of returns. Harry Markowitz (Reference Markowitz1952) developed a formal model of portfolio selection, combining the statistical definition of risk with a risk-averse assumption of investor behavior. This application of a mean-variance model to the portfolio selection problem laid the ground for modern portfolio theory, triggering, inspiring, and influencing a vast amount of research in finance. The main insight is simple: when it comes to the analysis of portfolio risk, one needs to take into account not only the individual components’ risks, but also their interactions. Markowitz’s mean-variance model was designed for a single period. Subsequent research has attempted to generalize the single period model to a multi-period one under various assumptions about investor utility functions and dependency of returns between periods (Elton and Gruber Reference Elton and Gruber1997).
Investors were not helpless nor did they lack investment advice before the formulation of MPT.Footnote 6 The investment approach of spreading risk across a number of securities was widely promoted in investment publications from the 1870s. In these publications, financial advisers and analysts offered detailed recommendations on how to combine different investments in a portfolio. These recommendations increased in sophistication over time. By 1914 only the mathematical optimization of Markowitz’ model was lacking in terms of portfolio best practice in the United Kingdom.
Indeed, from the early 1870s, a number of pamphlets and articles advised investors to add to their portfolios as many risky securities, in equal weights, as were required to generate a targeted yield. According to contemporary financial terminology, this strategy is known as naïve diversification.Footnote 7 For example, after acknowledging the British investor’s preference for none but British government securities, Chadwicks’ Investment Circular in 1870 arguedFootnote 8:
We are now too much alive to our own interests to place our trust in Consols alone […]. Moreover, Railways, and even Foreign Stocks, have been found to pay better in the long run. We hold that, by a careful selection from the various media of investment, very remunerative returns in the shape of interest may be obtained; while, by a proper division of risks, not only may the security for the principal be rendered perfectly satisfactory, but there may be a good prospect that the invested capital will steadily increase in value.Footnote 9
The authors of Chadwicks’ Investment Circular also provided empirical examples of how such “proper division” of risks worldwide might work in practice, preferring portfolios of five securities of different types (such as home railways and foreign stocks) to be held in equal amounts by market value, and chosen to target a particular yield for the portfolio.Footnote 10 Similar advice was offered in Beeton’s Guide to Investing Money with Safety and Profit, published in 1870.Footnote 11 Investment books, magazines, pamphlets, and newspaper articles made investors systematically aware of the benefits of spreading risks at home and abroad through naive diversification: add as many risky securities, in equal weights, as required to generate a targeted yield with an emphasis on spreading portfolios overseas.Footnote 12 Several investment trust prospectuses also promoted the idea of international diversification during the same period.
The Geographic Distribution of Risks: Scientific Investment in the Early 1900s
From the beginning of the twentieth century, a more sophisticated top-down approach to portfolio diversificationFootnote 13 was gradually developed by investment advisers such as Henry Lowenfeld. The focus was now explicitly on the idea of correlation and on reducing portfolio risk by proper selection of uncorrelated, but equally volatile securities. This strategy continued with the concept of international diversification and further expanded and elaborated insights and techniques already in place by the 1870s. The key difference from naïve diversification, was that instead of selecting securities one by one, the “scientific approach” was to divide the world into regions and select one or more securities related to each region. This was also called “geographical distribution of capital.”
Geographical diversification strategies were actively promoted by a number of contributors to the Financial Review of Reviews, a monthly magazine first published in 1905, and in textbooks such as Investment an Exact Science, by Lowenfeld (Reference Lowenfeld1907), followed up by others.Footnote 14 Lowenfeld did not identify an efficient set of portfolios according to modern portfolio theory calculations, nonetheless he offered a sophisticated analytical framework for the main principles and building blocks of financial diversification. He explained in detail a top-down approach to portfolio construction: by targeting a particular level of yield at the portfolio level, but also by reducing capital risk through the choice of relatively uncorrelated securities. Historical analysis of returns, price volatility, and correlation were all taken into account in the portfolio selection. Lowenfeld was very influential; his diversification approach was translated into French and German as well as being promoted by others.Footnote 15
The top-down approach concentrated on global diversification. The implicit but fundamental assumption was that the global financial market was fragmented, and thus, security prices and returns were “dominantly influenced by the trading conditions of the particular country in which they are principally held and dealt in” thus following that country’s business cycle (Lowenfeld Reference Lowenfeld1907, p. 61; see also Crozier Reference Crozier1910). Securities from the same (domestic) market were thought of as more likely to be positively correlated. While diversification was perceived as a “systematic method of averaging risks” (Lowenfeld Reference Lowenfeld1907, p. 61; Hobson Reference Hobson1914, p. 234) or, alternatively, as a method to neutralize and balance risks against each other (Crozier Reference Crozier1910), in practice it became a method of “geographical distribution of capital.” International diversification was thought to offer more beneficial covariances than domestic diversification as it allowed investors to “obtain as great a contrast as is possible in the trade influences which govern each one of his holdings” (Crozier Reference Crozier1910, p. 90).
The Data
Data on individual portfolios are hard to obtain and scarce even in contemporary research on financial transactions. For the post–1960s period, there are a number of empirical studies of individual (or household) portfolios typically using relatively recent data from surveys, tax returns, or brokerage accounts.Footnote 16 We use probate records for the period 1870 to 1902. Probate records are records of wealth used for taxation on death. From 1796, legacy duty was levied on moveable property, and the surviving residuary accounts for the assessment of this tax that have survived provide detailed information on an individual’s personal wealth at death.Footnote 17 The residuary account series in this article contains information for a sample of 1,446 individuals who died in England and Wales between 1870 and 1902. Although only a small portion of the total actually submitted, the sample itself appears to be reasonably representative of the broader population from which it was drawn. A comparison of the number of accounts for each county with the total number of adult deaths in 1881 confirms that there is no geographical bias in the series (Rutterford Green, Maltby, et al. Reference Green, Owens, Swan, Green, Maltby and Owens2011, p. 177). The valuation of personal assets in the probate data was based on the market price that prevailed at the time of probate and is, therefore, an accurate measurement of worth. The data also refer to individuals who owned sufficient assets at the time of their death to warrant the submission of accounts for the assessment of death duties. Only those individuals who died leaving personal property worth at least £5, or £10 in London, had to file for probate and even those with smaller estates were often exempt from paying death duties. Of the 1,446 individuals in the probate sample, only 507 held financial securities of any type, and it is this sample of 507 that we use in our analysis. We should also bear in mind that any evidence derived from end of life data will have an inevitable age bias towards the elderly.Footnote 18
Our sample offers good coverage not only of individual financial portfolios, but also of all other assets and liabilities at death. For each individual, the dataset contains personal characteristics (age, gender, marital status, and address of residence), as well as gross wealth (gross estate). Gross wealth includes non-financial assets and financial securities. The financial securities were divided in the probate files into seven categories: canals, ships or shares of ships, railway shares, and “other shares,” as well as foreign, colonial, and U.K. government stock. For each security listed, the probate archives reported the name and market value of the security, allowing us to estimate the number of holdings and value of each portfolio, as well as the sector and country to which each holding related. However, detailed information on security type for every non-government security is not always complete. Where details on the security type are missing, we can, in some cases, determine the exact security held, as, for example, when a firm only has ordinary shares as capital or where it states “debenture” and there is only one type of debenture in the firm’s capital. However, this is not always possible. In practice, this means that we cannot use individual security returns and market prices for all securities to estimate overall portfolio performance. About one-fourth of the total of 2,316 securities in the portfolios of our sample is unspecified with regard to security type (ordinary share, preferred share, debenture, or loan stock); 221 from a total of 507 portfolios are affected by incomplete information as to security type. The larger portfolios of wealthy investors, with more holdings per portfolio, are more affected by missing information. As a result, the complete and incomplete portfolio sub-samples do not mirror the full sample.
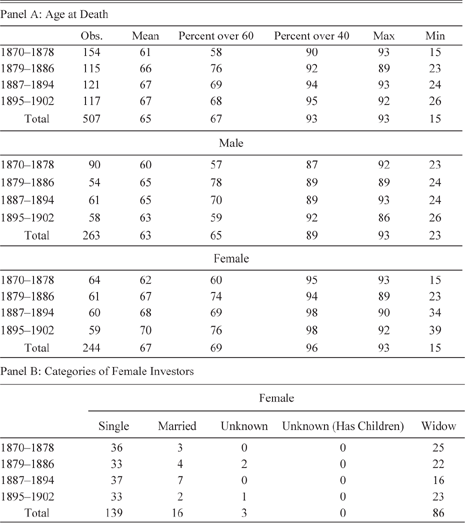
Table 1 gives some characteristics of our sample of investors who died between 1870 and 1902, in particular: number of observations, age at death and, for women, marital status. To capture changes over the period, the data are also divided into four sub-periods of approximately equal duration: 1870–1878, 1879–1886, 1887–1894, and 1895–1902. The sample of 507 investors is almost equally divided between male (263) and female (244), a finding that reinforces the (underestimated) importance of women investors in the Victorian era.Footnote 19 As expected, single women (139) and widows (86) were more numerous than married women (16), comprising 92 percent of the total number of women investors in the sample. Until the Married Women’s Property Acts (MWPAs) of 1870 and 1882, a married woman’s legal identity was covered by her husband (coverture). Unmarried women (single and no-longer married/widows) were legal individuals in their own right, not requiring, for example, a male signature for financial transactions. Women who married after the MWPAs were able to retain inheritances and hold shares in their own names.Footnote 20 However, given the age profile of the women in the sample, it is likely that most women of that age profile who did marry, did so before the MWPA of 1882, if not before that of 1870.
Investor Summary Statistics for the Probate Sample

Notes: Age at death is available for 457 of 507 investors. The marital status is not reported for men.
Source: Probate sample, see the text.
The average age of death was 63 for men and 67 for women, with an overall average of 65. The average age at death for the sample rose throughout the period from 61 in the first sub-period to 67 in the last sub-period. On average, 67 percent of investors lived for more than 60 years. Most investors in the sample probably held securities for some time, gradually increasing their investments and/or the number of holdings in their portfolios. The implication for investment is that the portfolios in our sample may have been held for some time before death.Footnote 21
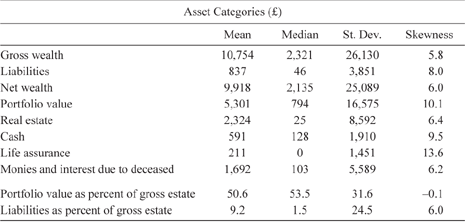
Table 2 shows some descriptive statistics for the basic asset categories of gross wealth for our investors. All reported asset categories show very high positive skewness, indicating significant wealth polarization amongst this sample of U.K. investors. The polarization is also evident in the differences between mean and median values. The market value of the average portfolio was £5,301 (£529,900 in 2017) while the most valuable portfolio was worth £260,402 (c. £26 million in 2017).Footnote 22 This portfolio was held by Mr. Joshua Milne Heap, who died in 1890 at the age of 65 and had 91 different stocks comprising mostly U.K. and non-U.K. railway securities. The value of this portfolio was high in relation to the rest of the sample. For instance, the third largest portfolio in value terms belonged to Mr. Thomas Wainer, who died in 1883, and contained 18 securities worth £77,668 (including a range of different securities: Consols, gas, railways, insurance, canals, and an investment trust). The largest female portfolio belonged to Mrs. Mary Gould, a London widow who died in 1872, comprising 18 securities worth £63,596 and spread between Consols and different types of U.K. securities, including railways and canals.
Descriptive Statistics for Gross Wealth Categories for the Sample

Note: All values are in £. Financial portfolios include all liquid securities other than cash: that is, both equity (ordinary and preferred shares) and debt (debentures or Consols). Cash is a proxy for general cash savings including any type of cash in the house, in the bank, in the office, or anywhere else. The category monies and interest due to deceased includes different types of debt (i.e., rents, mortgages, bonds and bills, and book debts) and the related interest payments owed to investors at the time of death. The gross wealth is the gross estate. It includes: monies and interest due to deceased, real estate, portfolio (all financial securities), life assurance, cash, and the sum of chattels (this one is not reported in the table). The net wealth is equal to gross wealth minus total liabilities. The latter comprises all debts (ordinary debts, mortgages and bonds and bills) and related interest payments owed by the deceased.
Source: Probate sample, see the text.
On average, financial assets amounted to around 50 percent of total wealth but the range varies from almost 0 to 100 percent. The median is higher than 50 percent, thus the majority of those individuals who chose to hold financial securities as part of their gross wealth invested more than 50 percent of their total gross wealth in such investments, with real estate the next most important asset. LiabilitiesFootnote 23 represented a relatively small proportion of overall wealth. The majority of investors in our dataset had liabilities representing less than 10 percent of total gross wealth (the median was 1.5 percent). Thus, the difference between gross and net wealth was small for these late nineteenth century investors.
Portfolio Diversification
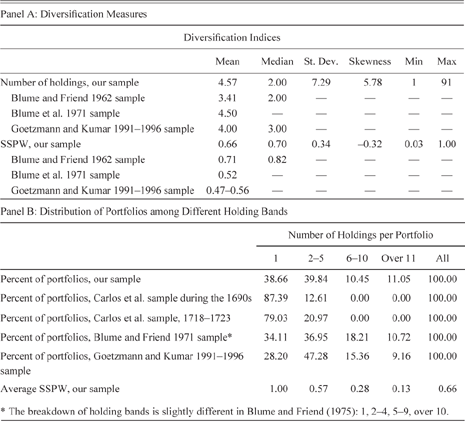
In Table 3, we use two measures to examine the level of diversification of the 507 portfolios in the sample. The simplest, and the most commonly used, measure of diversification is the number of holdings in a portfolio.Footnote 24 The underlying assumption is that “the greater the number of issues, the greater the potential for diversification” (Blume, Crockett, and Friend Reference Blume, Crockett and Friend1974, p. 31). Panel (A) of Table 3 shows that the average number of holdings is 4.56. Thus, the average individual U.K. investor in our sample held between four and five different securities. The difference between the mean and the median number of holdings indicates significant positive skewness, suggesting that the majority of investors had portfolios with fewer than four holdings. Indeed, the median number of holdings for the sample is two. The relatively high standard deviation implies high dispersion in the number of holdings in individual portfolios. In our sample, the number of holdings varies between one and 91. These findings suggest that a large number of U.K. portfolios in the late nineteenth century were under-diversified. As we can see from Panel (B) of Table 3, almost 40 percent of total portfolios included just one security, while almost 80 percent of portfolios—the great majority—included no more than five securities. However, 11 percent of portfolios included more than 11 securities.
How Diversified were Victorian Investors?

* The breakdown of holding bands is slightly different in Blume and Friend (Reference Blume and Friend1975): 1, 2–4, 5–9, over 10.
Notes: Carlos, Fletcher, and Neal (Reference Carlos, Fletcher and Neal2015) use an “extremely loose definition of portfolio” aggregating across company-years. This is not directly comparable to the definition of portfolio holdings in the other studies. Post–1960s U.S. studies discuss household surveys or related data, while we have individual investors in our sample. Goetzmann’s and Kumar’s sample is from a major U.S. discount brokerage house so: (1) not necessarily representative of the household sector, and (2) does not necessarily contain the individual’s entire financial wealth. Victorian portfolios include fixed income securities while the post–1960 U.S. portfolios do not include bonds. As already defined, SSPW is the sum of the squared portfolio weights.
Source: Probate sample, see the text.
Panel (B) of Table 3 also reports portfolio holdings estimated by Carlos, Fletcher, and Neal (Reference Carlos, Fletcher and Neal2015) for early 1690s and 1720s portfolios. Of course, our results are not directly comparable. Carlos, Fletcher, and Neal (Reference Carlos, Fletcher and Neal2015) compile their portfolios from the shareholder records of the listed stock of only eight large joint stock firms and thus exclude other marketable financial securities of the time. Investment choices at that time were relatively limited by comparison with the late nineteenth century, when the nature of stock exchanges in the United Kingdom was very different, as were the diversification options available to ordinary investors.Footnote 25 However, the proportion of investors in our sample with just one holding remains quite high at 40 percent (as compared with 87 percent for Carlos, Fletcher, and Neal’s sample). Victorian portfolios were still under-diversified.
Table 3 lists the results of some post–1960 studies of U.S. household and individual investor diversification. Although there are some caveatsFootnote 26 in comparing our sample with more recent U.S. data, it is clear from Table 3 that under-diversification remained an issue well into the late twentieth century. In fact, Victorian U.K. investors compare rather well with late twentieth-century investors in terms of diversification. According to Blume and Friend’s (Reference Blume and Friend1975) sample, U.S. households’ average number of equity holdings in 1962 was just 3.41, while the median number of holdings was two. In a different sample from 1971 (Blume, Crockett, and Friend Reference Blume, Crockett and Friend1974, p. 37), the U.S. average number of equity holdings was 4.5, higher than the 1962 average for U.S. households, but very similar to the average number of security holdings of U.K. investors almost a century earlier. Goetzmann and Kumar (Reference Goetzmann and Kumar2008, p. 437) estimate that U.S. retail brokerage clients between 1991 and 1996 held on average four equity securities. More recent surveys of the consumer finances of U.S. households have estimated a median number of equity holdings of two until 2001, when it rose to three (Kelly Reference Kelly1995; Polkovnichenko Reference Polkovnichenko2005). Thus, U.K. investors in our sample engaged in more financial diversification than did their U.S. counterparts after the 1960s. Portfolios both now and then are on average under-diversified. Table 3 Panel (B) shows that 78.5 percent of Victorian investors held no more than five securities in their portfolios. This is comparable to the corresponding 75.6 percent of U.S. investors with no more than five holdings in 1991–1996 and to the 71 percent of U.S. households that held no more than four stocks in 1971.
Portfolio Concentration and Under-Diversification
Counting the holdings in a portfolio as a measure of diversification gives equal importance to naively diversified (equally weighted) portfolios and to unbalanced portfolios. Thus we use a second measure of diversification. This is the sum of the squared portfolio weights, or SSPW, the values of which are shown in Table 3 for the various samples of investors. Following Blume, Crockett, and Friend (Reference Blume, Crockett and Friend1974), Blume and Friend (Reference Blume and Friend1975), and Goetzmann and Kumar (Reference Goetzmann and Kumar2008), the SSPW is given by the following expression:
 $SSPW = \sum\limits_{i = 1}^N {{{\left( {{w_i} - {w_m}} \right)}^2}} = \sum\limits_{i = 1}^N {{{\left( {{w_i} - {1 \over {{N_m}}}} \right)}^2} \approx \sum\limits_{i = 1}^N {w_i^2} } ,$
where N is the number of holdings in the portfolio, Nm is the number of securities in the market portfolio, wi is the portfolio weight assigned to security i in the portfolio, and wm is the weight assigned to a security in the market portfolio (wm=1/Nm). SSPW thus captures the diversification level of a portfolio by its deviation from the market portfolio. Since the weight of each security in the overall market portfolio is very small, this diversification measure is in practice equal to the sum of the squared portfolio weights. SSPW identifies unbalanced portfolios, capturing the extent to which the value of a portfolio is concentrated in a few securities. For example, a portfolio invested equally in two securities would have an SSPW of 0.5, whereas an unbalanced one invested 90 percent and 10 percent in two securities would have an SSPW of 0.82. A portfolio following Lowenfeld’s recommendation for a global, top-down portfolio with ten equal investments, say, would have an SSPW of 0.10. Generally, the lower the SSPW measure, the greater the level of diversification and the closer to the type of naive portfolio diversification recommended by financial advice at that time.
The information in Table 3 allows us to compare the SSPW for investors with different numbers of holdings. The number of holdings is (negatively) related to SSPW values; for example, for portfolios containing more than 11 securities, the SSPW falls to 0.13, implying a good level of diversification, close to the SSPW for an equally weighted portfolio invested in ten holdings which would have an SSPW of 0.10. In contrast, an unbalanced portfolio of ten holdings, with, say, 5 percent invested in each of nine holdings and 55 percent in one holding would have an SSPW of 0.32. Our sample SSPW results of a mean of 0.66 and a median of 0.70 are also similar to the results of more recent studies. They are slightly lower than the SSPW of 0.71 found by Blume and Friend (Reference Blume and Friend1975) for their 1962 U.S. sample, although they are higher both than the Blume, Crockett, and Friend (Reference Blume, Crockett and Friend1974) SSPW estimate of 0.52 for the 1971 U.S. sample, and the Goetzmann and Kumar SSPW estimates for the mid-1990s, which range between 0.47 and 0.56.
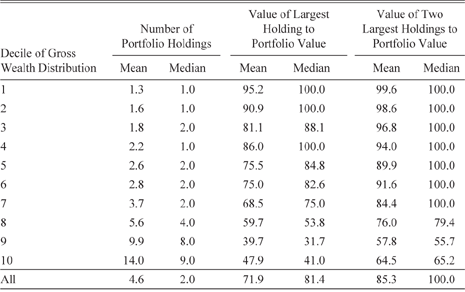
Portfolio concentration is reported in Table 4. The average and the median value of the largest holding and the two largest holdings expressed as the ratio to total portfolio value are given for different deciles of the financial wealth distribution. These two measures capture how concentrated (unbalanced) were the portfolio weights in our sample. The higher the concentration of financial investment in one or two securities, the greater the difference from equal weights. Table 4 offers further evidence of the unbalanced structure of portfolios. It suggests that even wealthy investors were reluctant to equally weight their portfolios into different financial holdings. On average, investors in the top two deciles held portfolios with more than ten securities, but concentrated about 43 percent of their financial wealth in a single holding. At least 50 percent of the top two deciles of investors invested more than 32 percent of their portfolio value in one security. Investors in the two top deciles invested on average about 61 percent of their portfolios in two securities. The overall average weight of the largest holding was 71.9 percent and the average sum of the two largest security weights was 85.3 percent.
Concentration of Portfolios in Our Sample by Wealth Decile

Source: Probate sample, see the text.
Investors appear to have been reluctant to adopt even the recommended naive diversification strategy, thereby exhibiting resistance to the 1/N rule. Nevertheless, our results compare with the findings of Blume and Friend for the 1962 sample of U.S. households. In our sample, half of the investors invested more than 81 percent in a single security, relative to 90 percent estimated by Blume and Friend, and 100 percent in one or two securities, which was the same in the 1962 U.S. sample (see the median figures in the last row of Table 4; Blume and Friend Reference Blume and Friend1975, p. 589). So, Victorian investors were overall under-diversified, but exhibited similar behavior to that of the U.S. household sector in the second half of the twentieth century.
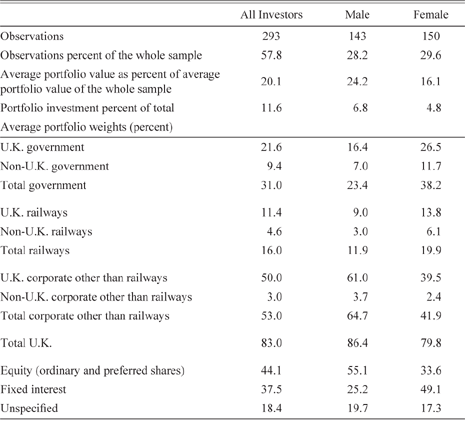
In Table 5 we focus on portfolios with just one or two holdings, representing about 60 percent of investors in our sample, almost equally distributed by gender. These are mostly less wealthy investors. Due to the extreme polarization of the wealth distribution, the average value of portfolios with one or two securities amounts to only one-fifth of the average portfolio value for the whole sample, and thus, this under-diversified 57.8 percent of investors represents only 11.6 percent of portfolio investment in total. The majority of this investment (83 percent) was domestic, with only 17 percent invested in overseas securities. This compares with 28 percent invested overseas by the investors as a whole. Half (50 percent) of portfolio wealth was invested in U.K. corporate securities other than railways, with a majority in the form of equity.Footnote 27 The preference for U.K. non-railway securities in under-diversified portfolios is striking. It may indicate some risk-seeking behavior, but perhaps also a preference for locally-listed U.K. firms. Such behavior was notably higher amongst male investors. Female investors preferred placing relatively more in government and railway securities. These findings run contrary to the argument that Victorian investors (as opposed to investment) were biased “towards safe, well-known securities in general, a great number of which were foreign, and away from riskier, smaller, but ultimately from an economy-wide viewpoint, much more profitable ones” (Kennedy Reference Kennedy1987, p. 145). The relatively less wealthy majority of Victorian investors in our sample held under-diversified portfolios, but also preferred less safe non-railway U.K. corporate securities.Footnote 28
Under-Diversified Portfolios with One or Two Holdings

Source: Probate sample, see the text.
Victorian Portfolios across Time: Sectoral Analysis
Given that we have a spread of investor portfolios from 1870 to 1902, our sample allows us to explore variations over time in asset allocation and in portfolio choice. Here we focus more on investors as a particular “sector” in the U.K. economy and only marginally discuss intra-sectoral variation in financial behavior. In other words, our aim is to explain some general characteristic of Victorian investors as a body separate from other market participants such as banks and different types of institutional investors.
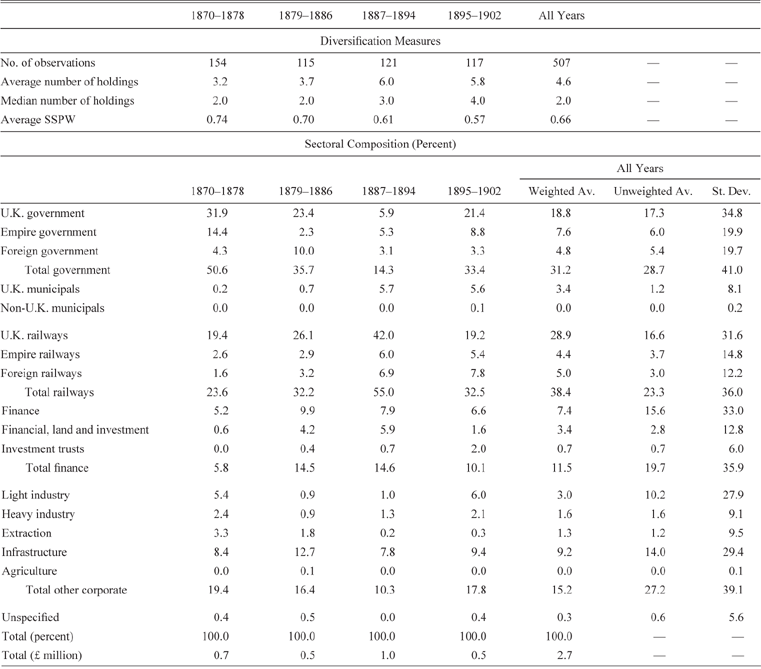
In the first panel of Table 6 we trace diversification measures across four, eight-year sub-periods. We show that, from the late 1880s, there was a significant increase in the average number of securities held. From 3.2 for 1870–1878, the average number of holdings almost doubled to 5.8 by the turn of the century. It would appear that such diversification became more popular with the rising importance of stock markets (the so-called “equity culture”),Footnote 29 as well as becoming more practicable with the increasing portfolio size (not reported in the table). Increasing diversification over time is also reflected in the figures for the median number of holdings (from two to four over the period) and the average SSPW (from 0.74 to 0.57). The median number of holdings of the last two periods is greater than the median number of holdings of U.S. households in the early 2000s.Footnote 30
Composition of Financial Portfolios of Our Sample (Percent Over Time)

Notes: The sectors have been defined in line with Goetzmann and Ukhov (Reference Goetzmann and Ukhov2006) and Mitchell, Chambers, and Crafts (Reference Mitchell, Chambers and Crafts2012). In particular: finance includes banks and insurance; light industry includes textiles, food, drink, and retail stores; heavy industry includes iron, coal, steel and heavy fabrication, mechanical equipment, electrical equipment, building and construction materials, and chemicals; infrastructure (social overhead) includes electricity, gas, water, canals and docks, shipping, telephone and telegraph, tramways, and omnibuses. Foreign assets are non-domestic non-colonial assets. U.K. government includes Consols (17 percent of total investment), Nationals (2 percent of total investment), and those Municipals (3 percent of total investment) which could not be categorized in other economic sectors (such as, utilities, docks etc.). The column “Unweighted Av.” shows the unweighted average for the whole period. This is different from the “Weighted Av.” which measures the portfolio investment share of each asset category as a whole.
Source: Probate sample, see the text.
We now examine how investment in our sample was split internationally between different sector and regional asset categories over time. There are significant differences in the portfolio compositions, as is to be expected given the rapid changes in investment opportunities over the period 1870 to 1902. In the first sub-period, 50.6 percent of the combined portfolios were invested in government bonds, compared with 23.6 percent in railways. By the third sub-period, these numbers were reversed, with only 14.3 percent in government securities and 55.0 percent in railways; with a second reversal in the fourth sub-period, when British railway securities fell in value, by more than half from 42.0 percent to 19.2 percent in our combined sample portfolios. Investment in foreign and colonial government securities was highest in the first sub-period, 1870–1878, coinciding with a peak in 1872 of net annual outflows of British savings into foreign assets (Edelstein Reference Edelstein1982, p. 29). There was another peak, less pronounced, in 1890 (ibid.), reflected in Table 6 by the greater percentage investment in colonial government bonds and non-domestic railway securities for the last two sub-periods. The percentage invested in other corporate sectors was relatively steady during the whole period, ranging between 25 percent and 30.9 percent, despite the rapid growth in importance of these sectors over time.
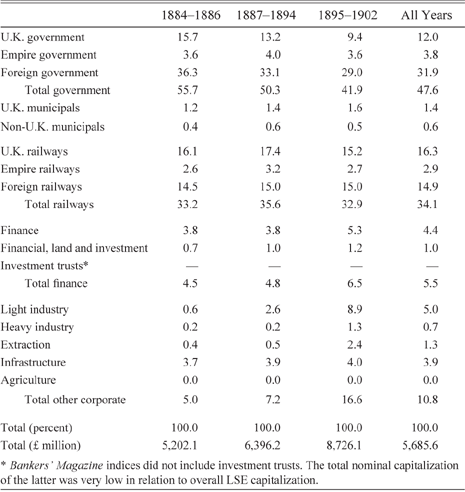
For comparison, the importance of these categories on the LSE for the same sub-periods is also shown in Table 7. In other words, we follow Goetzmann and Ukhov (Reference Goetzmann and Ukhov2006) in comparing our portfolios with the actual distribution of LSE officially-listed securities. This comparison allows us to explore to what extent investors as a whole in our sample chose to buy securities listed on the LSE in proportion to their importance. In our sample, the portfolio weights are based on market values, and investors do not necessarily hold only LSE officially-listed securities. In other words, the “market” for our investors includes not only the LSE, but also the provincial stock exchanges and the non-negligible LSE’s “junior market.”Footnote 31 To make a more meaningful comparison, we have used the Bankers’ Magazine (BM) market value indices, available after 1880, to translate LSE par values to market values.Footnote 32 Table 7 reports LSE aggregate sectoral market value weights based on BM indices. Unfortunately, detailed data on paid-up capital of the provincial stock exchanges and the LSE unofficial list market do not exist, so we must be cautious when comparing Tables 6 and 7. As a general rule, however, we know that the LSE was dominated by government and railway securities, while provincial stock exchanges and the LSE’s junior market placed relatively more emphasis on local domestic companies (Thomas Reference Thomas1973, p. 114; Hannah Reference Hannah2015). Given that the investors in our sample did not limit their choices to LSE-listed securities, we would expect their portfolios to be more domestic-biased than aggregate LSE figures.
London Stock Exchange Listed Securities (Paid-Up Capital as Percent of Total in Market Values)

* Bankers’ Magazine indices did not include investment trusts. The total nominal capitalization of the latter was very low in relation to overall LSE capitalization.
Notes: The data were collected from issues of the Stock Exchange Official Intelligence (SEOI), which was systematically published only after 1881. Our calculations are based on Bankers’ Magazine indices reported in Online Appendix Table 2, which are available only after 1884. For definitions of different sectors see the notes to Table 6. Municipals have not been absorbed within government or relevant economic sectors as in Table 6. Their size is very small in relation to the other asset categories so the comparison between Tables 6 and 7 is not affected.
Sources: Stock Exchange Official Intelligence and Bankers’ Magazine (our calculations).
As revealed by the BM indices (see Online Appendix Table 2), government bonds were traded on average around par for the whole period. Foreign government bonds’ market value consistently averaged around 15 percent below par. U.K. railway securities remained on average 30 percent above par, whilst foreign and colonial railway securities traded below par. Market values for the securities in the remaining sectors hovered generally somewhat above their par values for the whole period under consideration. Finance security market values, however, exceeded three times their par values. Given that government and railway securities dominated the LSE up to 1902, sectoral shares based on market values, instead of nominal values, do not change the picture substantially. Yet, differences are non-negligible.
Investors in our sample held more low-risk U.K. government bonds than the LSE figures in Table 7 would suggest, had they invested in sectors in proportion to market value. However, the standard deviation is very high, indicating substantial variation in risk preferences amongst U.K. investors. U.K. government bonds were the mainstay of trustee portfolios and considered relatively risk free. They were also in short supply,Footnote 33 representing only 12 percent by value of the LSE official list compared with 18.8 percent by value of our sample of portfolios combined. Our investors also held more colonial government stock by value than their importance on the LSE official list suggested. The most striking difference between Tables 6 and 7 is in the importance of non-domestic, non-colonial government securities, which in our sample is significantly lower than the LSE market value numbers. On average, 4.8 percent of the total financial wealth of our sample was invested in foreign government stock, corresponding to an average of 5.4 percent per portfolio, although with a high variance across investors. These figures are significantly different from the LSE market value weighting which averaged 31.9 percent over the period. There are a number of possible reasons why investors did not put nearly one-third of their financial investment into foreign bonds. First, such bonds, although listed on the LSE, were also sold to overseas investors as well as U.K. investors. Second, foreign bonds traded at a greater discount to par value than did U.K. government or colonial bonds (as shown in Online Appendix Table 2). Given risk aversion, U.K. investors might prefer to subscribe for and hold U.K. and empire government securities, which were consistently trading around par, rather than exposing themselves to the risks inherent in the significant market discount to par of foreign government stock. For example, Spanish 4 per cents fell from a price of £70 to £48 between 1895 and 1898.Footnote 34 More generally, investors were probably less inclined to hold non-U.K. government securitiesFootnote 35 than other institutional investors, despite the relatively higher real returns (Edelstein Reference Edelstein1982).
At the same time, while the unweighted average percentage of domestic railways in the individual portfolios in our sample (Table 6) is in line with the U.K. railway market share in the LSE official list of 16.3 percent, there is a huge variation across individual portfolios, as evidenced by a very different weighted average portfolio share for our investors of 28.9 percent. This difference can be explained by the fact that wealthy investors, in the top quarter of the gross wealth distribution, showed a higher preference for domestic railways than the rest.Footnote 36 There is also a striking difference in foreign railway holdings between investors in our sample (5 percent) and LSE market value figures (14.9 percent). However, one key reason for this is that British investors were not alone in buying these securities. Many U.S. railway stocks, for example, were listed on the New York Stock Exchange as, for example, those issued by Pennsylvania Railroad.
Adopting Markowitz’s approach to determine the optimal percentages for U.K. and non-U.K. railway securities in a portfolio (using 15 years of historical returns data to estimate risks, returns, and correlation coefficients), Mitchell, Chambers, and Crafts (Reference Mitchell, Chambers and Crafts2012) found that the optimal percentage in railway securities in a global portfolio for a U.K. investor was 29.3 percent between 1884–1886, peaked at 43.8 percent between 1887–1894, falling to 37.6 percent between 1895–1902 (Mitchell, Chambers, and Crafts Reference Mitchell, Chambers and Crafts2012, p. 823). In our sample, we can see (Table 6) that railway shares peaked in the third sub-period, but plummeted towards the end of the century, when domestic realized returns in the sector fell considerably (as opposed, for instance, to very high realized returns of world railways, mainly in the United States and Latin America, see Edelstein Reference Edelstein1982, p. 153). Thus, the railway share in overall investment in our sample shows a similar trend to the optimal railway exposure calculated by Mitchell, Chambers, and Crafts, both in domestic and non-domestic securities. This might be due to wealthy investors’ preference for domestic railway securities and not to average investor behavior.
Turning to financial sector securities, 11.5 percent of our sample’s portfolio wealth was invested in financial firms (comprising the financial, land, and investment; investment trust; and financial sectorsFootnote 37) relative to 5.5 percent in the LSE. The average weight of financial firms in an individual portfolio was much larger for the whole period at 19.7 percent. The very high standard deviation indicates high variance in holdings of financial firm securities among Victorian investors. This high variance is explained by the fact that less wealthy investors in the first two quartiles of the gross wealth distribution showed a relatively greater preference for financial sector securities (see Online Appendix Table 3). Those relying on a buy and hold strategy could also count on high capital gains in relation to par values: initial share subscribers would have seen their securities triple their value for banks and insurance companies (Online Appendix Table 2).
Infrastructure absorbed almost 10 percent of the sample’s portfolio investment and represented 14 percent of the average portfolio; these figures are higher than the corresponding LSE figure of 3.9 percent. Indeed, infrastructure has the highest individual sector average investment of 9.2 percent in our sample after U.K. government and U.K. railway securities. This cannot be explained by the real returns, which were on average lower than both (light and heavy) industry and finance (Edelstein Reference Edelstein1982). Infrastructure securities were over-represented in provincial stock exchanges in relation to the LSE, hence their actual weight in the overall U.K. market was higher than for the LSE and probably closer to the number shown in Table 6. Provincial stock exchanges listed numerous gas, water, and electricity companies; shipping companies were a significant part of the Liverpool stock exchange list; and many foreign telegraph companies were listed on both the Liverpool and Manchester stock exchanges (Thomas Reference Thomas1973, p. 120–29). Differences between London-based and provincial investors as to the attractiveness and availability of infrastructure investments could be a factor in the very high variance between individual portfolios for this sector.
With regard to the remaining aggregated economic sectors reported by the Stock Exchange Official Intelligence, the results in our sample in Table 6 are by and large comparable to the market value LSE figures. However, in all cases, there are significant differences among investor portfolios, as indicated by very high standard deviations. For instance, the average portfolio weight of light industry is considerably higher than the overall share invested in that sector, reflecting high variance among portfolios. The very large variances of portfolio weights for almost all the asset categories of Table 6 invite a multivariate regression analysis to capture the important intra-sector variation.
Variation within Victorian Portfolios
This section analyzes the intra-sectoral variation of portfolio choices on the basis of investor-level cross-sectional regression analysis. The regression results shown in Table 8 are based on the following equation:
 ${Y_i} = {\beta _0} + \sum\limits_{j = 1}^N {{\beta _j} \cdot {X_{ji}} + } \sum\limits_{k = 1}^M {{\beta _{N + k}} \cdot {Z_{ki}} + } {u_i}.$
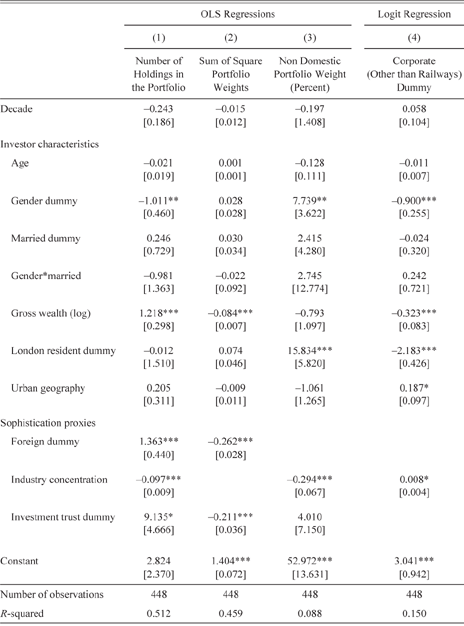
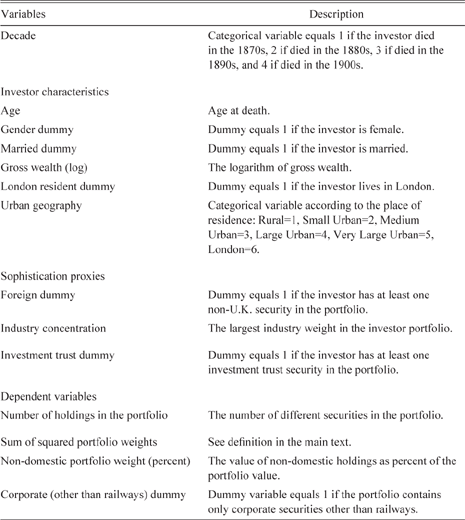
In the first two specifications, we use as dependent variables Yi the two diversification proxies defined earlier: the number of portfolio holdings (model 1) and the sum of squared portfolio weights or SSPW (model 2). In the third specification, the non-domestic portfolio weight is the dependent variable, while the final logit specification has as a dependent variable a dummy, which takes the value of one if the portfolio contains only corporate securities other than railways and is zero otherwise. The list of explanatory variables includes several investor characteristics Xj (age, gender, marital status, gross wealth, and London residencyFootnote 38) as well as some proxies for sophistication Zk (foreign dummy, industry concentration, and investment trust dummy, in line with relevant studies) that are likely to reflect levels of investor financial sophistication (see Goetzmann and Kumar Reference Goetzmann and Kumar2008, p. 453). Appendix Table 1 offers a detailed definition of all the variables used in the regressions of Table 8.
Investor Level Cross Sectional Regressions

* = significant at the 10% level.
** = significant at the 5% level.
*** = significant at the 1% level.
Notes: Robust standard errors are reported in brackets for the OLS specifications. Standard errors are reported for the logit specification. A full list of the variables can be found in the Appendix Table 1. The age is available for only 448 investors out of 507 in our sample. The above regression results do not change if we exclude age and run the same regressions for the 507 portfolios.
Source: Probate sample, see the text.
As column 1 in Table 8 shows, the number of portfolio holdings (a crude measure of diversification) is related to investor gender and gross wealth. As expected from the previous discussion, these regression results show that wealthy investors held more diversified portfolios. Male investors held on average more securities in their portfolios than did female investors. Neither London investors nor the urban geography of investors appears to affect diversification. With respect to investor characteristics, the wealth effect is the only one that survives in model (2) when we use the SSPW as dependent variable (according to its definition, the SSPW is inversely proportional to diversification, so the negative sign indicates the very same effect: wealth is positively related to diversified portfolios). This implies that gross wealth was the only decisive factor for balanced diversified portfolios (the gender dummy coefficient is not statistically significant in model 2).
As sophistication proxies we use a foreign dummy, which takes the value of one if the investor holds at least one non-domestic security in the portfolio; an investment trust dummy, which is set to one if an investor includes an investment trust in the portfolio (indirect diversification); and industry concentration, which has been designed to capture the industry tilt (see Goetzmann and Kumar Reference Goetzmann and Kumar2008, p. 453; Fama and French Reference Fama and French1997) and measures the largest industry weight in the investor’s portfolio. The coefficients for all sophistication proxies are statistically significant in both specifications (1) and (2) at the 1 percent level and have the expected signs, except for the investment trust dummy in the first specification which is significant at the 10 percent level. Investors who were aware of the benefits of (international) diversification held more securities and more balanced portfolios. On the other hand, the negative sign of the industry concentration coefficient in model (1) indicates that investors with large stakes (relative to their portfolio wealth) in a particular firm were more likely to avoid naïve diversification, preferring to hold more concentrated portfolios.
In specification (3) we see that gross wealth is not related to the portion of portfolio wealth invested in overseas securities. However, we also see that residence does affect preference for overseas securities. London residents invested, on average, 15.8 percent more in non-domestic securities, which means that investors outside London were more attracted by domestic (and probably local) securities.Footnote 39 Gender also affects preference for overseas securities. Women had higher non-domestic portfolio weights than men, thus showing greater interest in overseas investments. Also, the higher the portfolio concentration, the lower the non-domestic portfolio weight: unbalanced and security-concentrated portfolios were associated with domestic firms. In the logit specification (4) of Table 8, we see that portfolios including only securities other than government stock and railways were held by less wealthy investors. Specification (4) also shows that, on average, men and investors outside London were more inclined to hold portfolios with only non-railway corporate securities. Overall, we could assert that less wealthy investors were more willing to take more risk (diversifying less and being more attracted by corporate securities) and investors outside London were relatively more attracted by local corporate listings. These findings are in line with those reported in Table 5.
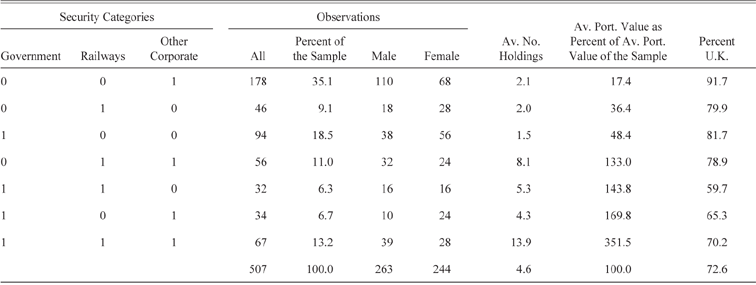
Table 9 categorizes portfolios according to possible combinations of holdings in three broad asset categories: government, railways, and other corporate. The largest group of investors in Table 9, comprising 35.1 percent of the total sample (predominantly less wealthy investors and men), held mostly U.K. corporate securities other than railways. At the higher portfolio values, investors held a broader range of securities and diversified internationally. Female investors showed a relatively greater preference for portfolios consisting of only government stock and railway securities compared with men, perhaps because some portfolios were held as trusts, with women, especially widows, more likely to be the beneficiaries. Although trust portfolios could include securities not on the “permitted investments” list if this was provided for in the trust deed, it is likely that many trust portfolios in this period confined themselves to certain U.K. and colonial government and railway bonds.
Portfolio Diversification in Relation to Broad Asset Categories

Notes: The three left-hand columns describe all the possible permutations of three different broad security categories, with a zero representing no holdings in a category and a one representing some holdings. The last column indicates the percentage of financial investment in domestic securities. The Government category includes all domestic and non-domestic government securities along with those municipal securities which could not be grouped into the other corporate category.
Source: Probate sample, see the text.
Of the total of 507 portfolios, two-thirds included corporate non-railway securities, and so could not have been trust portfolios limited to permitted investments in the Trustees’ Investment Acts. For men and women, the percentage of such portfolios was 72.6 percent and 59 percent respectively. However, we cannot say how many, if any, of the 507 portfolios were trust portfolios limited to permitted investments. The use of permitted, relatively safe investments held in trust was seen as a way of keeping risk to acceptable levels. In our sample, 18.5 percent of investors held only government bonds, and 11.6 percent only U.K. government bonds. This can be viewed as an alternative approach to risk reduction when compared with portfolio diversification. However, as mentioned earlier, the relatively large group who held only corporate non-railway securities was neither following recommendations for trust portfolios nor recommendations by contemporary commentators to spread risk across a broad range of sectors.
Conclusions
From the 1870s, U.K. investors were encouraged by financial advisers to diversify their portfolios and split them equally between different holdings (1/N rule) taking into account the global market. Gradually, after the turn of the twentieth century, a more top-down approach (which included all regions of the world in the investment opportunity set and securities from each region in a portfolio) was developed to assist investors in seeking beneficial correlations in the context of global distribution of risks. This study is the first systematic attempt to analyze the diversification strategies of late Victorian investors in England and Wales drawing upon a sample of 507 actual portfolios at death from the period 1870–1902.
Probate records in our sample are almost equally divided between male and female, reinforcing the importance of women investors in the Victorian era. Victorian investors, in the sample, on average held around half of their gross wealth in financial investments, holding between four and five securities in their portfolios. The number of holdings in the median portfolio was two, indicating poor diversification for the majority of investors. Almost 40 percent of investors held just one security, while almost 80 percent held no more than five securities. However, in terms of the number of holdings, Victorian investors compare well with post–1960s U.S. household financial behavior.
Comparing the unweighted average portfolio in our sample with different LSE asset categories in (estimated) market values, there are some notable differences. For example, Victorian investors invested relatively less in foreign (non-colonial) government securities and relatively more in domestic railways (particularly the case for wealthier investors). The (unweighted) average portfolio weights invested in financial firms, light industry, and infrastructure were high at 19.7 percent, 10.2 percent, and 14.0 percent, respectively, a total of 43.9 percent. However, there were substantial differences between investor portfolios, so that the total portfolio investment flowing to these three sectors, as measured by the weighted average of the portfolios, was actually much lower at the level of 23.7 percent. It seems that less wealthy Victorian investors were more open to investment in provincial and LSE unofficial securities, the majority of which were domestic.
The recommendation to hold securities in equal portfolio weights was generally ignored by late Victorian investors, even by wealthy investors. As expected, diversification was related to gross wealth; men held on average more securities than did women, but both held equally unbalanced portfolios. Residents outside London and less wealthy investors were more willing to hold securities of domestic financial firms and industries other than railways. This probably indicates a local preference effect, which is in line with relevant research (Rutterford, Sotiropoulos, and van Lieshout Reference Rutterford and Sotiropoulos2017). It appears that less wealthy investors were more prepared to buy risky corporate securities, but as Rutterford, Sotiropoulos, and van Lieshout (Reference Rutterford and Sotiropoulos2017) have pointed out, geographical proximity engendered trust or informal networks, which may have provided an alternative risk reduction strategy to the more conventional spreading of risk across uncorrelated securities. Indeed, a group comprising 35.1 percent of the total sample that mostly includes less wealthy male investors, invested almost exclusively in U.K. non-railway corporate securities. On the other hand, female investors showed a relative preference for government stock and railway securities. At higher portfolio values, investors were more willing to follow contemporary advice, spreading risk across a number of securities (with 11 percent of portfolios having 11 or more securities) and diversifying internationally, with a focus on government securities and railways. However, the levels of international diversification were not as high as recommended, in 1907, by Lowenfeld.
All in all, 57.8 percent of the Victorian investors in our sample held portfolios with no more than two holdings, a sign of poor diversification. It would appear that most U.K. investors left the application of sophisticated security selection rules to investment professionals, only partially adopting a global distribution of risks strategy. Small investors may also have been unable to diversify as much as they wished, given relatively high transaction costs for small size trades. Overall, investors did diversify their portfolios across domestic and overseas markets, but not to the extent recommended by contemporary advice.
Appendix
Variable Definitions for Regressions