Introduction
Amnestic mild cognitive impairment (aMCI) is usually considered as a prodromal phase of Alzheimer's disease (AD). Although aMCI is traditionally characterized by deficits in memory function, recent research suggested that disruption in attention is also present early in aMCI and may be associated with the later development of AD (Silveri, Reali, Jenner, & Puopolo, Reference Silveri, Reali, Jenner and Puopolo2007; Van Dam et al., Reference Van Dam, Sano, Mitsis, Grossman, Gu, Park and Fan2013).
Due to its high temporal resolution, event-related potential (ERP) is a powerful non-invasive tool for studying brain activities of cognitive processing. The P300 (or ‘P3b’) is a late scalp-positive ERP component elicited by low-probability task-relevant stimuli during stimulus discrimination tasks in visual, auditory, and somatosensory modalities. Importantly, P300 is believed to reflect cognitive functions that are engaged during the active processing of behaviorally significant events and functionally linked to attentional resource allocation and memory updating operations in the brain (Polich, Reference Polich2007).
Studies have consistently reported that P300 latency is significantly longer in AD as compared to healthy controls (Morrison, Rabipour, Knoefel, Sheppard, & Taler, Reference Morrison, Rabipour, Knoefel, Sheppard and Taler2018; Morrison, Rabipour, Taler, Sheppard, & Knoefel, Reference Morrison, Rabipour, Taler, Sheppard and Knoefel2019), and P300 latency also shows changes in other dementias such as frontotemporal dementia (FTD) (Chen et al., Reference Chen, Zhou, Liu, Zhang, Zhang and Liu2015; Jimenez-Escrig et al. Reference Jimenez-Escrig, Fernandez-Lorente, Herrero, Baron, Lousa, de Blas and Gobernado2002), dementia with Lewy bodies (Bonanni et al., Reference Bonanni, Franciotti, Onofrj, Anzellotti, Mancino, Monaco and Onofrj2010), and vascular dementia (Khedr et al., Reference Khedr, Hamed, El-Shereef, Shawky, Mohamed, Awad and Eltahtawy2009; Yamaguchi, Tsuchiya, Yamagata, Toyoda, & Kobayashi, Reference Yamaguchi, Tsuchiya, Yamagata, Toyoda and Kobayashi2000), as well as in other neuropsychiatric disorders such as schizophrenia (Jeon & Polich, Reference Jeon and Polich2003) and depression(Vandoolaeghe, van Hunsel, Nuyten, & Maes, Reference Vandoolaeghe, van Hunsel, Nuyten and Maes1998). In addition, some studies have indicated that P300 latency may be a potential marker to differentiate between AD and other neuropsychiatric disorders (such as schizophrenia, depression, and FTD) (Babic Leko et al., Reference Babic Leko, Krbot Skoric, Klepac, Borovecki, Langer Horvat, Vogrinc and Simic2018; Gordon, Kraiuhin, Harris, Meares, & Howson, Reference Gordon, Kraiuhin, Harris, Meares and Howson1986). Recently, meta-analyses have shown that P300 latency is significantly longer in patients with MCI than healthy controls, and even longer in AD patients than MCI patients (Howe, Bani-Fatemi, & De Luca, Reference Howe, Bani-Fatemi and De Luca2014). Furthermore, longitudinal studies suggested that P300 latency may be a sensitive indicator for early cognitive decline or disease progression in MCI and AD patients (Fruehwirt et al., Reference Fruehwirt, Dorffner, Roberts, Gerstgrasser, Grossegger, Schmidt and Benke2019; Jiang et al., Reference Jiang, Qu, Wang, Liu, Qiao, Qiu and Yang2015). Taken together, these results provide robust evidence for the use of P300 latency as a biological marker for indicating AD.
Despite extensive study, the intracerebral origin of P300 is still not completely understood. Current studies have reported that P300 generation stems from frontal, temporal, and parietal activations (Polich, Reference Polich2007). Another opinion suggests that P300 represents a complex summation of activity from the limbic system and associated areas of the cerebral cortex (Guo et al., Reference Guo, Tang, Li, Zhang, Li, Sheng and Wang2014). AD subjects show the largest reduction in P300 over parietal areas (Holt et al., Reference Holt, Raine, Pa, Schneider, Henderson and Pollock1995), while schizophrenic subjects show smaller P300 over the left temporal scalp site than the right (Salisbury, Shenton, & McCarley, Reference Salisbury, Shenton and McCarley1999). Studies have showed that grey matter (GM) alterations are correlated with P300 abnormalities in subjects at high risk for psychosis, first-episode and chronic schizophrenia (Fusar-Poli et al., Reference Fusar-Poli, Crossley, Woolley, Carletti, Perez-Iglesias, Broome and McGuire2011; McCarley et al., Reference McCarley, Shenton, O'Donnell, Faux, Kikinis, Nestor and Jolesz1993; McCarley et al., Reference McCarley, Salisbury, Hirayasu, Yurgelun-Todd, Tohen, Zarate and Shenton2002). In the latest National Institute on Aging and the Alzheimer's Association (NIA-AA) research framework on AD, structural magnetic resonance imaging (MRI) although not specific for neurodegeneration due to AD, provides a more powerful predictor of future cognitive decline when combined with an abnormal amyloid biomarker (Jack et al., Reference Jack, Bennett, Blennow, Carrillo, Dunn, Haeberlein and Sperling2018). In MCI, one meta-analysis has showed that GM reductions are present in the medial temporal lobe (including entorhinal cortex, hippocampus, parahippocampus, amygdala, and uncus), temporal cortex, thalamus, and cingulate cortex (Yang et al., Reference Yang, Pan, Song, Huang, Li, Chen and Shang2012). However, it is not known how P300 latency and change of GM volume are related in MCI.
Therefore, the objective of the present study was to examine the relationship between regional GM volume and P300 latency in aMCI and controls. On the basis of the evidence above, we hypothesized that the aMCI group would show abnormal regional GM volume and P300 latency compared to controls and these abnormalities would be directly related.
Materials and methods
This study was conducted in three parts as follow: Firstly, all subjects underwent a neuropsychological assessment for the analysis of multidimensional cognitive function. Subsequently, ERPs were measured by electroencephalogram (EEG) based on a visual oddball paradigm, and the task-related neurophysiological and behavioral data were collected. Finally, structural MRI scans were conducted to assess the whole-brain GM volume. The experimental flowchart for the present study is shown in Fig. S1.
Subjects
This study initially recruited 291 elderly individuals, through normal community health screening in Xinxiang, Henan. After the clinical screening (see online Supplementary Material), a total of 92 subjects signed written informed consents and further finished the neuropsychological assessment, including 44 aMCI and age, gender well-matched 48 normal controls (NC). All subjects were aged between 50 and 80 years, and biologically right-handed. Finally, 76 subjects (38 aMCI and 38 NC) finished the ERP measurement and structural MRI scan. Of these subjects, four aMCI and four NC subjects were excluded due to excessive signal artifacts in the EEG. The remaining 34 aMCI and 34 NC subjects were included in the final statistical analyses. This study was approved by the Human Participants Ethics Committee of the Affiliated ZhongDa Hospital, Southeast University and Henan Mental Hospital, the Second Affiliated Hospital of Xinxiang Medical University.
Neuropsychological assessment
Each subject underwent a standardized clinical interview and a comprehensive neuropsychological assessment that were performed by neurologists (Drs Gu and Gao) in Henan Mental Hospital, the Second Affiliated Hospital of Xinxiang Medical University, Xinxiang, Henan. The neuropsychological assessments were used to evaluate the multi-domains of cognitive function, including general cognitive function, episodic memory, information processing speed, executive function, and visuospatial function. Details regarding the neuropsychological assessments are provided in online Supplementary Material.
Inclusion and exclusion criteria
All aMCI subjects met the diagnostic criteria proposed by Petersen et al. (Reference Petersen, Smith, Waring, Ivnik, Tangalos and Kokmen1999) and the revised consensus criteria of the International Working Group on aMCI (Winblad et al., Reference Winblad, Palmer, Kivipelto, Jelic, Fratiglioni, Wahlund and Petersen2004), including (1) subjective memory impairment corroborated by the subject and an informant, (2) objective memory performance documented according to an Auditory Verbal Memory Test-delayed recall score that was within ⩽1.5 s.d. of age- and education-adjusted norms (the cutoff was ⩽4 correct responses on 12 items for ⩾8 years of education), (3) normal general cognitive function as evaluated by a Mini mental state exam (MMSE) score of 24 or higher, (4) a Clinical Dementia Rating of 0.5, with at least a 0.5 in the memory domain, (5) no or minimal impairment in daily living activities, and (6) absence of dementia, symptoms that were not sufficient to meet the criteria of the National Institute of Neurological and Communicative Disorders and Stroke or the AD and Related Disorders Association criteria for AD. Exclusion criteria were as follows: (1) past history of known stroke (modified Hachinski score of >4), alcoholism, head injury, Parkinson's disease, epilepsy, major depression (excluded by Self-Rating Depression Scale), or other neurological or psychiatric illness (excluded by clinical assessment and case history), (2) major medical illness (e.g. cancer, anemia, and thyroid dysfunction), (3) severe visual or hearing loss, and (4) T2-weighted MRI showing major white matter (WM) changes, infarction, or other lesions (HSZ and BW, as radiologists, analyzed the scans).
The NC subjects were required to have a clinical dementia rating of 0, an MMSE score of ⩾26, and a delayed recall score of >4 for those with ⩾8 years of education. All subjects underwent a standardized clinical interview including demographic inventory, medical history, and neurological and mental status examination.
Apolipoprotein E genotyping
Each subject's genomic DNA was extracted from 250 μL EDTA-anticoagulated blood, using a DNA direct kit (Tiangen, China). A polymerase chain reaction-based restriction fragment length polymorphism (PCR-RFLP) assay detected the alleles of rs7412 and rs429358, and the haplotype of rs7412 and rs429358 determined the apolipoprotein E (APOE) genotype. The specific process is provided in online Supplementary Material.
Experimental task
This study employed a visual oddball paradigm (Walz et al., Reference Walz, Goldman, Carapezza, Muraskin, Brown and Sajda2014). The experiment was performed with E-Prime 2.0 software. The 180 total stimuli were presented for 200 ms each with a 2–3 s uniformly-distributed variable inter-trial interval and a probability of target 1/5. The first two stimuli were constrained to be standards. The target and standard stimuli were a large red circle and a small green circle on gray backgrounds, respectively. Subjects were asked to respond to target stimuli, using a button press with the right index finger.
EEG acquisition and analysis
EEG measurements were recorded using a BrainAmp MR portable ERP system (Brain Products GmbH; Munich, Germany) with 64 scalp electrodes, and performed by LJG and LHG in Henan Mental Hospital, the Second Affiliated Hospital of Xinxiang Medical University. Electrodes were located according to the extended international 10–20 system. The reference was set at the mid-frontal position FCz. Impedances were kept below 10 kΩ. The EEG was band-pass filtered online from 0.1 to 100 Hz and a gain of 20 000. EEG data were analyzed with Brain Vision Analyzer software (Brain Products GmbH; Munich, Germany) and performed by LJG and LHG. In offline analyses, data were referenced to the average reference and band-pass filtered from 0.01 to 30 Hz. Ocular artifact correction was performed using independent component analysis. EEG signals with an amplitude larger than ±100 μV were rejected. To calculate the ERP, epochs of EEG were averaged from 200 ms pre-stimulus to 800 ms post-stimulus relative to a 100 ms pre-stimulus baseline.
MRI data acquisition
MRI images were acquired using a 3.0 Tesla Trio Siemens scanner (Siemens, Erlangen, Germany) with a 12-channel head-coil at Henan Mental Hospital, the Second Affiliated Hospital of Xinxiang Medical University, and MRI scan was performed by HSZ and BW. High-resolution T1-weighted axial images covering the whole brain were acquired by 3D magnetization prepared rapid gradient echo (MPRAGE) sequence as described below: TR = 2530 ms, TE = 2.43 ms, FA = 7°, acquisition matrix = 256 × 256, FOV = 256 × 256 mm, thickness = 1.0 mm, gap = 0 mm, number of slices = 192, and voxel size = 1 × 1 × 1 mm3. Additionally, routine axial T2-weighted images were acquired to rule out the subjects with major WM changes, cerebral infarction, or other lesions using flair sequence as below: TR = 4000 ms, TE = 96 ms, FA = 150°, acquisition matrix = 256 × 256, FOV = 230 × 230 mm, thickness = 5.0 mm, gap = 0 mm, and number of slices = 20.
MRI data analysis
Voxel-based morphometry (VBM) analysis for volume analysis was performed by LJG and HS, using VBM8 toolbox in SPM8 (VBM8 toolbox, http://dbm.neuro.uni-jena.de/vbm). Briefly, the individual T1-weighted images were segmented into GM, WM, and cerebrospinal fluid (CSF). To create the study group-specific template, the high-resolution structural GM images for all subjects were averaged, and this template was then normalized to the Montreal Neurological Institute (MNI) space. The second segmentation was performed by using spatial normalization parameters for the native images based on the study group-specific GM template. Then, the modulation was performed in a non-linear way using the Jacobian determinants derived from the spatial normalization process allowing to make inferences about absolute regional volume differences (Fritz et al., Reference Fritz, Wittfeld, Schmidt, Domin, Grabe, Hegenscheid and Lotze2014). Finally, normalized and modulated GM images were smoothed using 8 mm Gaussian kernel. Total intracranial volume (TIV) was calculated by summing the global volumes of GM, WM, and CSF from segmented images.
Statistical analysis
Demographic and neuropsychological data
The two-sample t tests and χ2 test were used to compare the demographic data and neuropsychological performances between aMCI and NC groups. Details are provided in online Supplementary Material.
Behavioral and ERP data
Statistically, independent two-sample t tests compared the mean reaction times, accuracy rates, and ERP data (amplitude and latency) between the aMCI and NC groups. The components of interest were from 250 to 500 ms at electrode Pz for P300. An α level of p < 0.05 was required for statistical significance.
Comparisons of GM volume between aMCI and NC groups
Statistical Parametric Maps (SPM) was used to compare GM volume by a voxel-wise two-sample t test, controlling for age, gender, years of education, APOE genotype, and TIV. The statistical threshold is p < 0.005 (AlphaSim) and cluster extent k > 46 voxels.
Relationships among cognitive performance, P300 latency, and GM volume in aMCI and NC groups
The linear regression model was used to examine the relationships among cognitive performance, P300 latency, and GM volume in each group. First, Statistical Product and Service Solutions (SPSS) 23 software was used for the correlations between cognitive performance and P300 latency in aMCI and NC groups, respectively. Second, based on the brain regions with group difference, SPM8 was used for the correlation between delayed P300 latency and reduced GM volume in each group. Third, at the whole-brain level, P300 latency and cognitive performance, respectively, was entered as a covariate of interest to regress against GM volumes in the aMCI group; and then the overlapping brain region was extracted from the two correlation analyses above. Age, gender, years of education, APOE genotype, and TIV of each participant were included in the model as nuisance variables. The statistical threshold is p < 0.05 (AlphaSim) and cluster extent k > 389 voxels. In addition, to test if the group factor showed any effect on the correlation between cognitive performance and P300 latency, we examined the interaction between the group and P300 latency on cognitive performance. We also investigated the interaction between the group and P300 latency on the GM volume within brain regions showing a significant group difference. Please refer to online Supplementary Material for details.
Mediation analysis
For the mediation analysis, PROCESS model 4 is used (Gong et al., Reference Gong, Yin, He, Ye, Bai, Yuan and Zhang2017), the independent variable (X) is the overlapping brain region, dependent variable (Y) is the cognitive performance [Stroop Color and Word Test A (Stroop) A score] based on the result from the correlations between P300 latency and cognitive performance, and the mediator (M) is the P300 latency. We included gender, age, years of education, and APOE genotype as covariates. This model is based on 10 000 bootstrap samples for bias-corrected bootstrap CI. The indirect effect is determined as significant at 95% CI which does not overlap with zero. A direct effect between X and Y is not a necessary prerequisite for mediation.
Results
Comparison of demographic and neuropsychological characteristics between aMCI and NC groups
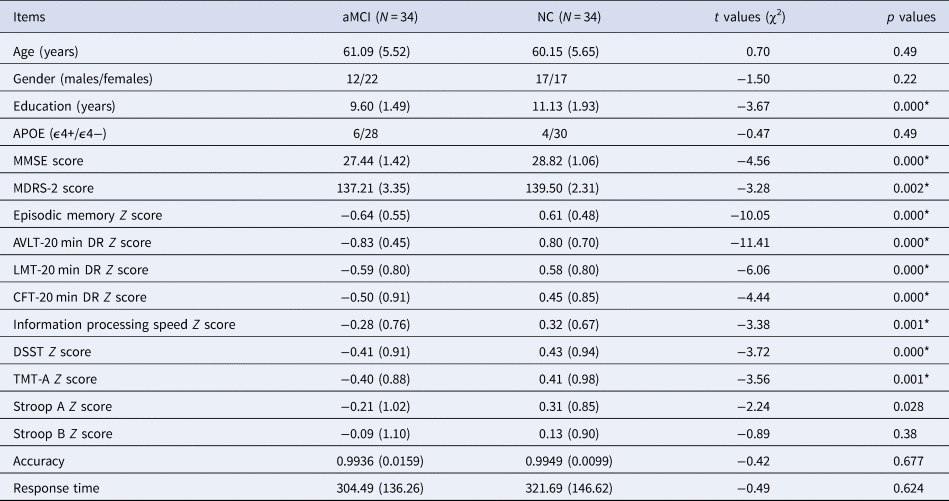
Demographic and neuropsychological characteristics are listed in Table 1. No significant differences in age, gender, or APOE genotype were found between aMCI and NC groups. Compared with the NC group, the aMCI group showed significantly lower years of education, and lower neuropsychological scores in the MMSE, Mattis Dementia Rating Scale-2 (MDRS-2), episodic memory, and information processing speed, respectively. Detailed raw scores and the corresponding Z scores from individual neuropsychological tests are provided in Table S1.
Comparison of clinical features and cognitive function between aMCI and NC groups

aMCI, amnestic mild cognitive impairment; NC, normal control; MMSE: Mini mental state exam; MDRS-2, Mattis Dementia Rating Scale 2; AVLT-20 min DR, Auditory Verbal Learning Test-20 min delayed recall; LMT-20 min DR, Logical Memory Test-20 min delayed recall; CFT-20 min DR, Rey-Osterrieth Complex Figure Test-20 min delayed recall; DSST, Digital Symbol Substitution Test; TMT-A, Trail Making Test-A; Stroop, Stroop Color and Word Test.
*Significant differences were found between aMCI and NC groups. p values were obtained by student t test except for gender and APOE genotype (χ2). Bonferroni correction for multiple comparisons was used for cognitive scores with the significance level considered at p < 0.0045 (p = 0.05/11 cognitive scores). For age, gender, education, APOE, accuracy, and response time, the statistical threshold was p < 0.05.
Comparison of behavioral results of task between aMCI and NC groups
Accuracy and response time are shown in Table 1. There was no significant difference in accuracy and response time in the visual oddball task between aMCI and NC groups.
Comparison of electrophysiological results between aMCI and NC groups
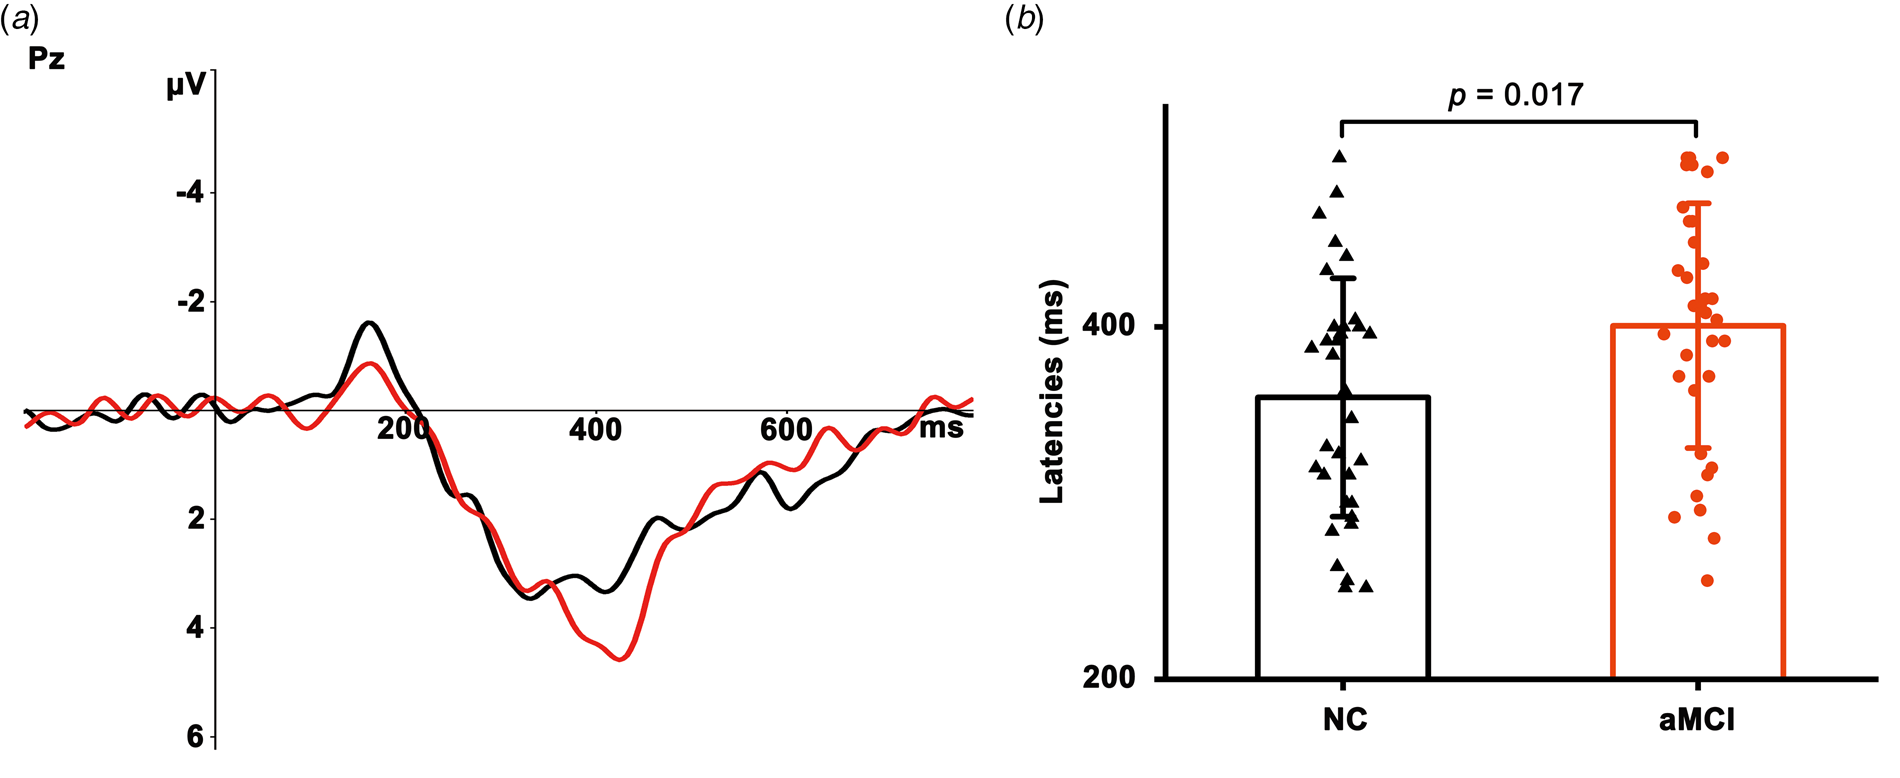
Figure 1a showed grand average ERP waveforms at the parietal site. The P300 latency was significantly longer in the aMCI (mean = 400.71 ms, s.d. = 69.45) than in the NC group (mean = 360.00 ms, s.d. = 67.65) (t = 2.45, p = 0.017, Fig. 1b). However, there was no significant difference in P300 amplitude between aMCI and NC groups (mean P300 amplitude in aMCI = 6.22 μV, s.d. = 4.50; mean P300 amplitude in NC = 5.52 μV, s.d. = 4.42; t = 0.64, p > 0.05).
Grand-average ERP waveforms at Pz site. (a) The red and black lines representing ERP waveforms for aMCI and NC groups, respectively. (b) Comparison of P300 latency between aMCI and NC groups, data were presented as mean ± stand deviation (s.d.). aMCI, amnestic mild cognitive impairment; NC, normal controls.

Comparison of GM volume between aMCI and NC groups
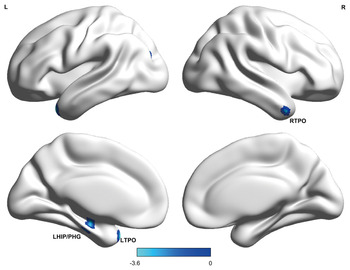
Compared with the NC group, the aMCI group showed reduced GM volumes in those regions, including bilateral temporal pole and left hippocampus/parahippocampal gyrus (HIP/PHG) (see Fig. 2).
Results from the analysis of voxel-based morphometry in Statistical Parametric Maps (SPM) for GM volume in the whole brain. Relative to the NC group, the aMCI group showed reduced GM volumes in the bilateral temporal pole and left hippocampus/parahippocampal gyrus (voxelwise p < 0.005, cluster size >46). RTPO, right temporal pole; LTPO, left temporal pole; LHIP/PHG, left hippocampus/parahippocampal gyrus.

Relationships among cognition, P300 latency, and GM volume in aMCI and NC groups
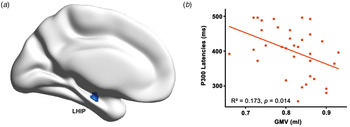
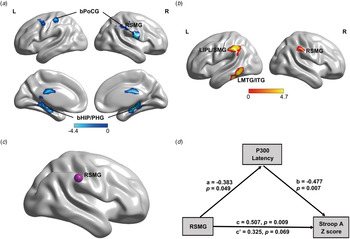
First, the regression analysis demonstrated that information processing speed (Z score) was negatively correlated with P300 latency only in the aMCI group (r = −0.394, p = 0.031) (see Fig. S2A), with the main contribution from Stroop A score (Z score) (r = −0.576, p = 0.001) (see Fig. S2B). Second, based on the brain regions with group difference, delayed P300 latency was negatively correlated with reduced GM volume in left hippocampus in the aMCI group (r = −0.416, p = 0.014; see Fig. 3), not in the NC group. However, no significant correlation between Stroop A score (Z score) and GM volume in the aMCI group. Third, in the whole-brain analysis, there were negative correlations between P300 latency and GM volumes in bilateral HIP/PHG, bilateral postcentral gyrus, right supramarginal gyrus (SMG) (see Fig. 4a), and positive correlations between Stroop A score (Z score) and GM volumes in the left middle temporal gyrus/inferior temporal gyrus, left inferior parietal lobule/SMG, right SMG (see Fig. 4b) in the aMCI group. Notably, only right SMG was the overlapping brain region, in which the right SMG volume was correlated with P300 latency and Stroop A score (Z score) in the aMCI group (see Fig. 4c).
Correlation of delayed P300 latencies with reduced GM volumes in the aMCI group. LHIP, left hippocampus.

The relationships between altered P300 latencies and the whole-brain GM volumes, and Stroop A scores (Z scores) in the aMCI group. (a) Correlation of P300 latencies with GM volumes in the aMCI group. (b) Correlation of Stroop A scores (Z scores) with GM volumes in the aMCI group. (c) The overlapping brain region (RSMG) from (a) and (b). (d) The simple mediation model shows P300 latencies completely mediate the association between RSMG volumes and Stroop A scores (Z scores) in the aMCI group. All observed variables are adjusted for age, gender, years of education, and APOE genotype. RSMG, right supramarginal gyrus; Stroop, Stroop Color and Word Test.

GM volume-cognition links mediated by ERP latency in the aMCI group
Mediation analysis showed that delayed P300 latency significantly mediated the effect of right SMG volume on Stroop A score (Z score) in the aMCI group [indirect effect, β = 0.183, 95% CI =(0.005–0.510), see Fig. 4d].
Discussion
The present study is the first to investigate the relationship between P300 latency and GM volume in subjects with aMCI. We found that the aMCI group had delayed P300 latency and reduced brain volumes particularly in the left HIP/PHG and bilateral temporal regions. In the aMCI group, delayed P300 latency was directly related to the reduced medial temporal volume. Moreover, P300 latency significantly mediated the effect of right SMG volume on information processing speed indicated by Stroop A scores in the aMCI group.
The aMCI patients showed reduced GM volumes in the bilateral temporal pole and the left HIP/PHG, which further supports the previous studies from our and group others (Xie et al., Reference Xie, Bai, Yuan, Yu, Shi, Yuan and Zhang2015; Yang et al., Reference Yang, Pan, Song, Huang, Li, Chen and Shang2012). Hippocampal atrophy is closely related to memory deficits, and maybe a candidate objective marker to monitor disease progression in the clinic (Petersen et al., Reference Petersen, Jack, Xu, Waring, O'Brien, Smith and Kokmen2000). According to a meta-analysis of MRI studies, as compared with aging controls, MCI patients showed a reduced bilateral hippocampal volume (Shi, Liu, Zhou, Yu, & Jiang, Reference Shi, Liu, Zhou, Yu and Jiang2009). However, some studies reported significantly lower volume only in the left hippocampus (Eckerström et al., Reference Eckerström, Olsson, Borga, Ekholm, Ribbelin, Rolstad and Malmgren2008; Muller et al., Reference Muller, Greverus, Dellani, Weibrich, Wille, Scheurich and Fellgiebel2005; Xie et al., Reference Xie, Bai, Yuan, Yu, Shi, Yuan and Zhang2015), which was consistent with our finding.
P300 latency is thought to reflect the speed of neural events underlying perception and discrimination of the target stimulus (Kutas, McCarthy, & Donchin, Reference Kutas, McCarthy and Donchin1977). This study found delayed P300 latency in the aMCI group, and the delayed latencies were negatively correlated with Stroop A scores (Z scores) in the aMCI group. One meta-analysis showed MCI patients had significantly longer P300 latency compared to controls and shorter latency than AD patients (Jiang et al., Reference Jiang, Qu, Wang, Liu, Qiao, Qiu and Yang2015). In addition, longitudinal studies have found significant increases in P300 latency in MCI patients with time. The evidence suggests that P300 latency reflects information processing speed and maybe a potential biomarker for attention impairment of AD.
This study found a negative correlation between delayed P300 latency and reduced GM volume in the left hippocampus in the aMCI group, and in the whole-brain analysis, there was also a negative correlation between P300 latency and the reduced volume in the bilateral HIP/PHG in the aMCI group. The evidence from human intracranial recordings, lesion studies, and functional imaging with source analysis has consistently reported that the generators of the P300 include the parietal cortex, temporal–parietal junction, and medial temporal complex (Linden, Reference Linden2005), and the hippocampus is postulated as one of the main generators (Ludowig, Bien, Elger, & Rosburg, Reference Ludowig, Bien, Elger and Rosburg2010). Our and previous studies have found that P300 latency reflects stimulus processing speed with longer latency, signifying inferior cognitive performance (Bramon et al., Reference Bramon, McDonald, Croft, Landau, Filbey, Gruzelier and Murray2005). In addition, in schizophrenic patients, a negative relationship between smaller left hippocampal volume and prolongation of P300 latency has been reported (Dutt et al., Reference Dutt, Ganguly, Shaikh, Walshe, Schulze, Marshall and Bramon2012), and the temporo-limbic system theory of schizophrenia indicates that the hippocampus is an integrator of heavily processed sensory information (Bogerts, Reference Bogerts1997). Research in rabbits by an extracellular recording of neuronal activity suggested that hippocampal dysfunction leads to unstable processing of selective attention, and deficits in the registration of memory (Vinogradova, Reference Vinogradova2001). Moreover, one study investigated the effects of hippocampal damage on P300 in a patient with bilateral hippocampal lesions and suggested that hypofunction of the hippocampus resulted in delayed P300 latency (Fushimi, Matsubuchi, & Sekine, Reference Fushimi, Matsubuchi and Sekine2005). The evidence supports our finding and suggests that the hippocampus may be involved in the processing of attention.
Interestingly, P300 latency significantly mediated the association between right SMG volume and Stroop A score (Z score) in the aMCI group. One review suggests that right temporal–parietal junction including the right SMG is critical for attentional control (Geng & Vossel, Reference Geng and Vossel2013). Although P300 is likely to have multiple neural sources, the temporal–parietal junction (particularly in the SMG) appears to be the most prominent source for P300 (Bledowski et al., Reference Bledowski, Prvulovic, Hoechstetter, Scherg, Wibral, Goebel and Linden2004b; Bledowski, Prvulovic, Goebel, Zanella, & Linden, Reference Bledowski, Prvulovic, Goebel, Zanella and Linden2004a). In addition, we have mentioned that P300 latency reflects stimulus processing speed and Stroop A reflects information processing speed. The evidence indeed supports the relationships among the right SMG volume, P300 latency, and information processing speed.
There are limitations to this study. The diagnosis of aMCI was based on clinical criteria, and not the assessment of AD-related neuropathologic biomarkers from CSF or positron emission tomography amyloid-β imaging. In addition, the sample size was still relatively small, which might influence the results. Finally, this study was designed as a cross-sectional study. Prospective longitudinal studies assessing these relationships over time will help to further investigate the importance of P300 latency in the diagnosis and development of AD.
Conclusions
Delayed P300 latency is associated with reduced left hippocampal volume in aMCI subjects, suggesting that this reduction may be the potential structural basis of delayed P300 latency. Moreover, P300 latency mediated the association between right SMG volume and information processing speed in the aMCI group, indicating that P300 latency may be a potential biological marker of attention dysfunction in aMCI patients.
Supplementary material
The supplementary material for this article can be found at https://doi.org/10.1017/S0033291720000811
Acknowledgements
We would like to thank all study participants, without whom this research would not have been possible. ZJZ conceived and designed the study. HXZ was in charge of the clinical research and worked with colleagues for carrying out the clinical protocols and participated in the recruitment of the study subjects, biospecimen collection, and clinical evaluation (LJG, LHG, JLZ, RZS, KL, XRL). JC was in charge of compiling the oddball task and worked with the colleagues for ERP measurement (LJG, LHG). HSZ was in charge of an MRI scan and worked with a colleague for quality control (BW). YCS was in charge of APOE genotyping. ZJZ, LJG, LHG, and HS analyzed data and interpreted the results. ZJZ and LJG finished the draft manuscript. All authors read, critically revised, and approved the manuscript.
Financial support
This study has been supported by grants from the National Natural Science Foundation of China (ZJZ, grant numbers 81420108012, 81671046), Program of Excellent Talents in Medical Science of Jiangsu Province (ZJZ, grant number JCRCA2016006), and Special Project of Clinical Medicine Science and Technology in Jiangsu Province (ZJZ, grant number BL2014077).
Conflict of interest
None.
Ethical standards
The authors assert that all procedures contributing to this work comply with the ethical standards of the relevant national and institutional committees on human experimentation and with the Helsinki Declaration of 1975, as revised in 2008.