

1. Introduction
Industrialization and globalization are without a doubt the two most important phenomena of the period 1800–1914, and the connection between the two has already been shown to be unequivocal (Findlay and O'Rourke Reference Findlay and O'Rourke2007, pp. 310–64). One of the key elements of the globalization process was the trade boom, which far outstripped that achieved in preceding centuries (O'Rourke and Williamson Reference O'Rourke and Williamson1999; Findlay and O'Rourke Reference Findlay, O'Rourke, Bordo, Taylor and Williamson2003).
Although opinion is unanimous regarding the importance of the trade boom, there exists an intense debate concerning its causes. There is widespread agreement that rising incomes were, obviously, a fundamental cause of increasing trade (Irwin Reference Irwin2002; Estevadeordal, Frantz and Taylor Reference Estevadeordal, Frantz and Taylor2003; Jacks and Pendakur Reference Jacks and Pendakur2008), while trade liberalization and exchange rate stability were also extremely important (Jacks Reference Jacks2006; Estevadeordal, Frantz and Taylor Reference Estevadeordal, Frantz and Taylor2003; López-Cordova and Meissner Reference López-Cordova and Meisnner2003). By contrast, the debate regarding the role of the reduction of transport costs is by no means closed (O'Rourke and Williamson Reference O'Rourke and Williamson1999; Jacks, Meissner and Novy Reference Jacks, Meissner and Novy2008; Jacks and Pendakur Reference Jacks and Pendakur2008). Other possible relevant variables may be the stock of immigrants and colonial status (Dunlevy and Hutchinson Reference Dunlevy and Hutchinson1999; Jacks Reference Jacks2005; Mitchener and Weidenmier Reference Mitchener and Weidenmier2008).
A recent review of the principal determinants of trade growth in the first wave of globalization concluded that the key factors were changes in output and the reduction of trade barriers, the latter having greater weight. However, in the case of Europe the contribution of the two factors was estimated to be equivalent (Jacks, Meissner and Novy Reference Jacks, Meissner and Novy2009).
International trade in agricultural and food products also grew during the nineteenth century, and its rise was rapid comparable to that of total trade (Aparicio, Pinilla and Serrano Reference Aparicio, Pinilla, Serrano, Lains and Pinilla2009). The analysis of trade in this type of product has mainly focused on the ‘invasion’ of Europe (particularly by cereals from America and the Russian Empire) and its impact on local agriculture, trade policy responses and economic development in general.Footnote 1
Such analyses are of course highly relevant with regard to Mediterranean countries’ imports and the impact of the ‘invasion’ on their agriculture. However, the southern European nations also played a key role in international trade as exporters, enjoying not only a clear competitive advantage but also a centuries-long tradition of producing certain goods, in particular olive oil, wine and fruit and vegetables. Indeed, a number of recent papers have dealt with precisely this subject, focusing on international competition in these products and the effects of importers’ trade policies.
In the cases of the wine and olive oil sectors, the literature refers above all to intra-Mediterranean competition (including the discriminatory trade policy applied by France) and the trade barriers erected in the American continent to protect its young domestic wine industry.Footnote 2 As for Mediterranean horticulture, the main focus has been competition between California and the Mediterranean countries.Footnote 3 The shifts in the demand curves for such products, due to rising incomes in the most industrialized countries, have also received a certain amount of attention.Footnote 4
The aim of the present article is to examine how globalization and the profound economic changes produced by the industrialization of the advanced nations offered the countries of the European periphery export opportunities in certain sectors where they enjoyed clear comparative advantages and a manifest complementarity with more developed economies.Footnote 5 In summary, it is a contribution to the debate on the impact of the globalization and industrialization of the countries of the ‘centre’ upon the backward countries of the southern periphery of Europe. Our intention is to establish what the principal determinants of the growth of international trade were in the first wave of globalization in these countries.
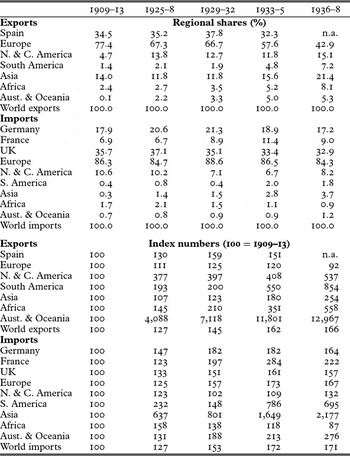
To this end, we have chosen as a case study Spanish exports of Mediterranean horticultural products, or MHPs. These comprise fresh fruit, dried fruit and fresh vegetables. Such products formed a significant part of the exports of the countries of the southern periphery of Europe and consequently provide a good example of the type of trade under analysis here. The case of Spain is of particular interest due to its significant share of the international market in these products; in the first third of the nineteenth century Spain accounted for approximately one-third of world exports of MHPs (see Table 1).
International trade in MHPs, 1909–38
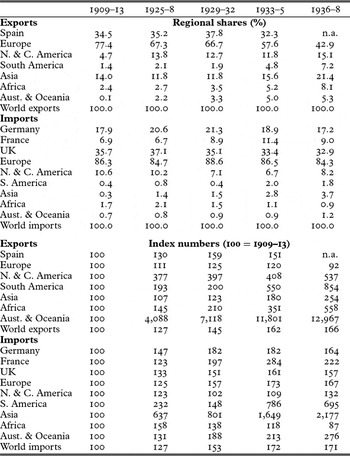
The table includes trade in oranges, lemons, table grapes and raisins. The quantities have been multiplied by their respective prices in 1925.
Source: Pinilla and Ayuda (Reference Pinilla, Ayuda and Pinilla2009), based on International Institute of Agriculture (1909–39).
Our hypothesis is that for this type of product the growth of international trade was principally determined by the changes directly produced by industrialization, such as rising incomes or technological progress. However, another series of changes which we may consider as fundamental in the process of market integration also played an important role. Of these, the most notable were the fall in transport costs and the process of trade liberalization. In our opinion, the relative weight of the two types of variables may differ significantly according to the type of products traded, something which analysis at a more aggregate level is unable to capture.
To examine the hypothesis, we propose a bi-equational supply and demand model for Spanish MHPs in the period 1870–1935. This permits us to determine the key variables in the tremendous expansion of Spanish exports of these products. Our econometric results underline the fact that in this case shifts to the right of the supply and demand curves were much more important than the reduction in transport costs and the liberalization of trade. Thus, rising incomes in the advanced countries and the greater profitability offered by MHPs compared to traditional products were the principal determinants of the growth in their exports.
Following this introduction, Section 2 presents a theoretical and empirical review of the causes of the growth of international trade during the first wave of globalization, with special reference to the products we shall study. Section 3 analyses the evolution of their international trade, and then assesses the role of Spain in the construction of the global market for MHPs. Sector 4attempts to establish the principal causes of the expansion of the Spanish MHP export sector, and we propose a bi-equational export supply and demand model. In Section 5 we explain the variables used in the model, and in Section 6 we then propose the corresponding econometric models and explain their results. The article ends with some general conclusions regarding the subject studied.
2. The causes of the growth of international trade in MHPs during the first wave of globalization: theory and historical evidence
In the first half of the nineteenth century, MHP production and trade was largely concentrated in the countries on the northern and southern shores of the Mediterranean Sea. There was also significant production in parts of the Far East, where favourable climatic conditions prevailed, but trade was limited. In most of western Europe, meanwhile, MHPs were considered exotic and their market presence was insignificant.
However, international trade in fruit and horticultural products surged from the mid nineteenth century to the first third of the twentieth, increasing its share of total trade in agricultural products (Aparicio, Pinilla and Serrano Reference Aparicio, Pinilla, Serrano, Lains and Pinilla2009). This growth in the volume of trade was due to commodity market integration (defined as globalization by Kevin O'Rourke and Jeffrey Williamson) and outward shifts in both the import demand and export supply curves.Footnote 6
Figure 1 shows the effect which a reduction of transport and tariff costs had upon international trade. We propose an S-curve for the supply of Spanish MHP exports to the rest of the world. As can be observed, the increase in the quantities launched onto the market depended basically on their price, p. In turn, M is the demand curve from the rest of the world for Spanish MHPs, which depended on the price at which they arrived on the market, p*. Logically, prior to globalization, high transport costs and tariff barriers to trade produced a distance t1 between Spanish export prices p and the prices at which Spanish fruit and vegetables arrived on the markets of the importing countries p*. A fall in transport costs and the process of tariff liberalization produced a reduction of the difference t1 between Spanish export prices p and those of the international markets p*, to t2. It can be seen that the simple reduction of transport costs and tariffs occurring during globalization generated an increase in the volumes traded, if all other factors remained constant.
Effect of globalization upon international trade
Source: Based on Harley (Reference Harley, Fisher, McInnis and Schneider1986, pp. 595–7) and O'Rourke and Williamson (Reference O'Rourke and Williamson2002, p. 24).

In Figure 2 we also depict the situation occurring when in addition to the increase in trade produced by globalization, there was also a shift to the right of the demand curve (due essentially to increasing incomes in the importing countries) and of the supply curve for Spanish exports (possibly as a result of technological change, the accumulation of capital or the cultivation of new lands). In this case, if t2 now remains constant, the quantities traded also increased, although for reasons different to those visible in Figure 1.
Effect of supply and demand shifts upon international trade
Source: Based on Harley (Reference Harley, Fisher, McInnis and Schneider1986, pp. 595–7) and O'Rourke and Williamson (Reference O'Rourke and Williamson2002, p. 24).

The rising consumption of MHPs in the more advanced countries and the gradual change in traditional diet were key factors in developing the export potential of producer countries. This increase in consumption was essentially a consequence of rising per capita income in the industrializing countries, as clearly illustrated by the case of the consumption of oranges in the UK, especially in the second half of the nineteenth century (Pinilla and Ayuda Reference Pinilla and Ayuda2008). Naturally, demand was also driven by rapid population growth during this period, and thus there was an evident shift in the demand curve.
The expansion of exports required factors to be reallocated, and in some cases this implied major changes in the production function which went far beyond a mere switch of resources to the products for which demand was strongest. Indeed, such changes involved a profound transformation of agriculture in those areas that were most directly engaged in international trade. Furthermore, this process did not take place in isolation from production for the domestic markets of the producer countries, but instead tended to incorporate similar processes of technological change, such as irrigation in areas that had previously cultivated rain-fed land crops, the more intensive use of new fertilizers, mechanization, the attempt to eradicate crop pests and blights, changes in crop varieties, etc. (Pinilla and Ayuda Reference Pinilla, Ayuda and Pinilla2009). The resulting shifts in both the supply and the demand curves were both linked and interdependent.Footnote 7
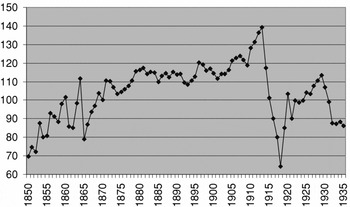
The expansion of trade in MHPs was also stimulated by the process of globalization, behind which falling transport costs and market liberalization were the principal driving forces.Footnote 8 The importance of market integration can be seen by using as a proxy an annual index of world trade intensity (the ratio of real-world exports to real-world GDP, both in US dollars) which we have estimated for the years 1850–1938.
These data, displayed in Figure 3, are richer than those so far published in other studies, which use benchmark years. They provide an overview of the depth and scope of the globalization process between 1850 and 1914. Obviously, however, the First World War resulted in a sharp halt, while the subsequent recovery never reached the heights of the pre-war years. Finally, the stock market crash of 1929 and the ensuing depression had a profound effect on globalization, which went into headlong retreat.

There is considerable consensus today regarding the fall in trade costs occurring in the first wave of globalization.Footnote 9 However, as we noted in the introduction, there are considerable discrepancies regarding the most important causes of this decrease. Jacks, Meissner and Novy (Reference Jacks, Meissner and Novy2009) have estimated that in the first wave of globalization this reduction amounted to approximately 33 per cent, with significant regional variations. As a number of studies have recently shown, market integration, measured as precisely as possible, i.e. through price behaviour, advanced significantly until 1914 and agricultural products participated strongly in this process of integration.
3. The building of a global market for Mediterranean horticultural products
The growth in MHP trade took place in a context of increasing competition in international markets (Pinilla and Ayuda Reference Pinilla, Ayuda and Pinilla2009). For a significant part of the later nineteenth century, competition was basically intra-Mediterranean, leading to specialization on the part of the producer countries (some countries achieved strong positions in certain products, such as Spain with oranges, Italy with lemons, Greece and Turkey with raisins). From the end of the nineteenth century onwards, however, the excellent trade prospects increased international competition in two ways: firstly, the progressive emergence of ‘new Mediterranean countries’ from within the same geographical area (North Africa and Mandatory Palestine); secondly, the rise of competitors in temperate zones outside the region (the USA, Brazil, Australia and South Africa). Expatriates of European descent played a key role in the promotion of Mediterranean agriculture in all of these areas. The USA (and, more specifically, California) was undoubtedly the competitor with the greatest capacity to threaten the dominant market position of the long-standing Mediterranean producers (Morilla, Olmstead and Rhode Reference Morilla, Olmstead and Rhode1999).
The principal importers of fruit and vegetables were the more developed countries, with the UK clearly at the head, followed by France, Germany, the USA, Canada, Belgium, Holland and Switzerland. The most remarkable change in the constitution of this group is the decline in US imports; it was the leading consumer of MHPs, but the decline in imports was due to the development of its domestic crops. Consequently, MHP supply came to be controlled by agriculture in California and other states specializing in these commodities. The combination of efficient, modern agriculture, excellent marketing and high protectionism had the effect of excluding from the US market a significant part of the fruit and vegetables produced by their traditional exporters. The data available for international trade in such products only begin in the twentieth century (and at different dates depending on the product), a fundamental shortcoming which makes it difficult to capture the events of the second half of the nineteenth century. In the light of British foreign trade statistics, however, it seems reasonable to indicate the sharp rise in MHP imports as the most notable feature of this period.Footnote 10 Nevertheless, as the nucleus of industrialized countries expanded, the UK's share of this trade in Europe gradually declined.
Based on data available for a range of products (see Table 1), Europe was the main importer of MHPs until the Second World War, accounting for over 84 per cent of the world market in them. The evolution of this trade over the first third of the twentieth century was determined by a number of developments, the most significant being the decline of US imports and the emergence (real or statistical, since trade in MHPs had not previously been registered) of small markets in Asia and South America, which were mainly supplied by neighbouring producers.
The leading exporters were initially the countries lying on the northern shore of the Mediterranean; these tended to monopolize the international markets in MHPs. The expansion of Spanish and Italian exports clearly illustrates the point to which certain traditional producers took advantage of the opportunities unveiling before them. With time, these countries began to face increasing competition from a significant number of non-European countries, particularly from the beginning of the twentieth century onwards. However, this did not result in any serious detriment to European exports. In absolute terms, they grew by approximately 20 per cent until the 1930s. The very low starting point of other regions meant they achieved proportionally much higher growth rates. On the basis of the limited evidence available, European exports increased where the pattern of demand was more dynamic, and levelled out or fell elsewhere.Footnote 11
Turning from the evolution of trade in absolute terms to an analysis of world market shares, we may note the general decline in the European market share caused by the emergence of new producers. New exporters of oranges were the USA, Brazil, South Africa, Japan and, above all, Palestine, which became the second largest exporter at world level, after Spain. In the lemon trade, only one European country, Spain, threatened Italian hegemony, and the continent's share was therefore not affected. Finally, Algeria and the USA became significant exporters of table grapes, and the USA and Australia of raisins.
However, these data conceal the main impact of increasing competition upon the traditional Mediterranean producers, namely the loss of exports to the USA, where the supply of MHPs was gradually taken over by domestic agriculture.Footnote 12 This notwithstanding, the damage to traditional exporters is not reflected in any serious fall in their exports (except in the case of raisins), or in the loss of relative market share (which was generally mild), but rather in the opportunities that would have existed in the world's biggest market had US agriculture failed to become able to supply its own market. Competition from California consequently affected the MHP exports of Mediterranean countries, which nevertheless displayed dynamic and expansive behaviour in the period under analysis.Footnote 13 In addition, international competition affected the prices of these products.
3.1. The Spanish role in the global MHP market
In our view, it is important to emphasize that the development and growth of specialized horticulture in Mediterranean countries such as Spain occurred simultaneously with the processes of industrialization and globalization themselves. Thus, the new opportunities that emerged in the second half of the nineteenth century led the Mediterranean countries to increase their production within the framework of a new pattern of specialized, intensive agriculture.
In the Spain of the mid nineteenth century, the production and exportation of MHPs was insignificant. Even in irrigated areas, the predominant crops were wheat, grapes and olives, and the main objective was to obtain regular production that depended to only a limited extent on rainfall, which was erratic in a country as arid as Spain. Logically, a secondary objective was also to increase production. Orange and other fruit trees were normally grown on the edges of irrigated smallholdings, while orchard plantations were extremely rare. Furthermore, in some areas there were small market gardens used for the summer production of vegetables, essentially for self-consumption, and to cultivate certain commercial products, such as textile fibres (hemp, flax and white mulberry leaves to feed silkworms).
The development of a system of agriculture that was commercial in nature and specialized in Mediterranean horticulture required significant modification with regard to traditional farming. Increasing production by the volume necessary to satisfy external demand was impossible using the old systems of cultivation. The necessary technical transformation required the implementation of a process in which the dynamism of supply was crucial, driven by the greater profitability of MHPs compared to traditional crops.Footnote 14
In Spain, the principal obstacle to this process was water: without irrigation, hardly any of the crops in question are viable in the Iberian Peninsula. Although expansion was possible in some areas, by changing land use in irrigated areas, it was also necessary to increase the supply of water to allow the transformation from dry-land to irrigated farming.Footnote 15 This increase was the result of public investment in major regulation and distribution projects (reservoirs and canals), and the digging of wells. However, the government was very slow to make any commitment to water-related civil engineering projects (which did not really get under way until the last decade of the nineteenth century) and the level of investment remained low, which limited its impact to areas specializing in Mediterranean horticulture (Pinilla Reference Pinilla2006).
As a result, private initiatives played the key role in increasing water supply, by tapping underground water using the latest technologies and using the energy derived from fossil fuels to provide irrigation.Footnote 16 Traditional multi-crop farming gave way to farms that specialized in a smaller range of products, which required not only water but also a series of technical innovations, such as the more intensive use of fertilizers (guano and, subsequently, chemical fertilizers), the introduction of new varieties, the combating of plant pests and diseases, etc.
The expansion of this type of agriculture took place above all in the areas closest to the Mediterranean coast, which enjoyed ideal environmental conditions and a locational advantage for access to international markets. Growth had already reached spectacular levels by the second half of the nineteenth century, although the absence of complete statistical data does not permit precise estimates. The main MHP crop, oranges, serves as an excellent example to gauge the early dynamism of the sector. In the Spanish provinces where the cultivation of oranges was particularly important, Castellón and Valencia, the area given over to the fruit increased from 1,249 hectares in 1860 (just ten years after cultivation in regular plantations is generally agreed to have begun) to 9,880 hectares by 1890. In these two provinces, the figure had reached 36,705 hectares by 1922 and 58,773 hectares by 1932, when there were almost 75,000 hectares under production in the whole of Spain.
The data for MHP production, although only available for the second phase of expansion (beginning at the start of the twentieth century), are also illustrative: between 1902 and 1932 the production of oranges and almonds doubled; that of lemons had multiplied five-fold; that of peaches and apricots doubled and quadrupled, respectively (from only 1910 onwards).Footnote 17 Simpson has calculated that the production of oranges in the province of Valencia increased at an annual rate of 3.8 per cent between 1881 and 1932 (Simpson Reference Simpson1995, p. 193).
Logically, the relative share of MHPs in total Spanish agricultural production (including livestock and forestry) also increased considerably. Fruit and horticultural products represented 7.4 per cent of total production in 1890, but by 1931 the figure was 14 per cent, while productivity had doubled in the same period.Footnote 18 The estimations of Simpson also display a formidable increase in relative weight; in 1897–1901 they accounted for 15.9 per cent of final agricultural production (without including the forestry sector), rising to 26.1 per cent in 1929–33.Footnote 19
Thus, Spain became the main world exporter of MHPs; throughout the first third of the twentieth century Spain's share always exceeded 30 per cent of total world exports. In the principal import market for this type of products, the UK, the Spanish position was even more important; at the end of the 1920s it accounted for over 70 per cent of the imports of oranges, table grapes, apricots and watermelons, and also had significant shares in other MHPs (Pinilla and Ayuda Reference Pinilla, Ayuda and Pinilla2009, p. 182).
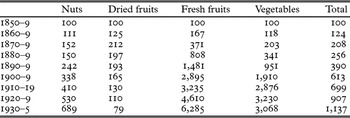
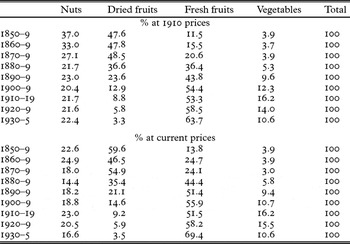
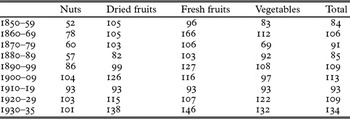
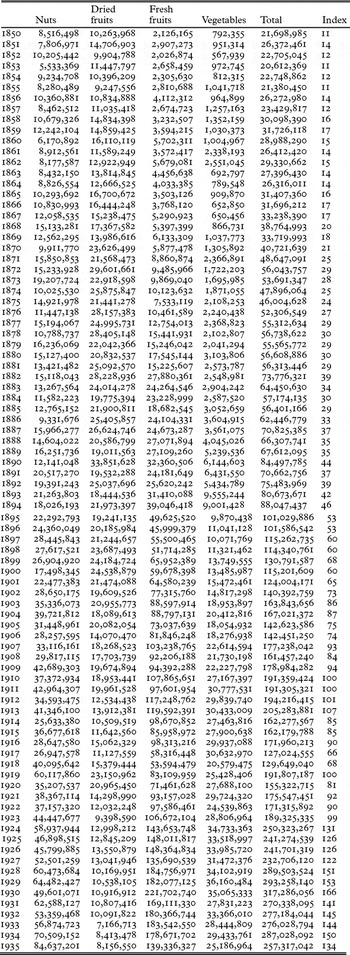
This dominant position was achieved by a truly impressive rise in Spanish exports. In 1930–5 fruit exports were 6,000 per cent higher in volume than in 1850–9, nut exports were almost 700 per cent higher and vegetable exports had increased by 3,000 per cent. Overall, export volumes increased by 1,100 per cent (Table 2). Meanwhile, the faster relative growth of fresh fruit and vegetable exports meant that their share of total MHP exports increased; in 1850 fresh fruit represented less than 15 per cent of such exports, but had risen to over 60 per cent by 1935 (Table 3).
Evolution of Spanish exports of Mediterranean horticultural products. Volume index (1850–1859 = 100) (1910 prices)
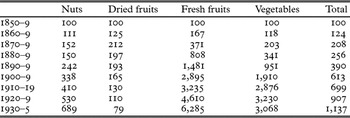
Source: Appendix, Table A1.
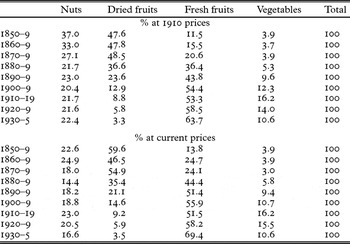
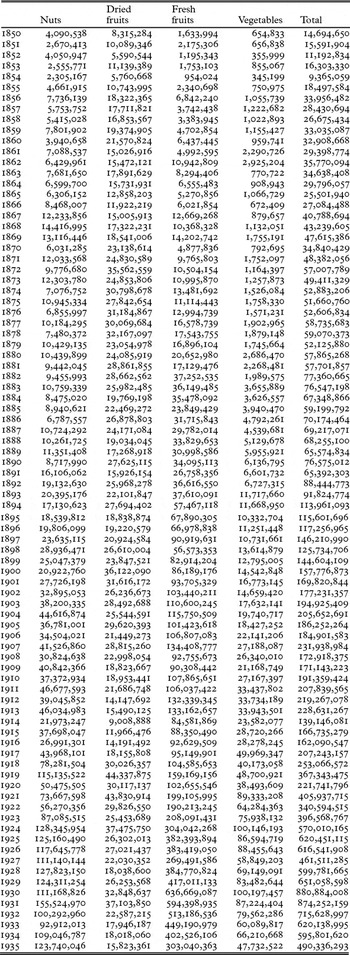
Due to this dramatic expansion, the share of MHPs in total Spanish exports of food, agricultural, livestock and forestry products increased substantially, from less than 15 per cent in 1850–9 to almost 50 per cent in 1930–5. Given that exports of agricultural and food products in the latter period represented 76.6 per cent of total Spanish exports, there can be no doubt that Mediterranean horticulture was essential to the financing of the imports required by an industrializing country, as Spain was at that time.Footnote 20
In the long run, Mediterranean horticulture was by far the most dynamic sector of Spanish agriculture, progressively concentrating an increasing volume of productive factors and making an essential contribution to Spain's export trade (Clar and Pinilla Reference Clar, Pinilla, Lains and Pinilla2009).
The importance of this trade is also reflected by the elevated share of exports in the total production of Spanish MHPs. Oranges were the principal Spanish export product; exports accounted for well over 60 per cent of domestic production, a figure which climbed as high as 90 per cent in the 1930s. The export share of production was also high for the other principal MHPs.
We now examine more closely the causes of this impressive expansion of Spanish MHPs, beginning by discussing the most suitable theoretical model for the purpose.
4. A theoretical model to explain the growth of Spanish MHP exports
For approximately the last fifty years there has been considerable interest in the estimation of time-series models for foreign trade flows. The most commonly used theoretical approach to determine a country's exports is based on the assumption that the price-elasticity of supply is infinite (at least in the long run), given the existence of a horizontal long-run export supply curve. The majority of empirical studies treat export prices as exogenous and have therefore focused exclusively on the estimation of demand functions, analysing only export volumes and consumer behaviour. A second common approach is to analyse producer behaviour, concentrating on the analysis of export prices based on estimates of supply functions. Consequently, few studies have utilized export prices and volumes simultaneously (Sawyer and Sprinkle Reference Sawyer and Sprinkle1999; Strauss Reference Strauss2004). However, whether we examine aggregate exports or the exports of a given product by a single country, it is unrealistic to imagine that volumes can significantly increase without price levels being affected, especially if the nation in question accounts for a significant part of total world supply.
The simultaneous analysis of export supply and demand was discussed in a seminal paper by Goldstein and Khan (Reference Goldstein and Khan1978), who found strong evidence of upward-sloping supply curves for eight OECD countries in the period 1955–70. However, remarkably few studies have amplified or deepened this promising start. The updating and perfecting of their work by Strauss (Reference Strauss2004) is a notable exception.
Following Goldstein and Khan, and using as the time horizon for our analysis the period 1870–1935 (coinciding with what has been called the first wave of globalization and with its backlash in the turbulent interwar years), we have estimated simultaneously a bi-equational supply–demand multivariate model for Spanish MHP exports.Footnote 21 This is an innovative approach because it combines and takes into account both the demand for and supply of exports in the study of historical problems.Footnote 22 We also attempt, following O'Rourke and Williamson (Reference O'Rourke and Williamson2002) and Strauss (Reference Strauss2004), to draw an analytical distinction between globalization and the classic variables of supply and demand to explain export growth.
This requires treating an increase in exports derived from improvements in the international division of labour (or greater market integration) separately. The simple export demand model derived from the CES production function cannot explain all export growth, as it does not contain all of the remaining conditions favouring export volumes from 1870 onwards. Similarly, the supply of exports as conventionally modelled fails to reflect the impact of market integration.
Trade liberalization boosted exports far beyond what can be captured by production figures. Falling transport costs were another factor, and their stimulation of international trade volumes has been well explained in the theoretical literature (Krugman Reference Krugman1980).
Thus, our model of the volume of Spanish MHP exports in demand worldwide (XD) will depend on the rest of the world's income (YW), the export prices of Spanish MHPs expressed in pesetas (PX), the consumer prices of importing countries, again expressed in Spanish pesetas (PW) and, finally, on two variables that seek to capture the effect of globalization, which consists of the evolution in real terms of international maritime transport costs (FR) and the level of tariff protection existing in international markets (T).

where

The consumer prices of importing countries expressed in pesetas are national prices converted to pesetas at the nominal peseta/foreign currency exchange rate.
In this model it is important to know whether the demand for MHP exports is ‘separable’. Separability implies that export demand depends on the volume of world trade and export prices relative to competitors’ prices. Non-separability implies that export demand depends on world income and that export prices are relative to the price index for world output. In the former case, agents decide first of all how much they want to import and only then do they decide where to obtain the goods; total imports and their provenance by country are separated. In the latter case, agents do not determine their import decisions in two separate stages. Instead the decision to import from country i is reached simultaneously with the decision to import from country j (Beenstock, Lavi and Ribon Reference Beenstock, Lavi and Ribon1994, pp. 334–5). In our case, we consider the hypothesis of non-separability to be the more logical, for three reasons. Firstly, if the level of aggregation for the categories of goods is defined too narrowly (as in the present case) the separability assumption is likely to be violated (Goldstein and Khan Reference Goldstein, Khan, Jones and Kenen1985, p. 1065). Secondly, the hypothesis of non-separability is more realistic when the exporting country has a dominant position in international markets and a significant share of the volume of trade in the corresponding products. As Table 1 shows, this assumption is realistic for the case of Spain in the first third of the twentieth century and even more so in the second half of the nineteenth century. Lastly, from a practical point of view, it would not be possible to construct MHP price series for exporting countries competing with Spain for the entire period under analysis, since the most important of them entered the international market after 1900.
Consequently, Spanish MHP exports depended on rising incomes in the rest of the world and the behaviour of MHP Spanish export prices relative to domestic prices in the countries of destination, as well as the opportunities derived from market integration, in turn caused by the first wave of globalization.
The supply of Spanish MHP exports depended on the relative profitability of exporting (RP), an index of Spain's MHP production capacity (C) and the impact of globalization via the variables defined above (FR and T).

where

The relative profitability of exporting is defined as the ratio of MHP export prices (PX) to domestic prices (P).
Exporters allocate output to the domestic and foreign markets according to the price signals they receive. This produces an upward export supply curve and the ensuing argument that a rise in exports depends on the strength of the export price increase. When absolute levels of exports are estimated, as is the case here, the trade-off between producing more exports and producing more non-tradable goods is of course weakened by an increase in the production capacity of the economy (Strauss Reference Strauss2004). Hence, trend (or potential) output should act as a positively signed shift variable for the export supply curve. The advantages of falling transport costs and trade liberalization for exporters should drive supply-side growth, and these factors are therefore also taken into account to reflect the impact of globalization.
To conclude, the volume of exports offered (XS) and their price (PX) will be determined by the solution to the following system:



Goldstein and Khan (Reference Goldstein and Khan1978) propose two versions of this model. The first (equilibrium) model, assumes that it contains no lags, and thus the adjustment of export quantities and prices to the respective equilibrium values is instantaneous. In the second (disequilibrium) model they admit the possibility that the adjustments of actual to equilibrium values are somewhat lagged. In our case, we propose both models, although we consider that the disequilibrium model is more appropriate. This is because within MHPs there exist annual crops which may be rapidly replaced, but also tree crops, where short-term response is constrained by factors like the available stock of trees, the time necessary for the trees to begin to produce, or by the resistance to change the crop due to the capital investment made in the trees planted.
Before we estimate these econometric models and discuss the results, we shall first describe the time series used.
5. Time series used for estimation
X is the world demand for Spanish MHPs, measured as the annual volume of exports. It is also the quantity of exports supplied.
We have obtained export volume data for 29 products from the Spanish Foreign Trade Statistics (Estadísticas del Comercio Exterior de España) and have multiplied them by 1910 prices.Footnote 23
YW is rest-of-the-world GDP. Given the impossibility of finding a series that would represent the GDP of the rest of the world, we have opted to construct a proxy based on figures for those countries that have continuous series for the period 1870–1935.Footnote 24 Thus, our variable is constructed from the aggregate GDP of Belgium, Denmark, France, Germany, Sweden, Switzerland, the United Kingdom and the USA. In the present case, this proxy variable may be considered both relevant and representative to measure the evolution of income in the countries where MHPs of Spanish origin were in demand, insofar as these were its main trade partners. Based on the data in Tena (Reference Tena, Carreras and Tafunell2006, pp. 614–15), 61.5 per cent of Spanish exports were sent to these countries (not including Denmark, Sweden and Switzerland) between 1850 and 1854. In 1900–4 they accounted for 71.0 per cent and 72.2 per cent in 1931–35 (including Denmark, Sweden and Switzerland, which three accounted for 4 per cent).
PX is the price index of Spanish horticultural exports; this was obtained by firstly multiplying our series of 29 products at current values by an index obtained from Tena (Reference Tena, Carreras and Tafunell2006, pp. 600–1), to correct the deviation of official from real values, as estimated by that author. Finally, we divided the series of current MHP values adjusted through the Tena index by the series of MHP exports by volume at 1910 prices.
PW is the French–UK consumer price index as a proxy of consumer prices for importing countries.Footnote 25
FR is a real-terms index of the evolution of international maritime transport prices, taken from Isserlis (Reference Isserlis1938).Footnote 26
T is a simple arithmetic mean of tariff protection in eight industrialized nationsFootnote 27 which were of enormous importance to Spanish exports. Based on the data in Tena (Reference Tena, Carreras and Tafunell2006, pp. 614–15), 60.8 per cent of Spanish exports were sent to these countries (not including Denmark, Sweden, Norway and Canada) between 1850 and 1854. In 1900–4 they accounted for 63.8 per cent (not including Denmark, Sweden, Norway and Canada), and in 1931–5 for 72.2 per cent (all countries included).Footnote 28
P is the domestic price index, constructed using the implicit cost of factors deflator for agriculture given in Prados de la Escosura (Reference Prados de la Escosura2003, pp. 359–61), while C is an index of domestic MHP production capacity.
Given that no annual data were kept on the area under MHP cultivation until 1929, or on the area under irrigation in Spain, we have opted to use gross agricultural value added (Prados de la Escosura, Reference Prados de la Escosura2003) as a proxy for production capacity (C). The main problem with this series is that it includes both dry-land and irrigated production, when the cultivation of the majority of MHPs requires irrigation in Spain.
6. Econometric models and empirical results
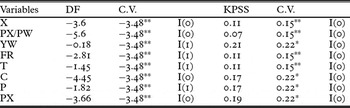
We performed a univariate analysis before specifying the models, since the data constitute time series. To this end we examined the graphs and correlograms, and applied the Dickey–Fuller (Reference Dickey and Fuller1979) (DF) test and the Kwiatkowski, Phillips, Schmidt and Shin (Reference Kwiatkowski, Phillips, Schmidt and Shin1992) (KPSS) test to assess the stationarity of the series. We present the values for the tests in Table 4, with the critical values (CV) at the 1 and 5 per cent significance levels.
Dickey-Fuller and Kwiatkowski et al. tests

**Critical values at the 5% significance level.
*Critical values at the 1% significance level.
The Dickey–Fuller test examines the null hypothesis that the series is I(1). It is generally accepted that this test has little power, and we therefore also present the results of another test that takes the opposite approach, i.e. it attempts to confirm the null hypothesis of stationarity against the alternative that the series are I(1), or non-stationary. Using the tables as basis, we conclude that most of the variables are stationary or trend stationary according to the DF test, while all of them are stationary or trend stationary if the KPSS test is employed, at least at the 1 per cent significance level. Thus, we specify the models considering that all the variables are stationary or trend stationary, and in order to ensure the specification is correct we test whether the residuals of the proposed models are also stationary. The models are specified as follows:
(a) Equilibrium model.
The world demand for Spanish MHP exports is specified in log-linear form as:

Since the equation is specified in logarithms, a1, a2, a3, and a4 are real income, relative prices, transport costs and the tariff elasticities of export demand, respectively.
The supply of exports is specified as a log-linear function of the price of exports relative to domestic prices, of an index of MHP production capacity in Spain, and of the FR and T variables described above.

where β1, β2, β3 and β4 are the relative price of exports, production capacity, transport costs and the tariff elasticities of export supply, respectively.
The equation can be normalized for the price of exports PXt, to yield:

Following Goldstein and Khan (Reference Goldstein and Khan1978), we assume that the adjustment of export quantities and prices to the respective equilibrium values is instantaneous:

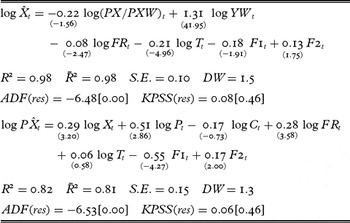
Equations (8) and (10) constitute the equilibrium model, while the estimates of the structural parameters were obtained by estimating the two equations simultaneously. The Full-Information Maximum Likelihood (FIML) estimator was used and the results of the selected model are shown in Table 5, where F1t is a dummy variable with the value of 1 for the First World War and 0 otherwise, and F2t is another dummy that seeks to capture the special economic circumstances of the 1930–35 depression.
FIML estimates of the equilibrium model

t-ratios in brackets and critical values at the 5% significance level in square brackets. ADF(res) is the Augmented Dickey-Fuller test applied to the model's residuals.
KPSS(res) is the Kwiatkowski et al. (Reference Kwiatkowski, Phillips, Schmidt and Shin1992) test for stationarity in the model's residuals.
The model presented was chosen because it had the largest adjusted determination coefficient. In contrast to the model (8)–(10), the abovementioned dummy variables were included and the independent term eliminated, as it was not significant.
Due to concerns about possible autocorrelation, given that the Durbin–Watson (D-W) test scores differed greatly from 2, we estimated the model equation by equation (since these are identified), using the two-stage least squares method (TSLS). The Breusch–Godfrey tests were applied in search of potential autocorrelation problems and the White test for possible heteroskedasticity. As a result, we were able to conclude that the demand equation does not display autocorrelation and is homoskedastic at a significance level of 5 per cent. The same conclusion was obtained for the supply equation, except that we found certain autocorrelation problems at a 5 per cent significance level; however, no autocorrelation problems were apparent at a significance level of 1 per cent. Consequently, the FIML estimation presented may be considered as adequate.
Table 6 presents the FIML estimation of the export elasticities of supply and demand.
Estimated supply and demand export elasticities (FIML). Equilibrium model

aSignificant at the 5% significance level.
t-ratios in brackets.
In the demand function, all of the elasticities display the expected sign, although the price variable is not significant at a level of 5 per cent. In the supply function, the elasticities display the expected sign, but the variables measuring production capacity (C) and tariff protection (T) variables were not significant, even at a level of 10 per cent.
While both seem to be reasonably well specified, judging by the value of the R-squares obtained, the fit of the supply equation is somewhat poorer than that of the demand equation. The estimated models have no spurious relation because the tests to detect the possible non-stationarity of the residuals (ADF(res) and KPSS(res)) confirm the stationarity of the residuals in all the models.
(b) Disequilibrium model
In order to include the possibility of disequilibrium behaviour in the model, exports are assumed to adjust to the difference between demand in period t and the actual flow in the previous period:

where γ is the coefficient of adjustment assumed to be positive, ΔlogXt = logXt − logX t−1.
By substituting equation (8) for (12) we obtain:

Since the quantity of exports is specified as adjusting to excess demand, export prices adjust to conditions of excess supply:

where λ is the adjustment coefficient.
Substituting equation (9) for (14) and solving for log PXt we obtain:

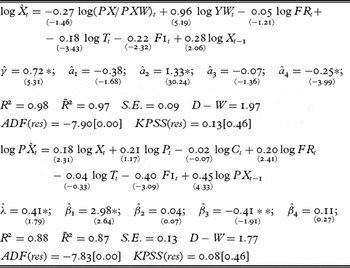
Equations (13) and (15) constitute the disequilibrium model, and the estimates of the structural parameters were obtained by estimating the two simultaneously. The Full-Information Maximum Likelihood (FIML) estimator was used and the results of the selected model are as shown in Table 7.
FIML estimates of the disequilibrium model
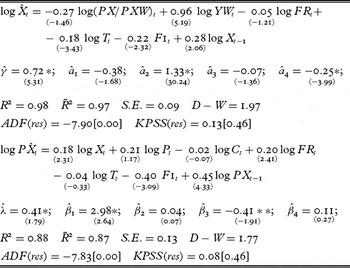
*Significant at the 5% significance level.
**Significant at the 10% significance level.
t-ratios in brackets and critical values at the 5% significance level in square brackets. ADF(res) is the Augmented Dickey–Fuller test applied to the model's residuals. KPSS(res) is the Kwiatkowski et al. (Reference Kwiatkowski, Phillips, Schmidt and Shin1992) test for stationarity in the model's residuals.
The coefficient of lagged exports is significantly different from zero, implying a dynamic adjustment. The mean time lag for the adjustment of exports to changes in the independent variables is estimated at approximately 1.4 years ( ), on average for all products. This result is merely an approximation, since the lag acts as a weighted average of products with long lags (tree crops) and products with no lags (yearly crops). In this model we utilize an adjustment mechanism in which demand imbalances lead exclusively to a change in export volumes; supply imbalances are corrected only by price adjustments (Strauss Reference Strauss2004, p. 39). We may assume that in the case under analysis Spain was capable of satisfying excess demand without raising prices. Adjustment in the case of tree crops was complicated, since the time lags between the decision whether to plant trees and to attempt to increase or decrease production each year via watering, fertilizers or caring for the trees in general are clearly different.
Having identified the equations, we estimated the model equation by equation using the TSLS method, in search of problems of possible autocorrelation and/or heteroscedasticity. The Breusch–Godfrey test detected autocorrelation problems in both equations, even at the 1 per cent significance level, and thus we present the TSLS estimations of the disequilibrium model, corrected for the autocorrelation observed (Table 8). As in the models estimated using FIML, we present the ADF(res) and KPSS(res) tests, concluding that these relations are not spurious.
TSLS estimates of the disequilibrium model

*Significant at the 5% significance level. ** Significant at the 10% significance level; û1t are the residuals of the demand equation, û2t are the residuals of the supply equation. t-ratios in brackets and critical values at the 5% significance level in square brackets. ADF(res) is the Augmented Dickey–Fuller test applied to the model's residuals. KPSS(res) is the Kwiatkowski et al. (Reference Kwiatkowski, Phillips, Schmidt and Shin1992) test for stationarity in the model's residuals.
Table 9 presents the TSLS estimated export elasticities of supply and demand.
Estimated supply and demand export elasticities (TSLS). Disequilibrium model

aSignificant at the 5% significance level. b Significant at the 10% significance level. t-ratios in brackets.
In any event, the results regarding elasticities are similar whichever estimation method is used. In the export demand function all of the coefficients (except relative prices) display the expected sign and are significant.
In the export supply function, the coefficients also take the expected sign, but C and T are not significant. However, if these are eliminated, the results for the remaining coefficients hardly vary and the selection criteria for models, such as the R2, worsened. Consequently, we have opted to present the model with all its variables. As we explain in the section in which the series utilized are discussed, those employed for both C and T are approximations, since in the first case the data are not available and in the second they are general protection levels, as more specific series were not at our disposal.
From an econometric point of view it is not clear which version of the model (equilibrium or disequilibrium) is superior. Based on conventional statistics, such as the adjusted determination coefficient, both models are similar and display similar goodness-of-fit. Nevertheless, in our view the disequilibrium model approximates reality much more closely. Tree crops formed a considerable part of Spanish MHP exports, and short-term response was therefore limited. As a result, we shall restrict our comments to the results of the disequilibrium model.
The results clearly reflect the importance for export growth of rising incomes in the world's most developed countries (Spain's main trading partners), with an income elasticity of 1.33 and significance at 5 per cent. This coefficient, and that of price (although the latter is not significant), are within the habitual range of the results obtained in the abundant empirical literature.Footnote 29
In a previous section we emphasized that the shift in the demand curve is insufficient to explain the rapid response of supply. It must be remembered that quite apart from establishing a new system of specialized agriculture, it was also necessary to overcome the scarcity of water, the main obstacle to this type of agriculture in Spain. This formidable production effort was the cause of the supply-side response, and it was reflected in the increasing share of Mediterranean horticulture in Spanish agricultural production as a whole. In our view, the explanation lies in the high returns earned, compared to traditional products.Footnote 30 The high elasticity of supply with respect to relative profitability (2.57) clearly shows the importance of changes in this variable for the evolution of supply.
The behaviour of MHP export prices shows how they stimulated supply-side growth. Until the First World War, the weighted prices index for Spanish horticultural exports rose 13 per cent faster than the Spanish implicit deflator for agriculture (Table 10). Furthermore, price recovery from the fall caused by the First World War was swift, and their behaviour during the Depression of the 1930s was outstanding.
Real price indices of Spanish exports of Mediterranean horticultural products, 1910 = 100

aThe prices of Mediterranean horticultural products have been deflated by the Spanish implicit deflator for agriculture, taken from Prados de la Escosura (Reference Prados de la Escosura2003).
Finally, the two variables we have used to approximate increasing market integration (transport costs and tariff protection) also clearly stimulated Spanish MHP export growth. The falling cost of transport stimulated both demand (−0.07) and, above all, supply (−0.53), while changes in tariff protection affected only the former (−0.26), which is logical as the tax was transferred directly to the consumer. The values for both coefficients are relatively low in comparison to both foreign countries’ income and the relative profitability of exporting MHPs. This signifies that in the case under analysis they were much more important for the increase of trade by volume (i.e. the rightward shifts of the supply and demand curves) than the impulse provided by globalization in the form of lower transport costs and tariffs.
The lesser impact of reduced transport costs may be due to the fact that Spanish MHP exports went mainly to northern Europe, a comparatively short route in which transport costs represented a relatively small part of the end price.Footnote 31 Our indicator for tariffs, meanwhile, is somewhat approximate, and in fact barriers to MHPs were generally low in northern Europe, and non-existent in the UK.Footnote 32 In other words, the low or non-existent production of the majority of MHPs in the consumer countries may imply that they were not faced with excessively high tariffs, and consequently their reduction was not such a decisive factor in this case. The exception to this general rule is the USA, which since the end of the nineteenth century had strongly protected such products, thereby seriously limiting European exports.Footnote 33
Regarding transport costs and tariffs, it was also decisive that the period under analysis covered not only the years of enormous trade expansion in the first wave of globalization, but also the stagnation of the interwar period. Insofar as this stagnation was produced essentially by rising trade costs, which the increase in output could only compensate for (Jacks, Meissner and Novy Reference Jacks, Meissner and Novy2009), it is reasonable to assume that it affects our result. Thus, the expansion of Spanish MHP exports in the interwar period was very important in a context of trade stagnation, but was no longer able to take advantage of trade cost reductions. On the contrary, this expansion of exports took place between 1914 and 1935, despite sharp rises in transport costs and strong protectionism surrounding commercial exchanges. In this same period, however, the prices of Spanish MHPs displayed notably better behaviour than those of other agricultural products.
7. Concluding remarks: taking advantage of globalization?
From the mid nineteenth century onwards the nascent processes of industrialization and globalization of the world's economies had important consequences; these have come to be regarded as a priority area for research in economic history. In this article, we have focused on their impact upon trade in Mediterranean horticultural products.
Firstly, we have shown how the countries lying on the northern shore of the Mediterranean seized the opportunity (provided by the sharp increase in the industrialized countries’ demand for MHPs) to increase their production and exports; this demand signal was particularly strong in the case of the United Kingdom. By the closing years of the nineteenth century, the producer countries were solidly positioned in the international markets for MHPs. However, they would gradually be threatened by the globalization of production that resulted from rising consumption. It was, above all, Californian agriculture (with its modern technology and innovative marketing) that posed the greatest challenge to the European producers. While the traditional producers lost large swathes of the North American market, partly due to protectionist trade barriers, they nevertheless maintained strong positions in their remaining markets, ensuring that Mediterranean horticulture remained a source of agricultural progress and growth. Despite globalization, however, it was impossible to increase exports to the US market. Spanish MHP exporters’ inability to gain more than a limited presence in the world's most dynamic market was undoubtedly a significant cost, as we have argued, in terms of both lost opportunities and the impact of increasing US production on prices (Morilla, Olmstead and Rhode Reference Morilla, Olmstead and Rhode1999).
Spain took advantage of rising demand in the industrialized countries to expand its Mediterranean horticultural production, which was by far the most dynamic sector of its agriculture until the outbreak of the Second World War. MHP exports also increased very significantly, to the extent that they became one of the pillars of Spanish foreign trade. Thus, we have seen how in the second half of the nineteenth century a new and dynamic agriculture developed, specializing in MHPs. Competition from California did not halt this expansion, which continued throughout the first third of the twentieth century, and Spanish MHP exports enjoyed truly spectacular growth between 1850 and 1936.
The primary objective of the present study is to contribute to the empirical literature on the factors determining the expansion of trade in agricultural products and food in the first wave of globalization. We have used Spain as a case study to shed light on this question.
In order to achieve our objective, we have estimated simultaneously a bi-equational supply–demand model, using data for Spanish MHP exports in the period 1870–1935. The results clearly reflect the primacy of rightward shifts in the supply and demand curves in explaining the growth of MHP trade by volume. Thus, both rising incomes in the more developed countries and technological change in agriculture specializing in these products were key to the growth of this trade. Meanwhile, Spanish exporters also benefited from the increasing integration of international markets, especially through declining transport costs and, to a lesser extent, trade liberalization.
Acknowledgments
We are particularly indebted to Peter H. Lindert, Alan L. Olmstead, the Agricultural History Centre, the Department of Economics and the Institute of Governmental Affairs of the University of California, Davis. Jeffrey G. Williamson generously shared with us his data on transport costs and tariff protection. We are also indebted to Antonio Aznar, Gema Aparicio, Fernando Collantes, Riitta Hjerppe, Hakon Lobell, Pilar Nogués, Matti Peltonen, Paul Rhode and Marcela Sabaté. Previous versions have been read and commented on by the editors, two anonymous referees, Salvador Calatayud, Domingo Gallego, Michael Kopsidis, Jacob Metzer, Alan L. Olmstead, Dulce Saura, the participants in the Economic History Seminars at the Universities of Barcelona, Valencia and Zaragoza, the 5th European Historical Economics Society Conference, the All-University of California Group in Economic History Conference ‘Agricultural Development in Economic History’ and the European Cost A-35 Project ‘Progressore’ Conference on ‘The impact of markets on the management of rural land’. We are grateful for finance from the Spanish Department of Education and Science, Project SEJ 2005-077556, the Spanish Department of Science and Innovation, Projects ECO2009-07796 and ECO2009-07936, and the Department of Science, Technology and Universities of the Government of Aragon, excellence research group for ‘Agri-food Economic History’ and research group ‘Econometric Model Selection’.
Appendix
In order to construct the globalization index (Figure 3), we used the GDP and export data given in Maddison (Reference Maddison2001) for a series of benchmark years. For the intermediate years, however, we employed Maddison's index figures (Reference Maddison1991) to extend the series in absolute terms. Maddison did not publish index data for the years prior to 1870, and we have therefore used the figures given by Mitchell, which consist of current exports in national currency. The series was harmonized by converting US dollar values, using the nominal exchange rate for each national currency after deflating each national series on the basis of a local currency wholesale price index. These exchange rates were drawn mainly from Schneider, Schwarzer and Zellfelder (Reference Schneider, Schwarzer and Zellfelder1991).
We were finally able to construct a globalization index including Belgium, France, the United Kingdom, Spain and the USA for the period 1850–61. From 1861 to 1870 the index also includes Italy and Sweden. Finally, the period 1871–1935 also includes Japan, Denmark, Germany, the Netherlands, Norway, Australia and Canada (except Belgium between 1914 and 1928). The sub-series obtained were linked together using index figures, resulting in a single final series.
Spanish exports of Mediterranean horticultural products. Volume index (1910 prices in pesetas), 1850–1935

Source: Spanish Foreign Trade Statistics (Estadística del Comercio Exterior de España).
Spanish exports of Mediterranean horticultural products (current prices in pesetas), 1850–1935

Source: Estadística del Comercio Exterior de España.