1. Introduction
The relationship between language and cognition has become the subject of extensive research in recent years. The notion of linguistic relativity, which posits that language may influence the way we think, has undergone considerable re-theorizing in contemporary terms (Lucy, Reference Lucy2016) and now comprises a range of different proposals (Wolff & Holmes, Reference Wolff and Holmes2011). While linguistic relativity, as originally proposed by Whorf (Reference Whorf and Carroll1956), assumes that language may influence non-linguistic representations, Slobin's (Reference Slobin, Gumperz and Levinson1996a) thinking for speaking postulates that language may affect language only when we are thinking with the intent to use language. Previous studies have presented mixed evidence so far, suggesting that the extent to which language affects thought depends on various factors, including the type of domain involved, the nature of the linguistic feature under investigation, and the involvement of language in an experimental task (e.g., Gennari, Sloman, Malt & Fitch, Reference Gennari, Sloman, Malt and Fitch2002; Papafragou & Selimis, Reference Papafragou and Selimis2010; Trueswell & Papafragou, Reference Trueswell and Papafragou2010).
If speakers of different languages think differently in certain contexts, what would the thought patterns look like for those who know more than one language? This has been a topic of interest for bilingualism researchers who are interested in probing how learning a new language reshapes our thinking. The emerging findings suggest that bilingual cognition is dynamic and flexible and that the degree to which it is influenced by either language is likely tied to various language-related factors including age of L2 acquisition (e.g., Boroditsky, Reference Boroditsky2001), length of stay in an L2-speaking country (e.g., Athanasopoulos, Reference Athanasopoulos2007), L2 proficiency (e.g., Park & Ziegler, Reference Park and Ziegler2014), and the language of operation (e.g., Athanasopoulos, Bylund, Montero-Melis, Damjanovic, Schartner, Kibbe, Riches & Thierry, Reference Athanasopoulos, Bylund, Montero-Melis, Damjanovic, Schartner, Kibbe, Riches and Thierry2015).
Another area of study that is associated with language and thought research and has received increased interest in recent years is cross-linguistic influence (CLI) research involving conceptual meaning (e.g., Jarvis & Pavlenko, Reference Jarvis and Pavlenko2008). While linguistic relativity focuses on the effects of language on thought, this line of research primarily deals with the effects of thought on language. More specifically, it aims to explore the CLI phenomenon commonly known as conceptual transfer, which refers to the process whereby patterns of conceptualization acquired through one language affect the use of another language (see Jarvis, Reference Jarvis2016 for a review of the full scope of conceptual transfer research). Whereas linguistic relativity research examines non-verbal behavior, CLI research investigates the language use of language learners or bilinguals to find evidence for CLI involving conceptual meaning. The existing findings suggest that patterns of conceptualization are indeed subject to transfer from first language (L1) to second language (L2) and to transfer in the reverse direction as well (e.g., Brown & Gullberg, Reference Brown and Gullberg2008, Reference Brown and Gullberg2013; Cadierno & Ruiz, Reference Cadierno and Ruiz2006; Daller, Treffers-Daller & Furman, Reference Daller, Treffers-Daller and Furman2011).
So far, studies in these two lines of research have rigorously explored their questions of interest, but mostly in separate studies. With the exception of few studies (e.g., Aveledo & Athanasopoulos, Reference Aveledo and Athanasopoulos2016; Filipović, Reference Filipović2011), there has been very little attempt to address linguistic relativity and conceptual transfer together in a single study to garner a holistic understanding of how L2 users speak and think about a certain concept. To obtain a fuller picture of how language and thought interact within bilingual adults, the present study examined verbal and non-verbal behaviors of Korean–English sequential bilinguals in the domain of motion events. The study targeted Korean–English speakers as the population of interest because (a) these languages have been found to exhibit typological contrast in their encoding of motion events (Bowerman & Choi, Reference Bowerman, Choi, Bowerman and Levinson2001; Choi, Reference Choi and Gathercole2009; Choi & Bowerman, Reference Choi and Bowerman1991); and (b) no study has yet investigated cross-linguistic encoding of motion events and motion cognition with Korean–English speakers as the targeted population.
2. Verbal encoding of motion events
2.1. Motion events in Korean and English
Motion is pervasive in human experience, and languages vary in how they map semantic elements onto lexical items when expressing motion events (Talmy, Reference Talmy2000). For this reason, the domain of motion events has been a popular testbed for exploring how speakers of different languages encode various components of motion events (e.g., path, manner, cause, ground). When describing voluntary motion where an entity moves without any external cause, such as “the woman walked into the room,” speakers of different languages differ in how they encode path (i.e., the trajectory a figure takes) and manner (i.e., the way a figure moves) of motion (Choi, Reference Choi and Gathercole2009). According to Talmy (Reference Talmy2000), speakers of satellite-framed languages (S-languages) like English typically encode manner in the main verb (e.g., walk) and path in a satellite, that is, outside of the main verb (e.g., through prepositions such as into). In contrast, speakers of verb-framed languages (V-languages) like KoreanFootnote 1 prefer to encode path in the main verb (e.g., tul-, ‘enter’) and manner in foregrounding constituents such as subordinate clauses or adverbial adjuncts. In Slobin's (Reference Slobin, Strömqvist and Verhoeven2004) cline of manner salience, V-languages are typically considered low-manner salient compared to S-languages, as manner information is less codable, and as a result, it often gets omitted in verbal production.
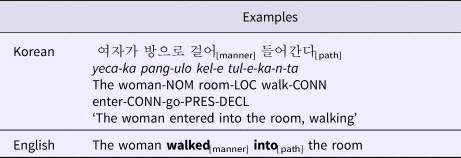
Previous studies (Choi, Reference Choi and Gathercole2009, Reference Choi2011; Choi & Bowerman, Reference Choi and Bowerman1991) have established that Korean and English are a typical V-language and S-language, respectively, conflating path and manner in differential ways. As Korean is a head-final language, the main verb is the rightmost constituent, which carries all the inflectional suffixes. Path or manner is frequently accompanied by a deictic verb like kata ‘go’ or ota ‘come,’ as in tul-e-kata (enter-CONN-go) and ttwi-e-ota (run-CONN-come), when expressed through the final verb. These compound verbs are generally regarded as path and manner verbs, respectively, for the reason that they get a separate entry in a dictionary (Lee, Reference Lee1999; Oh, Reference Oh2003). Choi (Reference Choi and Gathercole2009, Reference Choi2011) demonstrated that Korean children and adults preferred to express path information in the final verb, while manner was typically encoded elsewhere in the clause (e.g., in the pre-final verb position in a serial verb construction or in an adverbial clause). In contrast, English speakers showed salient characteristics of S-languages by encoding manner in the main verb and path in a satellite. This typological contrast is illustrated in Table 1.
Motion encoding patterns in Korean and English.

Note. NOM: nominative marker; LOC: locative maker; CONN: connecting suffix; PRES: present tense marker; DECL: declarative marker.
2.2. Motion event encoding in bilinguals
Studies of motion events from a cross-linguistic perspective have continuously shown that L2 speakers or bilinguals who speak languages that belong to different typological categories tend to transfer certain L1 patterns into the L2 or vice versa. For instance, L1 speakers of V-languages (Japanese, Spanish) learning L2 S-languages (Danish, English) were found to omit manner information more frequently in their L2 motion event descriptions than L1 S-language speakers (Brown & Gullberg, Reference Brown and Gullberg2008; Cadierno, Reference Cadierno, Han and Cadierno2010; Filipović, Reference Filipović2011; Hohenstein, Eisenberg & Naigles, Reference Hohenstein, Eisenberg and Naigles2006), whereas L1 speakers of S-languages (Danish, English) learning an L2 V-language (Spanish) were shown to struggle with the mastery of target-like expressions of manner in the L2 (Cadierno & Ruiz, Reference Cadierno and Ruiz2006; Larrañaga, Treffers-Daller, Tidball & Ortega, Reference Larrañaga, Treffers-Daller, Tidball and Ortega2011). There are also several studies that have documented bidirectional influence in motion event descriptions of bilinguals (Daller et al., Reference Daller, Treffers-Daller and Furman2011; Hohenstein et al., Reference Hohenstein, Eisenberg and Naigles2006), demonstrating that bilinguals' encoding patterns were different from those of the two monolingual groups. For instance, Spanish–English bilinguals in Hohenstein et al. (Reference Hohenstein, Eisenberg and Naigles2006) used more manner verbs in L1 Spanish than Spanish monolinguals and more path verbs in L2 English than English monolinguals. Similarly, Daller et al. (Reference Daller, Treffers-Daller and Furman2011) showed that Turkish–German bilinguals' frequency of the use of path satellites fell in between monolingual baselines.
Previous studies have also shown that motion encoding patterns are not fixed but rather susceptible to individual difference factors such as L2 proficiency, language dominance, and context of language. For instance, Cadierno and Ruiz (Reference Cadierno and Ruiz2006) and Treffers-Daller and Calude (Reference Treffers-Daller and Calude2015) suggested that L2 encoding patterns are likely to become more target-like with increasing L2 proficiency. In Daller et al. (Reference Daller, Treffers-Daller and Furman2011), Turkish–German bilinguals' conceptualization of motion events was influenced by the dominant linguistic environment: bilinguals living in Turkey followed encoding patterns of Turkish monolinguals, while those residing in Germany patterned with German monolinguals.
While the issue of transfer in the acquisition of L2 motion encoding patterns has been actively studied with diverse bilingual populations in the past, relatively little is known about how Korean–English bilingual speakers describe motion events in their L2. To date, Choi and Lantolf (Reference Choi and Lantolf2008) is the only study to the author's knowledge that has examined motion encoding patterns of Korean–English speakers. The findings of this small-scale study reported that two Korean–English bilinguals shifted towards L2-based patterns when describing three motion scenes that included concurrent path and manner movement, whereas their gestures still exhibited some L1-based patterns. Since this early work by Choi and Lantolf (Reference Choi and Lantolf2008), there has not been a follow-up study that carried on the investigation of how Korean–English bilinguals talk about motion events.
3. Motion event construal in bilinguals
The domain of motion events has been a popular testing ground for language effects on cognition. Much of this work has been done within the thinking for speaking paradigm (Slobin, Reference Slobin, Gumperz and Levinson1996a), which assumes that the effects of language on thinking emerge only when speakers have an intention to use language. There is converging evidence that thinking prior to or during verbal encoding is indeed susceptible to language effects (Brown, Reference Brown2015; Papafragou, Hulbert & Trueswell, Reference Papafragou, Hulbert and Trueswell2008). However, there is less agreement about whether language affects motion cognition beyond speech planning. This question has engaged researchers interested in testing the limits of language effects on cognition – that is, the extent to which the language one speaks can shape how one thinks (Casasanto, Reference Casasanto2008). Empirical investigations of this type typically utilize a cognitive task that examines different aspects of cognition such as perception, attention, memory, and categorization. Some studies have shown no language effects on speakers' memory and categorization preferences (Papafragou, Massey & Gleitman, Reference Papafragou, Massey and Gleitman2002), and others have provided support for language effects on motion representation mostly under conditions in which linguistic encoding was permitted. For instance, Gennari et al. (Reference Gennari, Sloman, Malt and Fitch2002) demonstrated that language-specific categorization patterns emerged only when participants performed a verbal task immediately prior to a non-verbal task, highlighting the effects of task presentation order on participants' non-verbal performance. Similarly, Papafragou and Selimis (Reference Papafragou and Selimis2010) revealed that a verbal prompt accompanied by the sample stimuli events encouraged participants to recruit linguistic labelling during categorization. In Kersten, Meissner, Lechuga, Schwartz, Albrechtsen, and Iglesias (Reference Kersten, Meissner, Lechuga, Schwartz, Albrechtsen and Iglesias2010), English speakers attended more strongly to manner of motion than did Spanish speakers in a supervised classification task, in which participants' ability to use language was not blocked. These findings suggest that language effects on categorization are likely to appear when it is possible to use language as a means to solve a non-verbal task. When language mediation is completely blocked via verbal shadowing, cross-linguistic differences in the conceptualization of motion seem to disappear (Gennari et al., Reference Gennari, Sloman, Malt and Fitch2002; Papafragou & Selimis, Reference Papafragou and Selimis2010). Therefore, there is now increasing agreement that different experimental set-ups (e.g., task presentation order, stimuli type, task type, etc) regarding the involvement of verbalization (explicit, implicit, blocked) are of key importance when it comes to obtaining language effects on motion event cognition.
Moving beyond the study of monolingual speakers, there are only a handful of studies that have probed the effects of language on motion event cognition beyond language planning with bilingual speakers. Consistent with studies of monolingual speakers, bilingual cognition research also presents mixed and inconsistent results. In one such study, Aveledo and Athanasopoulos (Reference Aveledo and Athanasopoulos2016) examined both motion encoding patterns and categorization patterns of Spanish–English bilingual children. They demonstrated that no significant differences were found between monolingual and bilingual children in their categorization, suggesting that language did not mediate their non-verbal performance. However, other studies have shown that bilingual speakers' conceptualizations of motion events were affected by language mostly when it was possible to use language during a non-verbal task. For instance, Kersten et al. (Reference Kersten, Meissner, Lechuga, Schwartz, Albrechtsen and Iglesias2010) demonstrated that late Spanish–English bilinguals (but not early bilinguals) tested in an English-speaking context was better than those in a Spanish-speaking context at sorting objects and events on the basis of manner of motion. Results showed that late bilinguals' tendency to follow English categorization patterns were boosted in an English context, indicating that language effects on bilingual motion event cognition were context-bound. A similar pattern was observed in Athanasopoulos et al. (Reference Athanasopoulos, Bylund, Montero-Melis, Damjanovic, Schartner, Kibbe, Riches and Thierry2015) in that German–English bilinguals switched their preference regarding goal orientation of motion events as a function of language of operation, performing more like German monolinguals in a German context and more like English monolinguals in an English context. The study further revealed that bilingual speakers' categorization preference was modulated by language of verbal interference: those who experienced verbal interference in English displayed categorization patterns of German, while those engaged in German verbal interference resembled English categorization behavior. Lastly, Filipović's (Reference Filipović2011) study of recognition memory of motion events reported that Spanish–English bilinguals' memory performance resembled that of Spanish monolinguals, independent of language context and prior verbalization. The null effect of language context in this study, however, may be due to the fact that language of instruction was not strictly controlled in each context and, as a result, both languages were used by bilinguals in both language contexts.
In sum, motion cognition research suggests that evidence for language effects on non-verbal behavior remains mixed, and that they seem to vary depending on the degree of verbal mediation in a non-verbal task. That is, unless language involvement is artificially suppressed, speakers are prone to think with language even in a non-verbal task that does not call for overt language intrusion. As a result, monolingual speakers align their conceptual categories with their linguistics categories, and bilingual speakers resemble either monolingual pattern or fall in between monolingual baselines. Within the domain of motion events, non-verbal behavior was shown to be modulated by factors including language context (Athanasopoulos et al., Reference Athanasopoulos, Bylund, Montero-Melis, Damjanovic, Schartner, Kibbe, Riches and Thierry2015; Kersten et al., Reference Kersten, Meissner, Lechuga, Schwartz, Albrechtsen and Iglesias2010; Lai, Rodriguez & Narasimhan, Reference Lai, Rodriguez and Narasimhan2014, but see Filipović, Reference Filipović2011), age of acquisition (Kersten et al., Reference Kersten, Meissner, Lechuga, Schwartz, Albrechtsen and Iglesias2010), and language of verbal interference (Athanasopoulos et al., Reference Athanasopoulos, Bylund, Montero-Melis, Damjanovic, Schartner, Kibbe, Riches and Thierry2015). Beyond the domain of motion events, other factors such as L2 proficiency and length of immersion in the target-language environment have been examined as potential predictors of cognitive restructuring. So far, there are mixed findings regarding the role of L2 proficiency: while some reported that bilinguals shift towards L2 conceptualization patterns as a function of L2 proficiency (Athanasopoulos, Reference Athanasopoulos2007; Athanasopoulos & Kasai, Reference Athanasopoulos and Kasai2008; Park & Ziegler, Reference Park and Ziegler2014), others documented no clear relationship between proficiency and cognitive shift (Bylund & Athanasopoulos, Reference Bylund and Athanasopoulos2014a; Bylund, Athanasopoulos & Oostendorp, Reference Bylund, Athanasopoulos and Oostendorp2013; Cook, Bassetti, Kasai, Sasaki & Takahashi, Reference Cook, Bassetti, Kasai, Sasaki and Takahashi2006).
On the other hand, length of immersion has emerged rather consistently as an important predictor of cognitive restructuring in previous studies. The beginning of restructuring, however, seems to vary according to conceptual domain, task, or languages involved: Greek–English bilinguals in Athanasopoulos, Dering, Wiggett, Kuipers, and Thierry (Reference Athanasopoulos, Dering, Wiggett, Kuipers and Thierry2010) experienced neurophysiological changes in preattentive color processing after 1.5 years of L2 immersion, and Greek–English bilinguals in Athanasopoulos (Reference Athanasopoulos2009) showed a cognitive shift towards L2 color categorization after two years. In Cook et al. (Reference Cook, Bassetti, Kasai, Sasaki and Takahashi2006), Japanese–English bilinguals with longer stays (between 3–8 years) in an L2-speaking country demonstrated a significant shift towards the L2 categorization pattern, while those with shorter stays (between 0.5–3 years) did not. These studies suggest that length of immersion is a reliable predictor of cognitive shift and that the shortest period of time that shows an effect for length of immersion is 1.5 years.
4. Research Questions
With the dual goal of investigating linguistic relativity and conceptual transfer, the present study examined both verbal and non-verbal behaviors of Korean–English bilinguals in comparison to the baseline behaviors from two monolingual groups. Three research questions were formulated:
RQ1. How do Korean–English bilinguals express motion events in their L2, in comparison to Korean and English monolinguals?
RQ2. How do Korean–English bilinguals non-verbally categorize motion events in comparison to Korean and English monolinguals?
RQ3. What are some learner background factors that may influence the verbal patterns and non-verbal categorization preferences observed for the Korean–English bilinguals?
5. Method
5.1. Participants
A total of 110 participants (70 females) were recruited, sampled into three language groups: Korean monolingual (KM) (N = 15), English monolingual (EM) (N = 15), and Korean–English bilingual (KEB) (N = 80). The KEB participants were purposefully sampled to represent a broad range of L2 proficiencies. KM and KEB speakers were recruited from universities in Korea, and EM speakers were recruited from universities in the United States.
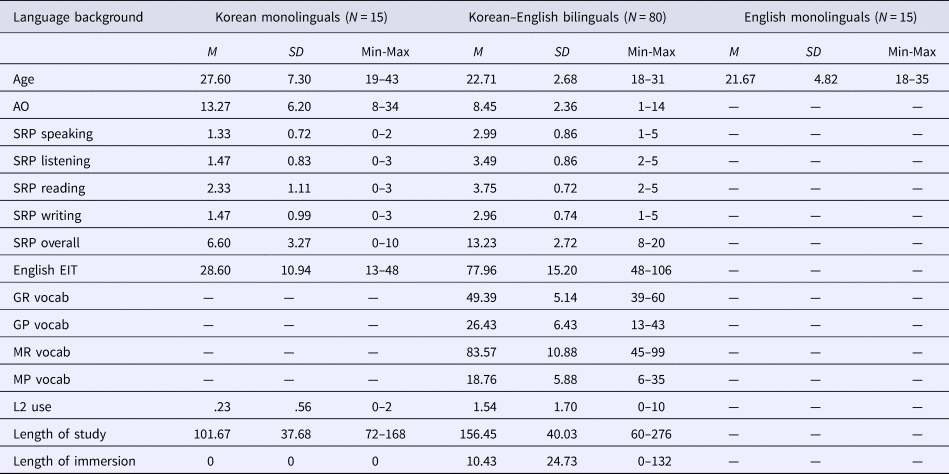
Table 2 summarizes the language backgrounds of the three groups. Following common practice in SLA research (e.g., Cook et al., Reference Cook, Bassetti, Kasai, Sasaki and Takahashi2006), the current study recruited functional monolinguals, defined as speakers who a) primarily used their mother tongue on a day-to-day basis; b) reported no active use of foreign languages that they once learned; and c) strongly identified themselves as a monolingual speaker. The Korean monolinguals were expected to have some remnant knowledge of English, given that study of this language is compulsory in the Korean education system. Therefore, care was taken during recruitment that this knowledge was minimal. This was confirmed when they were found to be statistically significantly different from the Korean–English bilinguals in terms of six language background factors (see Table 2): scores on an English Elicited Imitation Test (EIT), self-rated proficiency in English, average daily English use in hours, age of onset, length of immersion in an L2-speaking country, and length of English study. While the English monolinguals also reported having some knowledge of foreign languages, care was taken to screen out those with advanced knowledge of V-languages, as it could potentially influence their linguistic and categorization patterns shaped by their S-language.
Summary of language usage/proficiency data for three language groups.
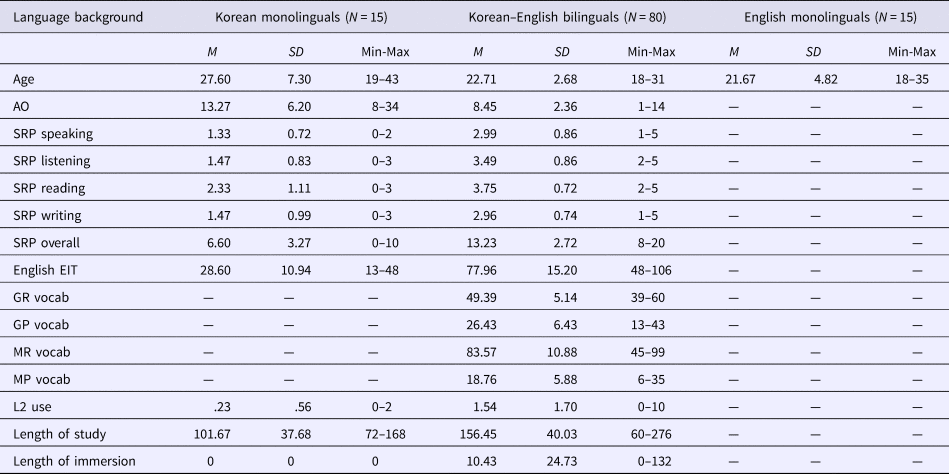
Note. M = mean; SD = standard deviation; Age = age at the time of testing; AO = age of onset for English; SRP = self-rated English proficiency; EIT = Elicited Imitation Test; GR vocab = general receptive vocabulary test; GP vocab = general productive vocabulary test; MR vocab = motion-specific receptive vocabulary test; MP vocab = motion-specific productive vocabulary test; L2 use = hours of current usage of L2 per day; length of study = the number of months spent to study English; length of immersion = the number of months spent in an L2-speaking country;— = not applicable.
Following the operationalization of monolingualism, bilingualism was also operationalized as relatively active use of two languages and/or a high command of both languages. Therefore, participants who reported either relatively active use of an L2 or a high command of the two languages, or both, were considered functional bilinguals, and their L2 proficiency was empirically assessed via a number of direct and self-reported measures. All Korean–English bilinguals considered Korean as their L1 and used Korean much more frequently in their daily lives as evidenced by their average daily English, which ranged between zero and ten hours (cf. 0–2 hours for the KM group). While eight bilinguals reported a very early age of onset, before the age of five, most of them were Korean-dominant sequential bilinguals who started learning English in an instructional setting at the mean age of 8.45. None reported any advanced competence in other foreign languages besides English.
5.2 Verbal task
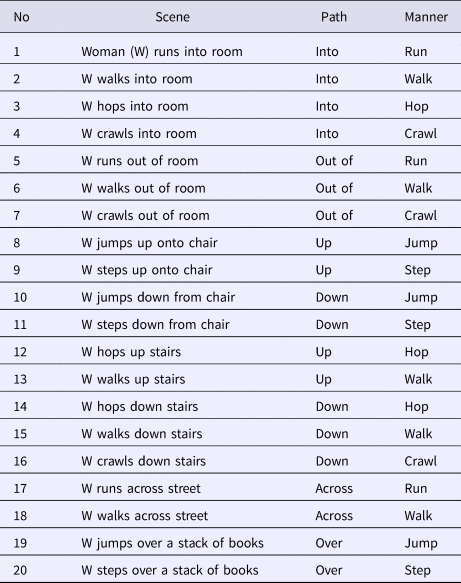
A video description task (k = 20) was developed to elicit participants' verbal descriptions of motion events. Stimuli sentences were adapted from Choi (Reference Choi and Gathercole2009) with more new sentences added for the purpose of increasing the number of tokens. Each video clip lasted about 7 seconds and contained a scene showing a person spontaneously moving along an explicit trajectory in a certain manner. Table 3 lists the 20 scenes along with the information about the manner and path involved in each scene.
Motion event scenes used in the video description task.

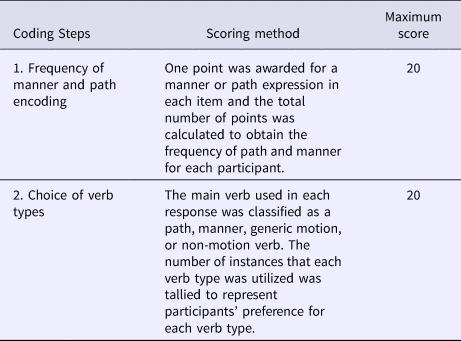
After watching each video clip, participants described what was happening in each scene in their L1 (for monolingual speakers) or L2 (for bilingual speakers). The instruction was provided in Korean (i.e., “비디오 속에서 일어나는 일을 설명하시오”) for the two Korean groups, and in English (i.e., “Describe what is happening in the video”) for the English monolinguals. All responses were audio-recorded, transcribed by a native speaker of the respective language, and coded and scored in two steps following the coding guidelines in Table 4.
Coding guidelines for the video description task.

5.3 Non-verbal task
Following prior studies of motion categorization (e.g., Athanasopoulos & Bylund, Reference Athanasopoulos and Bylund2013; Gennari et al., Reference Gennari, Sloman, Malt and Fitch2002), the current study employed a triads-matching task with verbal interference to examine participants' similarity judgement of motion events. Participants saw video clips in triads, where the target clip appeared first on the top center of the screen, followed by the two variants in the left- and right-middle of the screen. The target depicted a motion event in which both path and manner were included. While the variant A depicted the same path of motion as in the target, the variant B shared the same manner of motion with the target. Accordingly, it was hypothesized that English and Korean speakers would be biased to choose the manner-alternate and the path-alternate, respectively. These triads were created using five different types of path (i.e., across, down, into, out of, up) and four different types of manner (i.e., walk, run, hop, crawl), all of which had also been used to create the stimuli for the verbal task. The instruction was given in Korean for the two Korean groups, and in English for the English monolinguals. Twenty triads were sequenced into a randomized fixed order, and the three clips in each triad were played to participants, one after another without any pause in-between. After watching all three clips, participants indicated which variant was more similar to the target.
Concurrent with the video onset of each triad, participants were instructed to repeat a string of three two-digit numbers out loud in their L1 and to continue repeating it until they had completed their similarity judgment on the answer sheet. Verbal interference was employed to disrupt participants' verbally mediated categorization, which tends to emerge when the automatic use of language is not intentionally blocked by a verbal manipulation (Athanasopoulos & Bylund, Reference Athanasopoulos and Bylund2013; Papafragou & Selimis, Reference Papafragou and Selimis2010). While previous studies typically required participants to repeat a new string of numbers after every triad (Athanasopoulos & Bylund, Reference Athanasopoulos and Bylund2013; Trueswell & Papafragou, Reference Trueswell and Papafragou2010), the present study employed a more relaxed version of verbal shadowing to make the task less taxing and less time-consuming for participants. This decision resulted from strong feedback from pilot testing, in which ten participants expressed that memorizing a new string of digits after each triad was exhausting and monotonousFootnote 2. Therefore, to minimize task fatigue and avoid approaching the limits of attention span, the standard verbal interference paradigm was modified, and participants in the actual experiment were given a new string of numbers after every ten triads. While the task still required participants to engage in verbal rehearsal, which in turn was expected to reduce language mediation, this modification was intended to reduce participant fatigue and their time-on-task.
For task scoring, one point was awarded if participants chose a manner variant over a path variant. The maximum score was 20, and the higher score indicated participants' higher reliance on manner when making similarity judgments.
5.4 Background information questionnaire
An online background information questionnaire was developed and administered to all participants to obtain information regarding the following background factors: age of onset, length of English study, L2 use, length of immersion in an L2-speaking country, and knowledge of other foreign languages. Self-reported estimations of proficiency were also elicited in the questionnaire via Likert scale items that probed into self-perceptions of their English language competence. The background information is summarized in Table 2.
5.5 Direct measurement of L2 proficiency: elicited imitation test and vocabulary tests
English Proficiency was measured directly via tests that estimated participants' ability to repeat oral sentences. An English EIT developed by Ortega, Iwashita, Norris, and Rabie (Reference Ortega, Iwashita, Norris and Rabie2002) was administered to all Korean speakers. The EIT consisted of 30 English sentences, and participants were asked to listen to one sentence at a time and then to repeat the sentence as accurately as possible. The participants' recorded responses were coded using a five-point scoring rubric (Ortega et al., Reference Ortega, Iwashita, Norris and Rabie2002), and the maximum score was 120.
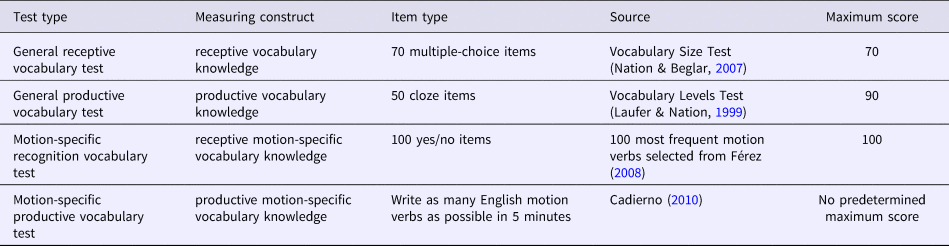
In addition to the EIT, proficiency was also measured via four tests of receptive and productive vocabulary size, two tapping into general English vocabulary, and two tapping into specific knowledge of motion verbs. The test sources and design information are shown in Table 5.
Vocabulary test type.

5.6 Procedure
The study took place in a single session after the participants had completed the online background information questionnaire at home. All participants met with the researcher individually and performed tasks in the following order: the EIT, the video description task, the triads-matching task, and the vocabulary tests. The EIT was administered to both Korean groups, and the vocabulary tests were administered only to the bilingual group. As this study was part of a larger project, participants performed two additional tasks, a narrative task and a non-verbal memory task, each of which sequentially took place after the video description task. While the two verbal tasks (video description and narrative tasks) preceded the non-verbal triads-matching task, potentially creating a condition in which spill-over effects from the verbal to non-verbal tasks may emerge (Gennari et al., Reference Gennari, Sloman, Malt and Fitch2002), it was predicted that language use would not be fostered in the triads-matching task for two reasons: first, verbal interference during the triads-matching task was presumed to minimize the effects of language on cognition (due to interference with vocal or subvocal speech); and second, a 5-minute break and the non-verbal memory task took place immediately after the two verbal tasks, allowing the opportunity for any lingering language effects from the previous verbal tasks could fade.
6. Results
6.1 Linguistic encoding: expression of motion events
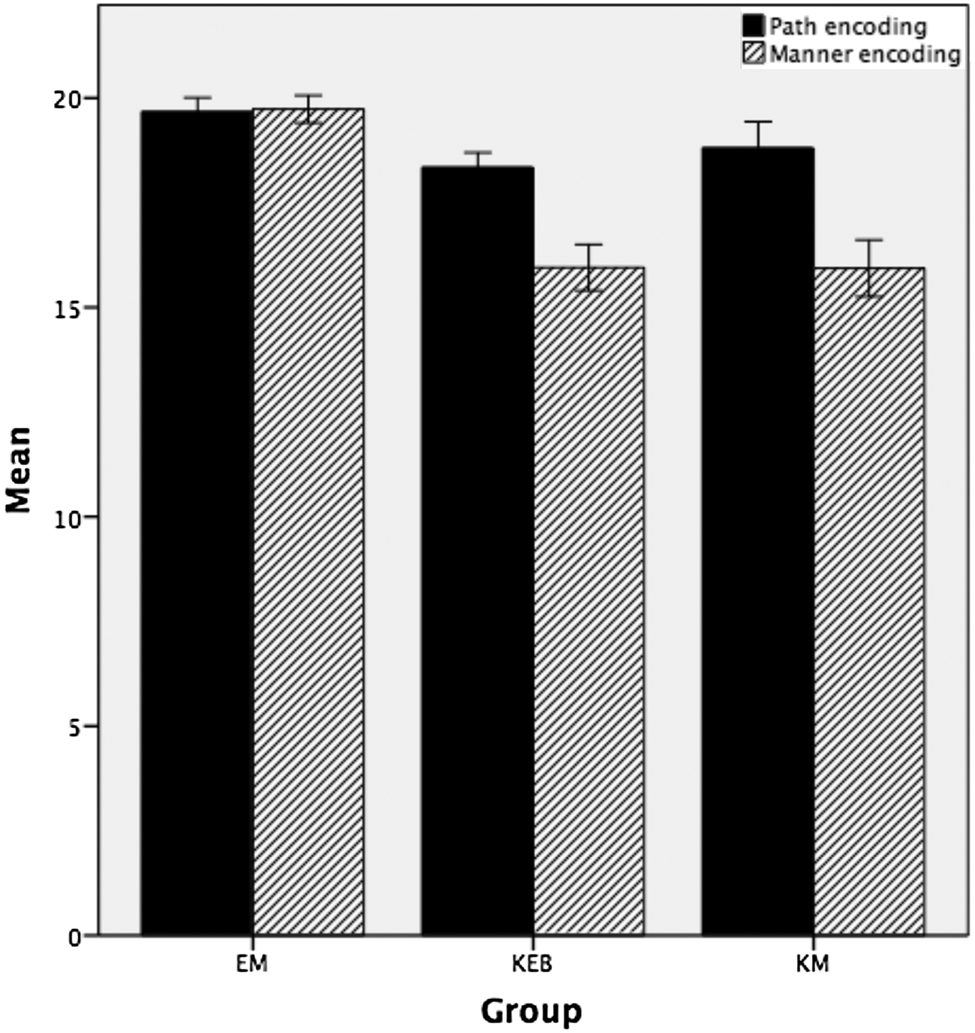
To investigate how frequently the three language groups expressed path and manner in their descriptions of motion events, the number of any lexical items referring to path or manner was tallied (see coding Step 1 in Table 4). Table 6 summarizes these frequency results, and the same information is graphically represented in Figure 1. It should be noted that for the KEB group, non-target-like use of path particles was observed, for example, using the preposition ‘above’ to refer to the motion of a woman walking over books. This affected a total of 6.56% of relevant cases. Full credit was awarded in these cases, because even a non-target-like attempt to express path reflected a preference to encode path in their description of motion events. Accordingly, all the statistical analyses reported here were conducted with the frequency value of the KEB group that included non-target-like prepositions in the countFootnote 3.
Descriptive statistics for the frequency of path and manner encoding.

Note. N for KM and EM = 15; N for KEB = 80; maximum score = 20.
Frequency of path and manner encoding by language group

A one-way between-groups multivariate analysis of variance (MANOVA) was performed, with two dependent variables (frequency of path encoding and frequency of manner encoding) and one independent variable (language group). Using Pillai's Trace, the results showed a statistically significant difference across the groups on the combined dependent variables, V = .29, F(4, 214) = 9.12, p < .001, partial η 2 = .15. Separate univariate analyses of variance (ANOVAs) revealed that both the frequency of path encoding, F(2, 107) = 5.39, p = .006, partial η 2 = .09, and the frequency of manner encoding, F(2, 107) = 19.42, p < .001, partial η 2 = .27, were statistically significant. Therefore, post-hoc analyses were conducted using a Bonferroni adjusted alpha level of .017. For the frequency of path encoding, only the KEB group was significantly lower than that of the EM group (91.69% vs. 98.33%, p = .005, d = −1.09), with no reliable differences found between the other two comparisons. For the frequency of manner encoding, the EM group was statistically significantly different from both the KM and KEB groups (p < .001 for both comparisons), yielding large effect sizes: EM–KM, d = 3.95; EM–KEB, d = 2.10. On the other hand, no statistically significant differences were found between the KM and KEB groups. In sum, the Korean bilinguals encoded path in their L2 English less frequently than the English monolinguals (who were practically at ceiling), and the English monolinguals expressed manner significantly more frequently than both the Korean monolinguals and the Korean–English bilinguals.
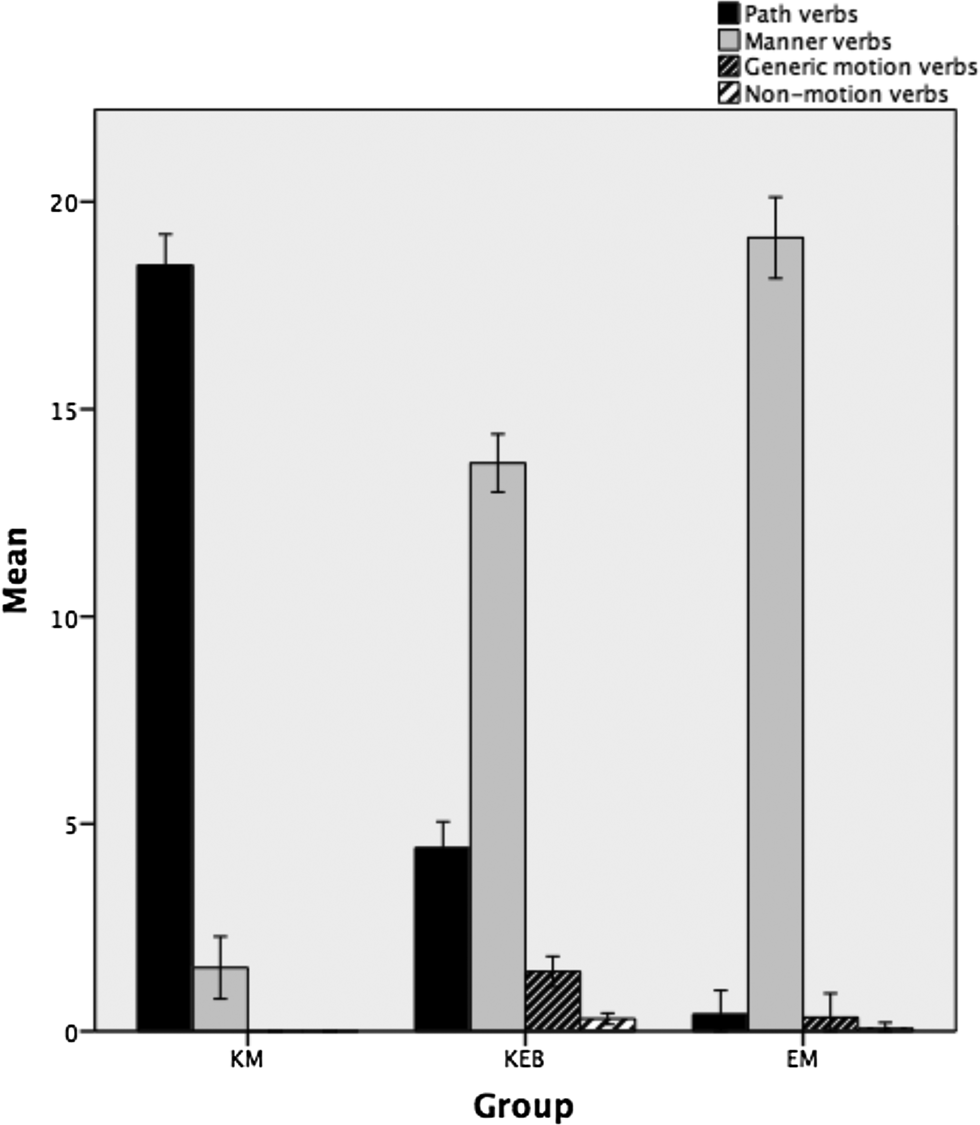
In order to identify which motion element gets expressed through the main verb in a clause, the choice of verb types by the three language groups was also compared across four categories: path verbs (e.g., ‘cross'), manner verbs (e.g., ‘walk’), generic motion verbs (e.g., ‘get’), and non-motion verbs (e.g., copula be) (see coding Step 2 in Table 4). Table 7 summarizes the results, and the same information is graphically represented in Figure 2.
Descriptive statistics for the choice of verb types.

Note. N for KM and EM = 15; N for KEB = 80; maximum score = 20.
The choice of verb types by group

Generic motion verbs and non-motion verbs were not employed by the KM group in Korean, but they were used in English by both the KEB and EM groups. Therefore, separate MANOVAs were performed, one to compare the frequency of path verbs and manner verbs used across the three groups, and another one to compare the use of generic motion verbs and non-motion verbs between the KEB and EM groups.
The results of the first MANOVA analysis yielded statistically significant group differences on the combined dependent variables according to Pillai's Trace, V = .94, F(4, 214) = 47.00, p < .001, partial η 2 = .47. Follow-up univariate ANOVAs indicated statistically significant differences in both path and manner verbs: path verbs, F(2, 107) = 230.88, p < .001, partial η 2 = .81; manner verbs, F(2, 107) = 161.74, p < .001, partial η 2 = .75. All three Bonferroni post-hoc comparisons for each verb type were statistically significant (p < .001 for all comparisons), suggesting that the use of path and manner verbs differed across the three language groups. In essence, the Korean monolinguals strongly favored path verbs to describe motion events while the English monolinguals clearly preferred manner verbs, and the bilinguals were different from both monolingual groups in that they did not hold a strong preference for one particular verb type. While their most preferred verb type was manner verbs (69%), they also made use of path verbs in approximately 22% of the cases.
The second MANOVA with generic motion verbs and non-motion verbs as two dependent variables showed a difference between the KEB and EM groups, as indicated by Pillai's Trace, V = .08, F(2, 92) = 4.00, p = .02, partial η 2 = .08. Follow-up univariate ANOVAs revealed that statistically significant differences were only observed in their use of generic motion verbs, but not in their use of non-motion verbs: generic motion verbs, F (1, 93) = 6.2, p = .015, partial η2 = .06; non-motion verbs, F (1, 93) = 2.15, p = .146, partial η2 = .02. This suggests that the KEB group utilized generic motion verbs more frequently than the EM group.
6.2 Non-verbal categorization of motion events across groups
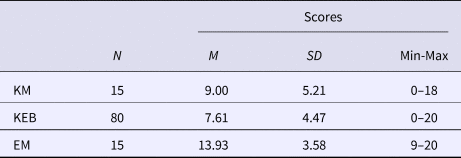
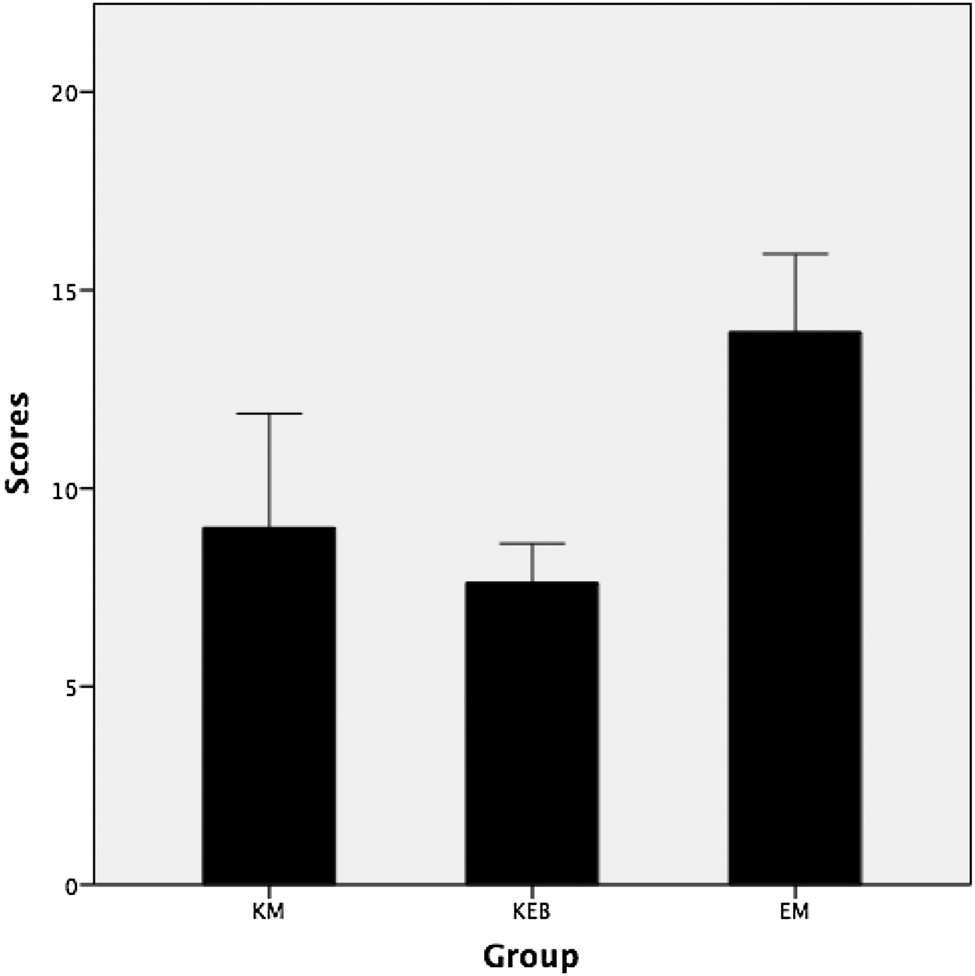
To investigate whether the three groups made similarity judgments based on the same motion component (path or manner), participants' scores on the triads-matching task were compared across groups. Table 8 summarizes the descriptive statistics for the task scores, and Figure 3 visually represents them. A higher value indicated participants' stronger preference for the manner variant, while a lower value reflected their preference for the path variant.
Descriptive statistics for the scores of the triads-matching task.

Note. KM = Korean monolinguals; KEB = Korean–English bilinguals; EM = English monolinguals; SD = standard deviation. Maximum possible score = 20.
Triads-matching task scores across group

ANOVA results indicated that there were statistically significant differences among the three groups, F (2, 107) = 12.70, p < .001, η2 = .19, and Bonferroni post-hoc comparisons demonstrated that the differences lay between the KM and the EM groups (p = .009, d = 1.10) as well as between the KEB and the EM groups (p < .001, d = −1.56), but not between the KM and the KEB groups (mean difference = 1.39, p = .816, d = .29). This shows that the Korean monolingual participants selected the manner variants significantly less than the English monolinguals, and so did the Korean–English bilinguals.
6.3 Factors that affect bilinguals' verbal and non-verbal behaviors
To investigate whether there were any significant predictors that may account for the verbal and non-verbal results, the information collected via the background questionnaire and via the direct measures of L2 proficiency was inspected, and the potential for any of these variables to account for the main findings was assessed in each case via stepwise regression analyses. The results in this section are presented below first for the bilinguals' frequency of encoding of manner and path and choice of verb type and then for the bilinguals' categorization behavior on the triads-matching task. The explanatory variables under investigation were: age of onset, self-rated English proficiency (speaking, reading, listening, writing, and overall), EIT scores, general vocabulary size (receptive and productive scores), motion-specific vocabulary size (receptive and productive scores), L2 use, length of study, and length of immersion in an L2-speaking country. For all analyses reported, the same standard data-screening process was followed: (a) the explanatory variables that had no correlation with a criterion variable were discarded; and (b) for variables that measured similar constructs and are thus intercorrelated among themselves to a moderate/high degree, the one with the strongest correlation coefficient was kept and the rest were dropped. The latter was done to avoid multicollinearity as well as yielding results that are cumbersome and uninterpretable.
6.3.1 Frequency of encoding
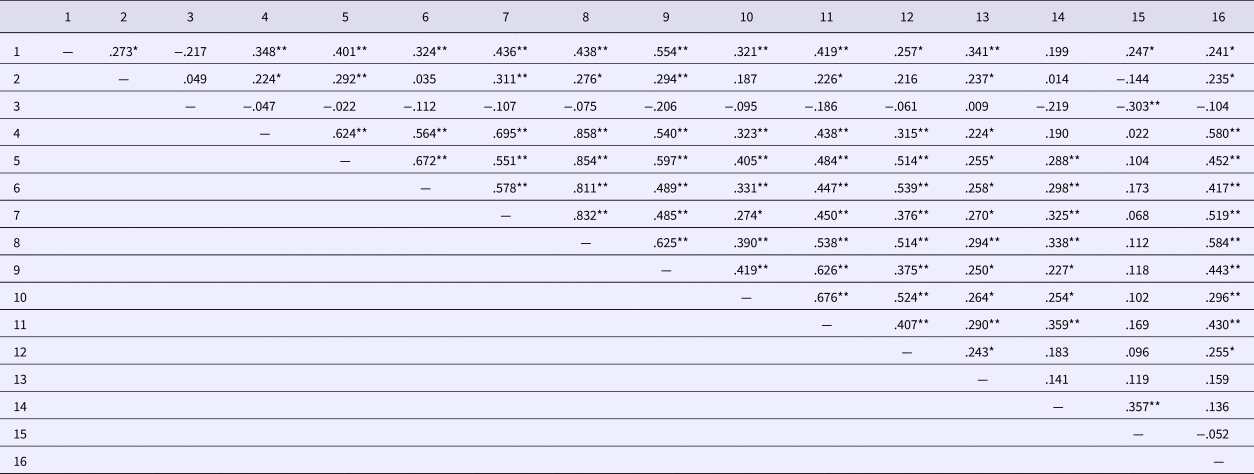
A correlation analysis was first carried out to determine the strength of relationship between the bilinguals' frequency of path and manner encoding and the explanatory variables of interest. Table 9 presents the correlation matrix for these variables.
Pearson correlations between frequency of encoding scores and language background measures.

Note. 1 = frequency of path encoding; 2 = frequency of manner encoding; 3 = age of onset; 4 = SRP (self-rated proficiency) speaking; 5 = SRP listening; 6 = SRP reading; 7 = SRP writing; 8 = SRP overall; 9 = EIT scores; 10 = GR (general receptive) vocab; 11 = GP (general productive) vocab; 12 = MR (motion-specific receptive) vocab; 13 = MP (motion-specific productive) vocab; 14 = L2 use in hours per day; 15 = length of study in months; 16 = length of immersion in an L2-speaking country in months
*p < .05, **p < .01
The correlation results indicated that the frequency of path encoding positively correlated with most of the bilinguals' language background factors to a moderate degree, with the more robust relationships located with EIT scores (r = .554, p < .001), SRP overall (r = .438, p < .001), SRP writing (r = .436, p < .001), and GP vocab (r = .419, p = .002). Similarly, the frequency of manner encoding also correlated with various language background factors to a modest degree, including SRP writing (r = .311, p = .005), EIT scores (r = .294, p = .008), and SRP listening (r = .292, p = .009).
Next, separate stepwise regression analyses were performed to assess the predictive power of the bilinguals' frequency of path and manner encoding. The first regression was conducted on the frequency of path encoding as the dependent variable and four independent variables chosen based on the data-screening criteria: EIT scores (i.e., the overall proficiency score with the strongest coefficient), GP vocab scores (i.e., the vocabulary size score with the strongest coefficient), length of study, and length of immersion. EIT scores were first entered into the regression equation, and the final model was statistically significant, F(1, 78) = 34.49, p < .001, indicating that EIT scores accounted for approximately 30.7% of the variance in the frequency of path encoding. All the remaining variables were removed from the model as they did not significantly contribute to R-squared.
The second stepwise regression analysis was conducted on the frequency of manner encoding with three predictors based on the correlation matrix (EIT scores, MP vocab scores, and length of immersion), and the regression model was found to be statistically significant, F(1, 78) = 7.36, p = .008. As it was the case with the first regression model, EIT scores were the only significant predictor in the regression, accounting for 8.6% of the total variance in the frequency of manner encoding.
6.3.2 Choice of verb types
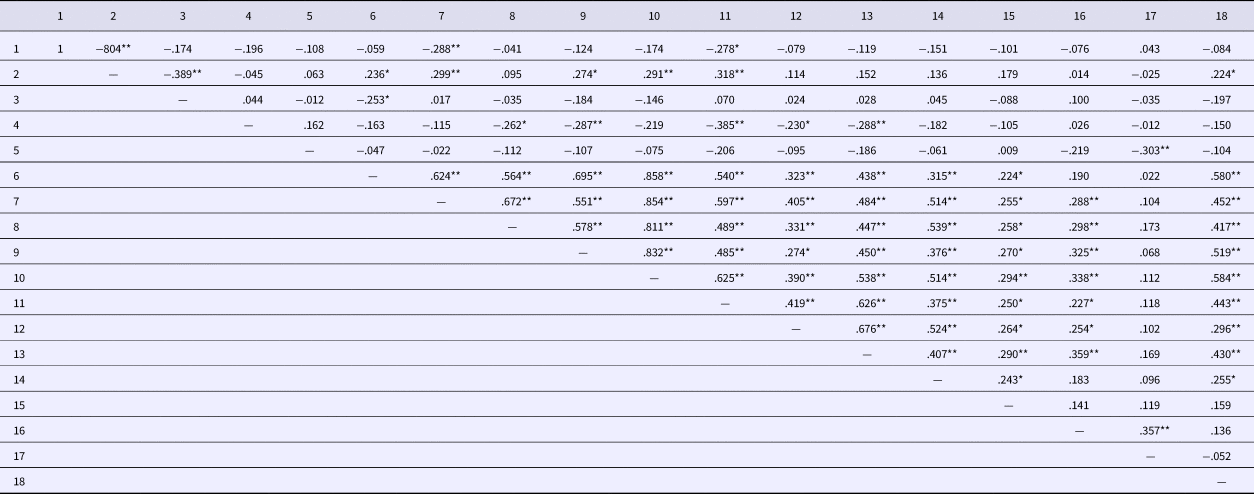
A correlation matrix was created with bilinguals' choice of verb types (path, manner, generic motion, and non-motion verbs) and different language background factors. As shown in Table 10, the bilinguals' use of path verbs was negatively correlated with two measures of English proficiency to a modest degree: SRP listening (r = −.288, p = .010) and EIT scores (r = −.278, p = .013). Their use of manner verbs positively correlated with various language background factors to a moderate degree, with the more robust relationships located with EIT scores (r = .318, p = .004), SRP listening (r = .299, p = .007), and SRP overall (r = .291, p = .009). The use of generic motion verbs displayed an inverse relationship with SRP speaking (r = −.253, p = .023), and the use of non-motion verbs negatively correlated with various language-related measures, including EIT scores (r = −.385, p < .001), SRP writing (r = −.287, p = .010), and GP vocab (r = −.288, p = .010).
Pearson correlations between verb types and language background measures.

Note. 1 = path verbs; 2 = manner verbs; 3 = generic motion verbs; 4 = non-motion verbs; 5 = age of onset; 6 = SRP (self-rated proficiency) speaking; 7 = SRP listening; 8 = SRP reading; 9 = SRP writing; 10 = SRP overall; 11 = EIT scores; 12 = GR (general receptive) vocab; 13 = GP (general productive) vocab; 14 = MR (motion-specific receptive) vocab; 15 = MP (motion-specific productive) vocab; 16 = L2 use in hours per day; 17 = length of study in months; 18 = length of immersion in an L2-speaking country in months
*p < .05, **p < .01
Next, four separate regression analyses were conducted to estimate the predictive power of the bilinguals' use of each verb type, using language background factors that had significant relationships with each verb type as predictor variables. The first regression for path verbs was performed with EIT scores as the only predictor variable. The second regression model for manner verbs was run with EIT scores and length of immersion as the predictors. The third regression for generic motion verbs had SRP speaking as the only predictor variable. Lastly, the fourth regression equation for the use of non-motion verbs was performed using EIT scores and GP vocab scores as possible predictors.
The results demonstrated that the use of different verb types was most strongly associated with an English proficiency measure (mostly EIT scores), and the extent of variance that could be explained by this variable was modest: for path verbs, 7.7% by EIT scores, F(1, 78) = 6.52, p = .013; for manner verbs, 10.1% by EIT scores, F(1, 78) = 8.79, p = .004; for generic motion verbs, 6.4% by SRP speaking, F(1, 78) = 5.34, p = .023; and for non-motion verbs, 14.8% by EIT scores, F(1, 78) = 13.58, p < .001.
6.3.3 Bilingual non-verbal categorization of motion events
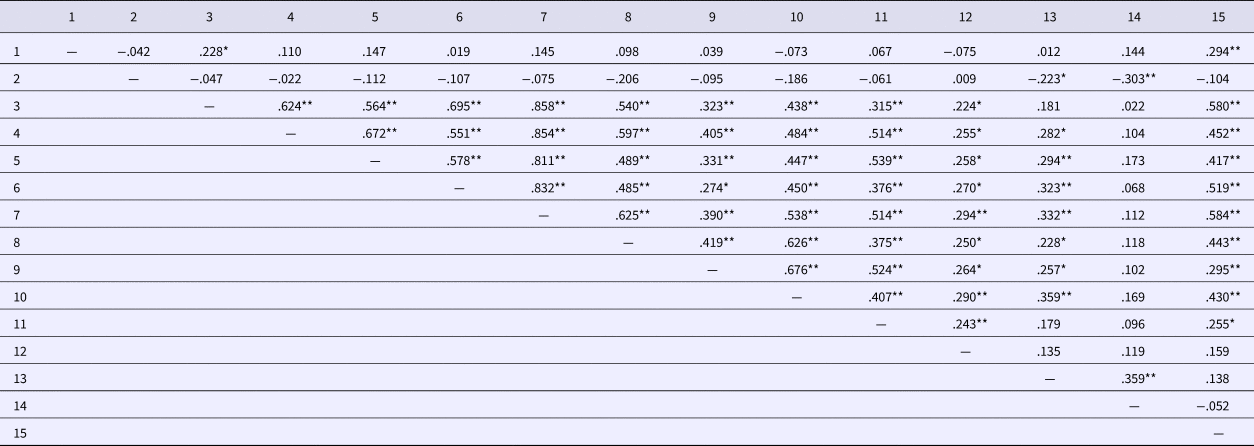
Table 11 shows the correlation matrix between their triads-matching task scores and the explanatory variables of interest. Modest correlations were found between the manner scores and length of immersion (r = .294, p = .008) as well as SRP speaking (r = .228, p = .042). Based on this correlation analysis, a stepwise regression analysis was performed to examine the extent of variance of the triads-matching scores explained by these two potential predictor variables. The regression model was statistically significant, F(1, 78) = 7.41, p = .008, and the length of immersion accounted for about 9% of the explained variance to the prediction of the triads-matching task scores. On the other hand, SRP speaking did not significantly contribute to R-squared and was removed from the model.
Reliability coefficients and intercorrelations among the measures of the study for the bilingual group.

Note. 1 = Manner scores; 2 = age of onset; 3 = SRP (self-rated proficiency) speaking; 4 = SRP listening; 5 = SRP reading; 6 = SRP writing; 7 = SRP overall; 8 = EIT scores; 9 = GR (general receptive) vocab; 10 = GP (general productive) vocab; 11 = MR (motion-specific receptive) vocab; 12 = MP (motion-specific productive) vocab; 13 = L2 use in hours per day; 14 = length of study in months; 15 = length of immersion in an L2-speaking country in months
*p < .05, **p < .01
7. Discussion
7.1 Bilinguals' motion encoding patterns: L1-like, target-like, or in-between?
The first research question examined how Korean–English bilinguals encode motion events in comparison to Korean and English monolinguals. Motion encoding patterns were analyzed in terms of the frequency of encoding path and manner information and the type of verb used in their descriptions. The results of the monolingual data confirmed the previous literature in that Korean and English monolinguals made different decisions about what to say, reflecting the characteristics of V-language and S-language speakers (Berman & Slobin, Reference Berman and Slobin1994; Choi, Reference Choi and Gathercole2009; Slobin, Reference Slobin, Shibatani and Thompson1996b, Reference Slobin, Neimeier and Dirven2000), respectively. While path encoding was comparably high for the two groups, their likelihood of manner encoding certainly contrasted. As speakers of a S-language, the English monolinguals expressed manner more frequently than the Korean monolinguals, who were speakers of a V-language. The generally high level of path encoding in both Korean and English adds validity to Slobin's (Reference Slobin, Gumperz and Levinson1996a, Reference Slobin, Strömqvist and Verhoeven2004) manner salience hypothesis, which posits that cross-linguistic differences are only observed in the likelihood of manner encoding. The two monolingual groups also showed divergent patterns with respect to where they expressed different motion components, reflecting Talmy's typology of motion events (Talmy, Reference Talmy and Shopen1985, Reference Talmy2000). As has been documented of Korean (Choi, Reference Choi and Gathercole2009; Choi & Bowerman, Reference Choi and Bowerman1991) and many other V-languages (Berman & Slobin, Reference Berman and Slobin1994; Slobin, Reference Slobin, Shibatani and Thompson1996b, Reference Slobin, Neimeier and Dirven2000), the Korean monolinguals preferred to encode path in the main verb, while the English monolinguals expressed manner in the main verb position, as also amply established of English (Slobin, Reference Slobin, Neimeier and Dirven2000, Reference Slobin, Strömqvist and Verhoeven2004) and other S-languages (Cadierno & Lund, Reference Cadierno, Lund, Patten, Williams, Rott and Overstreet2004; Cadierno & Ruiz, Reference Cadierno and Ruiz2006; Slobin, Reference Slobin, Strömqvist and Verhoeven2004). These findings together confirm that language-specific constraints exist in how speakers select and structure information (von Stutterheim & Nüse, Reference von Stutterheim and Nüse2003).
As speakers of the two languages that display contrasting motion encoding patterns, the Korean–English bilinguals exhibited various encoding patterns. First, the current findings reflect instances of conceptual transfer, demonstrating that L1 traces of information selection, at least in certain respects, prevailed in the descriptions of motion events. While manner was highly encoded in the descriptions of the English monolinguals, it was expressed significantly less by the bilinguals. This suggests the transfer of L1-based patterns, as the preference to omit manner information is one of the characteristics of Korean speakers. However, the bilinguals were also guided by English encoding patterns in their predilection to express manner in the main verb and path in a satellite. Although their tendency to use manner verbs was in between that of the two monolingual groups, the bilingual group's frequency value was closer to the English monolingual end (see Table 6). This suggests that as a group, these bilinguals moderately have diverged from their L1 patterns in the direction of the L2 when it came to information packaging. The existence of both Korean and English encoding patterns within the bilingual descriptions reflects that the Korean–English bilinguals made use of the L1 and L2, the two sets of linguistic resources that were at their disposal. While their use of the L1-based or L2-based encoding patterns may vary among individuals' background factors, it nevertheless shows that the bilinguals took advantage of being bilingual by utilizing all of their linguistic resources to convey meaning. This supports the claim of Daller and colleagues (Reference Daller, Treffers-Daller and Furman2011) that simultaneous influences from both languages appear to be a common pattern in bilingual speakers.
In addition, the bilinguals also exhibited some unique, divergent patterns that could not be traced back to preferences or resources typical of either of the monolingual groups. One of them was a slightly lower frequency of path encoding compared to the two monolingual groups. While the Korean–English bilinguals encoded path significantly less frequently than the English monolinguals, the difference between the bilinguals and the Korean monolinguals was statistically equivalent. However, given that both Korean and English monolingual speakers expressed path with an equally high level of frequency in their descriptions (KM = 94%, EM = 98.33%), L1 influence is not likely to be an adequate account for the bilinguals' relatively lower frequency of path encoding. In retrospect, the bilinguals' difficulties may have had to do with acquiring English prepositions. The most prototypical way to express path in English is by means of a preposition, such as into, across, and so on, thus often recruiting the use of prepositions. If so, learners of English must have a good handle on spatial prepositions in order to express path in their L2 descriptions of motion events. However, some non-target-like use of path particles was observed in the bilinguals' descriptions, albeit of low incidence (only 6.5%; see section 6.1 and footnote 1). This suggests that knowledge of English spatial prepositions may have not been fully developed for all 80 bilinguals at the time of testing. Moreover, their lower suppliance of path information, when compared to the two monolingual groups, may have been in part related to limited prepositional knowledge in cases of a missing preposition (‘She jumps the books', intended to mean ‘She jumps over the books'), which would have been counted as no path encoded. This is unsurprising given that the bilinguals were sampled to represent a wide range of proficiencies (see EIT scores ranging from 48–106 out of 120, cf. Table 2), and SLA research amply documents that prepositions are an area of difficulty for L2 learners even into the advanced levels (Gardner & Davies, Reference Gardner and Davies2007; Liu, Reference Liu2011; Tyler, Mueller & Ho, Reference Tyler, Mueller and Ho2011; White, Reference White2012; Zhao & Le, Reference Zhao, Le, Ortega, Tyler, Park and Uno2016) and that avoidance is a common strategy when it comes to prepositions in particular (Becker, Reference Becker2014; Dagut & Laufer, Reference Dagut and Laufer1985; Laufer & Eliasson, Reference Laufer and Eliasson1993; Liao & Fukuya, Reference Liao and Fukuya2004). Therefore, it is possible that the slightly lower frequency of path encoding compared to the two monolingual groups is not a matter of L1 transfer or of L2 approximation, but the result of a unique learner solution found at the lower ranges of proficiency.
Another characteristic of the bilingual group that reflects their ongoing learning of L2 motion encoding is their use of generic motion verbs. Compared to the English monolinguals, the bilinguals more frequently made use of motion verbs that do not encode either path or manner and thus, are semantically more bleached (e.g., ‘she gets out of the room’). Since the Korean monolinguals did not employ any generic motion verbs, the bilinguals' relatively frequent use is unlikely to be a result of following an L1-based pattern. It is possible that the use of more general verbs may be a common learner behavior, as the predilection to rely on more general, high-frequency verbs by L2 learners has been documented in other studies as well (Römer, O'Donnell & Ellis, Reference Römer, O'Donnell and Ellis2014). Such tendency may be explained in terms of learners' vocabulary capacity or the relative ease of activation. That is, learners may gravitate towards more general verbs because they do not yet have specific lexical verbs stored in their vocabulary repertoire, or because they find it more convenient to activate and retrieve verbs that have high frequencies in usage and can be used in a wider range of contexts. While the current study utilized a battery of vocabulary size tests to directly measure the bilinguals' general as well as motion-specific vocabulary size, none of them was related to the bilinguals' use of generic motion verbs in the regression results. Therefore, the bilinguals' use of generic motion verbs may have more to do with the convenience of retrieving general, highly frequent verbs than with their vocabulary capacity per se.
7.2 Bilinguals' motion event categorization patterns: lagging behind L2 motion descriptions
The second research question probed how Korean–English bilinguals made similarity judgments of motion events in comparison to the two monolingual baselines. As users of a V-language, the Korean monolinguals displayed categorization preferences for the path variant, while the English monolinguals preferred the manner variant. This pattern suggests that their respective categorization preferences were organized along typological lines of lexicalization. While similar findings were reported in previous investigations (e.g., Gennari et al., Reference Gennari, Sloman, Malt and Fitch2002; Kersten et al., Reference Kersten, Meissner, Lechuga, Schwartz, Albrechtsen and Iglesias2010), it is noteworthy to mention that such results were only found in studies that did not strictly control for language use. When considering these findings, it is possible to speculate that the observed language-specific categorization patterns may be a consequence of linguistic mediation during a non-verbal task. There are two reasons why this may be the case: first, the verbal encoding task preceded the non-verbal task in the current experiment, potentially allowing prior verbal encoding to have a spillover effect on participants' similarity judgment. Despite the fact that a short break was provided between the two tasks, the given time might have not been enough to wash out any lingering language effects. Second, verbal interference employed in the current triads-matching task required participants to repeat a new string of numbers after every ten triads rather than after every triad as used in previous studies (e.g., Athanasopoulos & Bylund, Reference Athanasopoulos and Bylund2013; Papafragou & Selimis, Reference Papafragou and Selimis2010). While the task was made less taxing and time-consuming for participants, the disruptive power of verbal shadowing in the triads-matching task might have been weakened to a point where it allowed verbally mediated categorization. Therefore, one must take these experimental conditions into account when interpreting the language-specific effects on motion event cognition observed in the current study.
As for the Korean–English bilinguals, they patterned more similarly with their Korean monolingual counterparts in a cognitive task by choosing path variants more frequently than manner variants. This is in stark contrast to the bilinguals' English descriptions of motion events, which resembled English-based patterns to a certain extent. Thus, while their verbal behavior demonstrated that the L2 exerted some influence on the bilinguals' motion encoding patterns, their non-verbal behavior suggests the opposite: that the L2 did not influence categorization preferences, at least to the point that they significantly diverged from those of the Korean monolinguals.
This finding suggests that cognition in sequential bilinguals is more likely to be influenced by bilinguals' dominant language, which in this case was Korean. Despite the large variation among the bilinguals in their English proficiency, all of them (a) considered Korean as their L1; (b) used Korean much more frequently in their daily lives (the average hours of daily L2 usage was only 1.54 as shown in Table 2; and (c) resided in Korea at the time of testing. Therefore, if language were to influence categorization for the Korean–English speakers in the current study, that linguistic influence is likely to come from Korean as opposed to English. Furthermore, it is worth pointing out that not only was Korean the language of the environment, but it was also the language of experiment instruction. As previously shown (Athanasopoulos et al., Reference Athanasopoulos, Bylund, Montero-Melis, Damjanovic, Schartner, Kibbe, Riches and Thierry2015; Kersten et al., Reference Kersten, Meissner, Lechuga, Schwartz, Albrechtsen and Iglesias2010, but see Filipović, Reference Filipović2011), bilinguals' non-verbal behavior may be sensitive to language of operation, such that they display L1 patterns when the main medium of instruction is the L1, and they display L2 patterns when instructions are given in the L2. Therefore, it is possible that the activation of Korean was even more reinforced under the experimental condition where Korean was the language of testing. Since Korean was both the language of testing and most dominant language of the Korean–English speakers, the present study, however, is unable to tease out the effect of language context from the effect of language dominance.
The fact that certain aspects of the bilinguals' motion descriptions began to resemble L2-based patterns while their non-verbal behavior nevertheless continued to follow L1-based patterns primarily reveals that their non-verbal categorization behavior was more resistant to change than their verbal behavior. This suggests that it may be easier for L2 speakers to restructure their linguistic behavior and accommodate to the linguistic preferences of the target language community than to restructure cognition by incorporating new ways of categorizing reality; for example, motion events. Developing proficiency in L2 encoding patterns is relatively straightforward in the sense that learners can easily find in the linguistic input where different aspects of motion get expressed in target-like utterances. With sufficient exposure, they may come to know that English accords manner a special importance and also tends to express manner in verbs. In addition, the learning of encoding patterns can be reinforced by means of formal instruction. By comparison, conceptual categories are not something that are spontaneously attended to or commented upon during naturalistic exchanges, nor are they explicitly taught or discussed in instructional settings. Rather, they emerge from habitual or recurrent use of language-specific patterns that gradually encourage the association of conceptual categories with those patterns and eventually make them salient in the mind of the language user (Athanasopoulos & Bylund, Reference Athanasopoulos and Bylund2013; Casasanto, Reference Casasanto2008). Therefore, a restructuring of learners' conceptual categories is less likely to occur unless learners are presented with sufficient instances of language-specific patterns, which will lead to the construction and strengthening of new associations between words and their referents.
7.3 The differentiated roles of L2 proficiency and L2 immersion
The third research question examined whether the bilinguals' L2 encoding patterns and categorization preferences were influenced by their language-related factors. On the video description task, the best predictors of more English-like encoding patterns were (a) EIT scores for frequency of path (30.7%) and manner (8.6%), choice of manner verbs (10.1%), path verbs (7.7%), and non-motion verbs (14.8%); and (b) self-rated proficiency in speaking for the use of generic motion verbs (6.4%). The EIT scores were positively associated with the frequency of path and manner, and the use of manner verbs, indicating that the higher the bilinguals' proficiency was, the more frequently they expressed path and manner information and used manner verbs in their descriptions. While EIT scores accounted for 8.6% of the variance in the frequency of manner, their contribution to the variance in the frequency of path and the use of manner verbs was greater (30.7% and 10.1% respectively). The negative association between EIT scores and two verb types that were not frequently used by the English monolinguals (i.e., the use of path verbs and non-motion verbs) demonstrates that higher proficiency tends to reduce non-target-like behaviors. Specifically, the decrease in the use of path verbs (i.e., the Korean-like verb choice) with higher EIT scores suggests that more proficient bilinguals were able to overcome L1 conceptual transfer and converge on the target-like patterns. This finding is in line with Cadierno and Ruiz (Reference Cadierno and Ruiz2006), who concluded that L1 motion encoding patterns seem to lessen as L2 learners develop higher proficiency. Similarly, another non-target-like feature, the use of generic motion verbs, was negatively associated with self-rated proficiency in speaking. This shows that one of the learner behaviors found in the bilinguals' descriptions diminished with higher confidence in L2 speaking ability. While EIT scores (and for fewer analyses, self-rated proficiency) emerged as significant predictors for various aspects of English-like encoding patterns, the percentage of the explained variance by these factors was quite small for some of the encoding features. Therefore, it must be acknowledged that there will be other factors at play besides proficiency.
With respect to the bilinguals' non-verbal categorization preferences, length of immersion in an L2-speaking community emerged as the sole predictor of cognitive restructuring in the direction of the L2, accounting for approximately 9% of the variance. Thus, the longer a bilingual speaker had been immersed in an English-speaking country, the more likely the speaker was to categorize motion events by manner, which was the preferred criterion for the English monolinguals. This finding further suggests that the target language community is conducive for L2 speakers to learn to accommodate the non-verbal perspectives and construals of the target community into their own representations. Of the 80 bilingual speakers in the current study, 50% of them had no immersion experience (N = 40), while approximately 14% of them had at least 1.5 years of immersion experience (N = 11). It is worth noting that the shortest period of time that shows an effect for length of immersion was 1.5 years based on the findings of previous studies (Athanasopoulos, Reference Athanasopoulos2009; Athanasopoulos et al., Reference Athanasopoulos, Dering, Wiggett, Kuipers and Thierry2010; Cook et al., Reference Cook, Bassetti, Kasai, Sasaki and Takahashi2006). Despite the fact that length of stay for more than half of the bilingual speakers was less than 1.5 years, an effect for length of stay was nevertheless observed in the present study.
Previous studies, together with the current study, shed important light on the role of cultural immersion in cognitive restructuring. The immersion context, unlike the classroom context, provides a naturalistic learning setting in which L2 learners can avail themselves of massive and rich exposure to authentic input as well as to culture (Kasper & Rose, Reference Kasper and Rose2002; Pérez-Vidal & Juan-Garau, Reference Pérez-Vidal and Juan-Garau2011). Therefore, a longer stay in an L2 context would entail: (a) increase of L2 proficiency; (b) repeated opportunities where the L2 speaker is showered with more instances of the specific conceptual category in question; and (c) a specific context in which learning is grounded (Bylund & Athanasopoulos, Reference Bylund and Athanasopoulos2014b, p. 959). As a result of being immersed in these conditions that are more conducive to cognitive restructuring, the L2 speaker may, either consciously or unconsciously, learn to accommodate the non-verbal perspectives and construals of the target community into their own representations.
8. Limitations and Conclusion
In evaluating the current findings, it is important to acknowledge some limitations. One methodological shortcoming has to do with the fact that the verbal task preceded the non-verbal task, opening up the possibility for participants' prior linguistic encoding to have a spillover effect on their similarity judgment. Although verbal interference during the triads-matching task was meant to suppress any lingering spill-over effects from the previous verbal task, the modified version used in the current study was less cognitively taxing (i.e., participants were given a new string of numbers after every ten triads rather than after every triad) compared to the standard verbal interference paradigm used in previous studies (e.g., Athanasopoulos & Bylund, Reference Athanasopoulos and Bylund2013; Papafragou & Selimis, Reference Papafragou and Selimis2010). Therefore, it is possible that such a condition might have encouraged the participants to feel at ease reciting numbers after a few times, making the disruptive power of verbal shadowing weakened to a point where it allowed verbally mediated categorization. While further empirical investigation is needed to confirm this speculation, the present findings suggest that the relaxed version of verbal shadowing was not strong enough to impede expected categorization differences between the two monolingual groups, who behaved as predicted by linguistic relativity. To ensure that no linguistic representations are evoked by the experimental design, future studies should carry out a non-verbal task without prior event descriptions.
Second, the present study used a non-verbal task (i.e., triads-matching task), in which participants to had to make a forced choice between path and manner. While this task has been popular among previous studies that investigated motion event cognition, more recent studies (Kersten et al., Reference Kersten, Meissner, Lechuga, Schwartz, Albrechtsen and Iglesias2010; Montero-Melis & Bylund, Reference Montero-Melis and Bylund2017; Montero-Melis, Eisenbeiss, Narasimhan, Ibarretxe-Antuñano, Kita, Kopecka, Lüpke, Nikitina, Tragel, Florian Jaeger & Bohnemeyer, Reference Montero-Melis, Eisenbeiss, Narasimhan, Ibarretxe-Antuñano, Kita, Kopecka, Lüpke, Nikitina, Tragel, Florian Jaeger and Bohnemeyer2017) have pointed out that this task, by its design, confounds path and manner preferencesFootnote 4. That is, it assumes that a higher path preference is equivalent to a lower manner preference when, in fact, both S-languages and V-languages prominently encode path information, and the difference between the two group lies in their frequency of manner encoding. Therefore, a non-verbal task that more adequately teases out path and manner preferences is necessary to investigate whether the linguistic differences between S-languages and V-languages are also manifested at the conceptual level.
Another limitation concerns with the way the linguistic data were coded. In addition to the coding of non-target-like preposition use, it would have been informative to code for omission of prepositions so as to gauge the incidence of non-target-like zero prepositions on the frequency counts for encoding of path. It may have also been profitable to include a test of prepositional knowledge in the battery of proficiency and vocabulary measures that was used. Neither strategy was featured in the study because the contribution of knowledge of prepositions to the encoding of motion events is an issue that has never been considered before in this domain of research. This is the first study of motion events to document prepositional knowledge as an important area in developing encoding patterns of motion events in L2 English, and more research is warranted to shed light on the relationship between prepositional knowledge and motion event encoding.
In sum, this study sought to expand the scope of motion research by examining Korean–English bilinguals, an under-represented population in this line of research, and most importantly by inspecting evidence within the same study and from the same participants for the influence of cognition on language and of language on cognition. Findings demonstrated that their L2 descriptions of motion events were under the influence of both Korean and English, and that they also exhibited encoding patterns that could not be traced back to their L1 or L2 patterns. Among many language background factors, L2 proficiency modulated the development of L2 motion encoding patterns. While bilinguals showed robust evidence that they were able to talk like English speakers to a certain extent, their non-verbal categorization behavior seemed to be guided by the L1 rather than by the L2. The best predictor of the cognitive shift towards the L2 pattern was length of residence in the L2-speaking country. From a theoretical perspective, this study suggests that increases in L2 proficiency can facilitate the development of target-like motion descriptions, whereas conceptualization of motion events does not seem to be driven by L2 proficiency improvements. Instead, the present evidence suggests that L2 learners may require experiential contact with the target language to support a cognitive shift towards the L2 pattern. The fact that the bilinguals' verbal and non-verbal behavior was modulated by different factors implies that different efforts may be required to think and speak like speakers of the target language, or rather, like accomplished bilinguals.
Author ORCIDs
Hae In Park, 0000-0003-0974-2169
Acknowledgements
I thank Lourdes Ortega for her insightful comments on an earlier version of this paper. I also thank the Editor and three anonymous reviewers for their valuable comments and suggestions on the manuscript. Any remaining errors are exclusively the responsibility of the author.