What explains variation in tax progressivity before World War I? The early development of tax states has become a central concern of comparative political economy, as a reflection of state building, as a battleground for political conflict (Mares and Queralt, Reference Mares and Queralt2015), and as a determinant of taxation with long-term implications (Scheve and Stasavage, Reference Scheve and Stasavage2016).
Most explanations of these tax outcomes focus on the power of the poor. Changes in the political power of the left have been attributed to economic inequality and democratic institutions (Aidt and Jensen, Reference Aidt and Jensen2009), or ideational change, as with the wartime sacrifice of the poor (Scheve and Stasavage, Reference Scheve and Stasavage2016). These accounts share a focus on a single dimension of political competition: progressive taxation is a victory for the lower income “side” in a battle between classes. I follow Mares and Queralt (Reference Mares and Queralt2015) and Beramendi, Dinecco and Rogers (Reference Beramendi, Dinecco and Rogers2019) in arguing that it also served as a tool in intra-rich conflict. Tax compromise with the poor was used to secure victory in a specific type of elite disagreement: conflict over trade.
Trade politics was an important element of political competition in the period of early progressive tax reforms, and, a long-standing body of work has studied these trade coalitions (Gourevitch, Reference Gourevitch1977; Rogowski, Reference Rogowski1989; Hiscox, Reference Hiscox2002). Changing levels of international integration led to different alliances between capitalists, landowners, and workers in different countries. For example, where labor and capital both gained from expanding trade they formed “radical” coalitions as trade expanded (Rogowski, Reference Rogowski1989, p. 8). That this coalition secures free trade is not news. Rather, I examine its impact on non-trade politics—specifically, on progressive taxation.Footnote 1
I argue that where the richFootnote 2 were sufficiently divided on trade policy, this could overshadow conflict with the poor on redistribution. In these contexts, pro-redistribution groups were important allies in the conflict over trade. An elite–poor bargain on redistribution to secure one side of the trade conflict could be preferable to compromise on trade to avoid redistribution, depending on two key parameters. First, higher inequality increased the stakes of redistribution (Acemoglu and Robinson, Reference Acemoglu and Robinson2005), making concessions on progressive taxation more costly. Second, the more similar the trade interests of the poor to one side of the elite conflict, the better the chances of elite–poor compromise. Finally, trade interests interact with interests over redistribution to shape tax outcomes.
I use two empirical strategies to investigate these ideas. First, I consider time-series cross-sectional data for ten western European countries between 1870 and 1913. Assuming that factor ownership drives trade preferences, the evidence is consistent with the theory. Second, I study the theoretical mechanisms within Britain, between 1903 and 1910. Local implementation of political compromises with labor were more likely where the middle class was more committed to free trade and MPs representing free trade areas were more likely to support progressive taxation, even when constituency interests in redistribution are taken into account.
1. Trade, inequality, and progressive outcomes
The theoretical innovation here is to incorporate trade policy preferences into the analysis of domestic taxation in pre-war Europe. The presence of a second dimension matters for redistribution elsewhere: for Roemer (Reference Roemer1998) and Finseraas (Reference Finseraas2010) it explains why numerically dominant low-income voters do not expropriate the rich. A religious second dimension can weaken the link between economic interests and voting where redistribution is otherwise the majority preference. In early tax politics, trade operates in a similar fashion, leading to redistributive outcomes that reflect a compromise across two dimensions. By analogy to Roemer: if they care deeply about trade, and have widely disparate views on that issue, it does not follow that the rich will stick together to oppose redistribution. To secure their preferred trade policy, they may make concessions to labor, increasing progressivity.
1.1. Coalition and policy compromise at the turn of the century
Applied to the adoption of progressive taxation between 1870 and 1913, simplifying political battles over redistribution to this two-dimensional model works as follows.
Elites in all countries prefer low levels of distribution but may have varying positions on trade. Some may favor free trade, others protection, and elites within countries may disagree. The degree of variation in elite trade preferences differs between countries.
Labor groups prefer high levels of redistribution and are in direct conflict with elites on this issue. Where elites agree on trade, labor is politically isolated. Where there is elite disagreement on trade, though, labor may be able to provide support for one side of that dispute. An elite group who shares trade policy preferences with labor may prefer to incorporate labor into a coalition supporting their trade preference than to remain “allied” to other elites, compromising on trade to block redistribution.
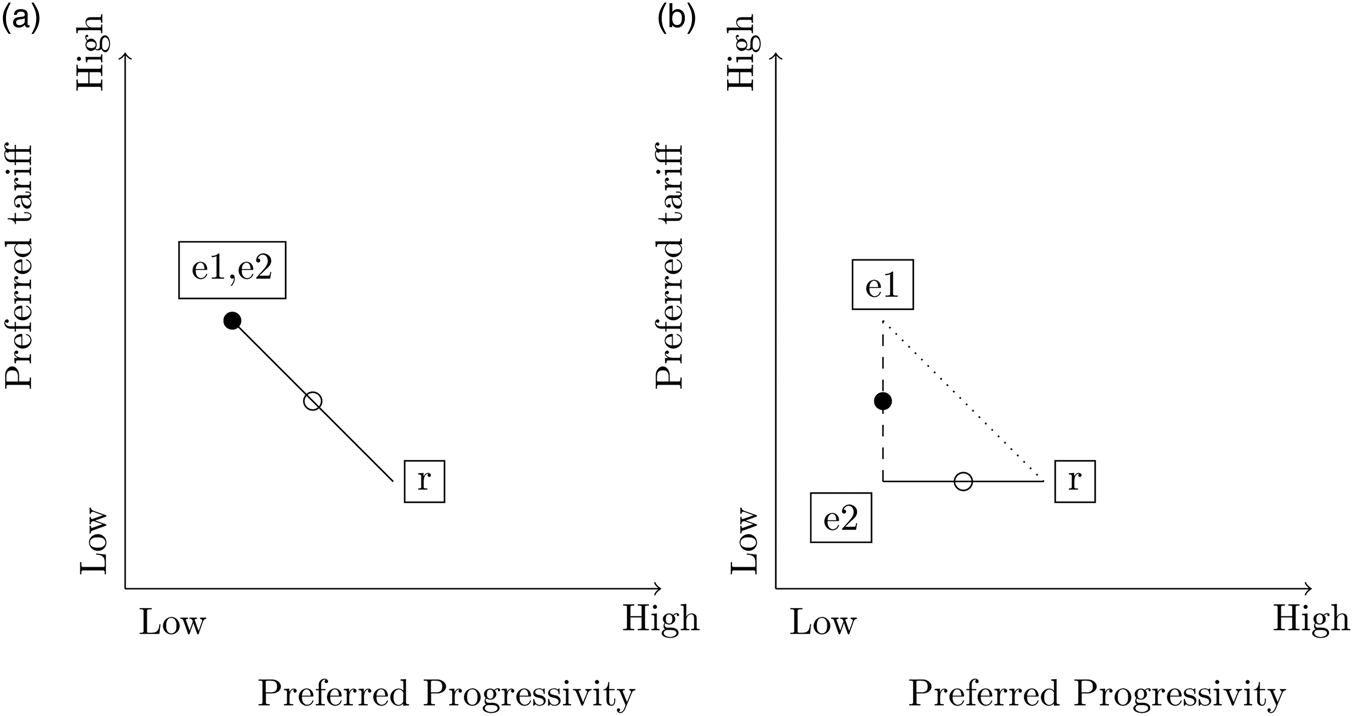
Figure 1 provides a spatial illustration.Footnote 3 The figure illustrates that multidimensionality matters, comparing the political space when a pro-redistribution group shares trade interests with a high-income group to that where it does not.
Economic groups in the two-dimensional policy space, with (panel b) and without (panel a) elite division on trade policy. e1 and e2 indicate elite groups (political insiders). By construction they have the same preference for low levels of progressivity. r indicates the pro-redistribution group. • indicates elite-compromise policy outcome; ° indicates outcome of e2−r compromise, assuming bargains negotiated with equal bargaining power. While e1−e2 “compromise” is clearly closer to e2's position where elites agree on trade, with elite division (in panel b) a compromise on progressivity with r is equally close to e2's position as a compromise on trade with e1.

In the left panel, advocates of redistribution (r) are isolated on both tariff and progressivity preferences. Political conflict is unidimensional along the diagonal line. On the right, one of the elite groups (e2) has trade interests similar to r. Although they still differ in their preferred level of redistribution, this creates the possibility of an e2−r coalition pitting free traders against the high-tariff elite (e1). With two dimensions, e2 may choose to prioritize trade over redistributive goals.
Labor will not necessarily win concessions on redistribution. e2 may still prefer the e2−e1 compromise. The model simplifies the bargaining environment considerably and the story is a complicated one overall.Footnote 4 But panel (b) allows for the possibility of redistributive reform to a much greater degree than (a), even though all groups' positions on redistribution are unchanged.
1.2. When does trade disagreement matter?
We can also make predictions about when and where redistributive compromise is more likely. Maintaining the spatial intuition, polarization (a greater distance between positions) on either dimension makes compromise on that dimension less appealing.
For the redistributive dimension, this means that inequality matters. Higher inequality gives low-income voters more to gain from redistributive policies, but high-income groups more to lose. In contrast, if trade differences between elite groups are relatively more pronounced, the axis of political competition—and the likelihood of progressive outcomes—shifts in the opposite direction. If elite trade interests are more polarized, more is lost in any trade compromise required to limit progressivity.
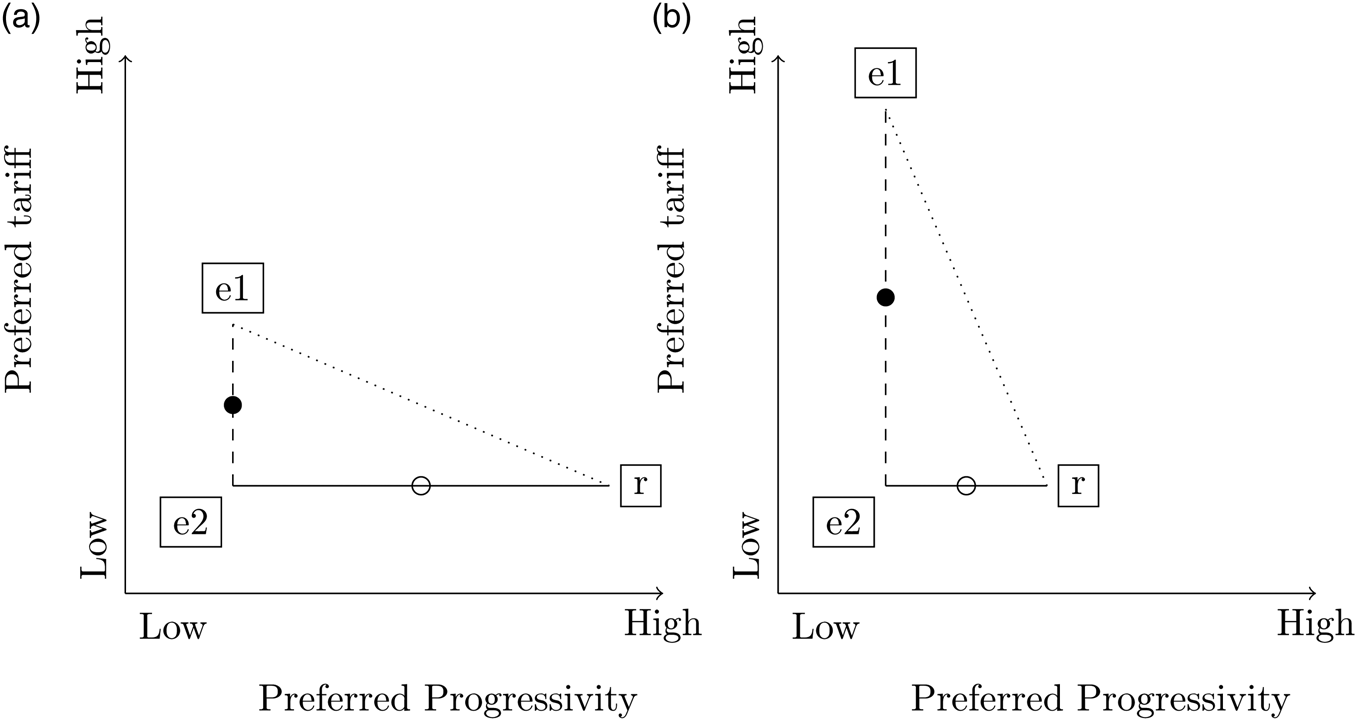
Again, this is most easily illustrated graphically. Higher inequality makes the redistributive demands of the poor more extreme (moving them away from the elite groups in the horizontal space, in Figure 2(a)). Where in Figure 1(b) they were equidistant, the elite compromise outcome is now closer to e2's position than compromise with r.
Groups of factor owners in the two-dimensional preference space, with high inequality (panel a) or large differences in trade preferences (panel b). e1 and e2 indicate elite groups (political insiders), r indicates the pro-redistribution group. • indicates e2−e1 compromise policy outcome; ° indicates indicates e2−r compromise policy outcome, assuming bargains negotiated with equal bargaining power. As inequality increases, r's redistributive demands get more extreme (panel a), and e1−e2 compromise becomes preferable for e2. Panel b shows more extreme protectionism from e1, which has the opposite effect, making compromise with r relatively more beneficial to e2.
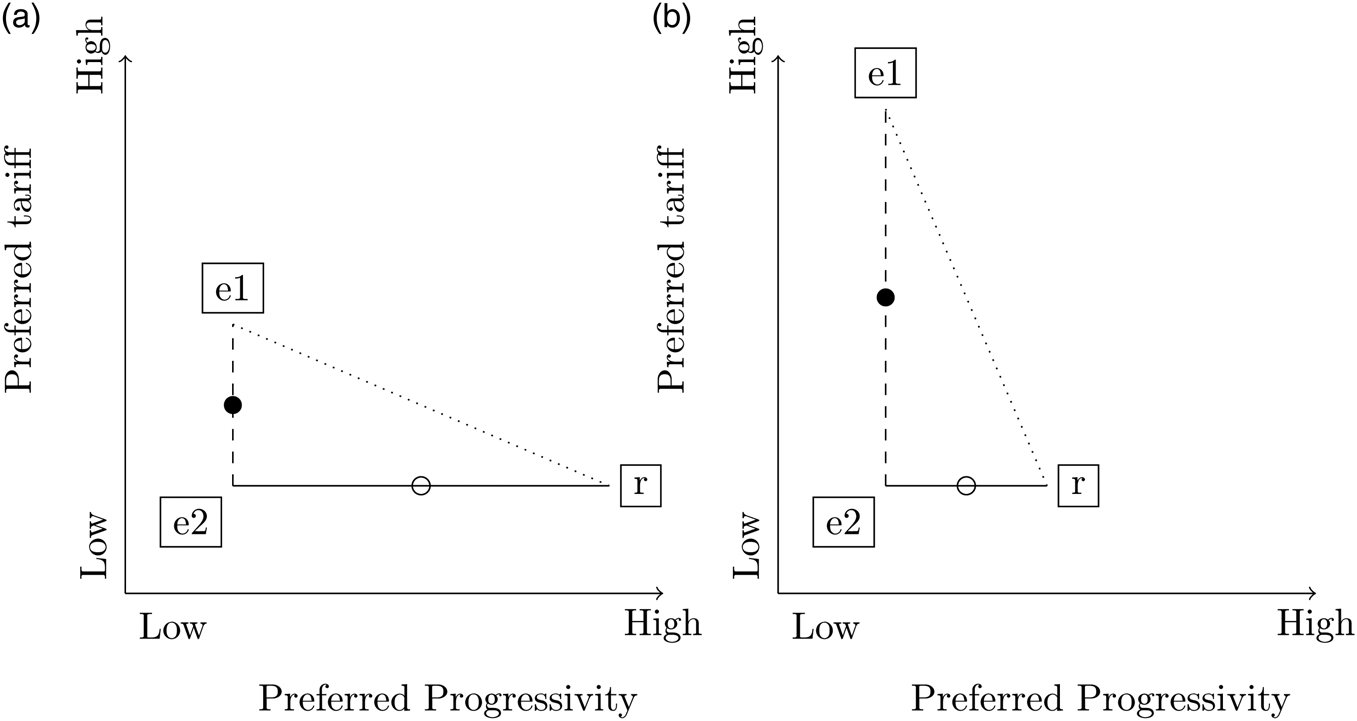
Figure 2(b) shows more pronounced divergence of elite trade interests. Now the compromise between e2 and r is closer to e2's position than the elite bargain. A coalition based on redistributive concessions is more probable, and progressive tax policy more likely. Greater inequality between high- and low-income groups, and smaller differences in trade interests within elite groups, will limit the extent of progressive tax policy.
Finally, the effects of trade distance and redistributive distance interact. At higher levels of inequality, any divergence between the trade preferences, the elite groups must be larger to incentivize cross-class compromise. Compare Figures 2(a) and 1(b). Trade differences need to be twice as large in the former for the same incentive for e2 to compromise with r. Not only should trade divisions between elites make progressive reform more likely, but this should be more pronounced where inequality is low.
1.3. Discussion
One concern about this argument is that progressivity and trade policy are not distinct. If the distributive implications of tariffs are just the opposite of progressive taxation, there is only one real policy dimension. However, tariffs need not necessarily be regressive. While they usually lead to price increases (disproportionately affecting poorer consumers) they also affect production wages, and the overall impact on low-income producers may be favorable. For example, tariffs supporting import-substitution policies in the new world reflected the protectionist position of labor in the late 19th-century United States (Rogowski, Reference Rogowski1987, p. 1125). Removal of tariff protection harms poor if it reduces low-skilled employment, as in 20th century Latin America (Huber and Stephens, Reference Huber and Stephens2012, p. 8).
For the period under study here, Kevin O'Rourke estimates that while the consumer-side effect of the “European grain invasion” (1870–1913) dominated its impact in Britain, in France the overall effect on real wages was negative (O'Rourke, Reference O'Rourke1997).Footnote 5 The 1892 Méline tariff in France substantially increased agricultural wages (Bignon and García-Peñalosa, Reference Bignon and García-Peñalosa2016), and in Australia, labor maintained minimum wage thresholds through “protectionist schemes… uncoupling (parts of) the domestic economy from international markets” (Adserà and Boix, Reference Adserà and Boix2002, p. 251). The full economic incidence of a tariff depends not only on its impact on consumption prices, but the general equilibrium effects on employment and wages. These can offset regressive effects on the consumption side.
I also assume that no group can “go it alone” and simply implement their preferred outcome on both dimensions, and the figures above assume equal bargaining power to determine the compromise outcomes. More realistically, groups with more power should secure better deals in coalition. In terms of the key intuitions, though, (marginally) more progressive policy would result from an elite–labor coalition than with a unified elite, even with unequal bargaining power.Footnote 6
The model is not intended as a realistic description of the policy-making process leading to progressive taxation, nor a complete account. Rather, it simplifies the scenario to integrate the insights of the trade coalition literature with what we know about inequality and redistribution. The main implication is that shared trade preferences between labor and an elite group should make progressive tax outcomes more likely.
2. Economic structure and tax outcomes
I consider the relationship between trade interests and progressivity in ten European countriesFootnote 7 between 1870 and 1913. I use structural features of each national economy to operationalize trade interests. Assuming factor ownership is the source of trade preferences, I find that a greater similarity between labor interests and an elite group increases progressivity, at least where inequality is low. However, these results do depend on the measurement of tax progressivity. The expectations of the theory hold when studying domestic indirect tax shares, direct tax shares, or top inheritance tax rates, but not top rates of income taxation.
2.1. Data and measurement
The three core variables of interest in theoretical terms are progressivity, inequality, and labor's potential advantage in forming coalitions on the basis of trade.
2.1.1. Progressivity
I measure the distributive orientation of the tax system using four different measures. First, I consider the share of domestic sales tax revenues in total revenue. This measure includes all domestic excise and general sales taxes, but excludes customs. These taxes fall disproportionately on lower income groups, so the measure is of inverse progressivity. This indirect revenue share is my preferred outcome measure, as Prasad and Deng (Reference Prasad and Deng2009) find that the sales tax share in total revenues is the aggregate tax feature most closely related to the concentration of tax payments on higher incomes. They argue “that the proportion of tax revenue raised through sales taxes can serve as an index of overall progressivity in situations where… detailed data… are not available” (Prasad and Deng, Reference Prasad and Deng2009, p. 431).
However, other recent work focuses on other measures. The share of revenues raised by direct taxation is a commonly used indicator of tax reform in this period, so I also consider this outcome.Footnote 8 Scheve and Stasavage (Reference Scheve and Stasavage2016) uses top marginal rates of income and inheritance taxation to measure progressivity. Detailed micro-level modeling indicates that there is little relationship between top marginal rates and overall progressivity (Verbist and Figari, Reference Verbist and Figari2014), but I consider them for the sake of comparison. Top rates may be important political indicators of progressivity even if they have little economic impact.
2.1.2. Inequality
I use the same measure of rural inequality as Ansell and Samuels (Reference Ansell and Samuels2010). This is: (1 – family farms) × (1 – urbanization), where “family farms” is the share of cultivable land farmed by (small) families. This choice (over income inequality measures), follows Ansell and Samuels (Reference Ansell and Samuels2010) and Ziblatt (Reference Ziblatt2008), who emphasize that fear of expropriation is better operationalized by inequalities in land ownership. Moreover, inheritance and land taxes as well as income taxation formed an integral part of the redistributive reforms.
2.1.3. Trade preferences and the labor trade advantage
I use the Stolper–Samuelson model of trade preferences, to characterize gains from trade according to ownership of factors of production: land, labor, and capital. Owners of different factors gain (lose) differentially from protection, and the scale of these gains (losses) shapes their support for tariffs. Gains from trade depend on the relative abundance of the factors. Owners of relatively abundant factors benefit from free trade; owners of scarce factors are harmed. Where labor is abundant, and land and capital scarce, we are in the situation of labor isolation as highlighted in Figure 1(a). If land is scarce but both capital and labor abundant, this mirrors Figure 1(b). Relative factor abundance thus drives trade policy preferences. These structural characteristics have the advantage that they are relatively exogenous to trade and tax policy choices.
Why focus on factor ownership? The alternative is that preferences depend on the industry a producer is in. However, mobility of factors equalizes their return across industries, so trade affects all owners of a factor of production similarly, and the period 1970–1914 was one of high inter-industry factor mobility (Hiscox, Reference Hiscox2002).
To measure factor abundance, I use the multi-country extension of Edward Leamer's “world abundance” (Leamer, Reference Leamer1980). Abundance is defined relative to a second factor, in proportion to the over-endowment of the home country compared to the rest of the trading world. That is, the abundance of factor i relative to factor j is given by

where m i indicates the endowment of factor i within the country relative to the average global endowment of that factor, $m^w_i$ indicates the endowment of all other countries, similarly scaled by the global mean. Labor's trade-ally advantage (LTA) is the degree to which its trade preferences are more similar to (the closer of) land or capital than capital and land's preferences are similar to each other. Thus the LTA is given by

where a ij is the relative abundance of i relative to j, for a, land; k, capital, and l, labor.
The data needed here are endowments of labor, land, and capital worldwide: relative abundance depends not only on the situation in the western European countries under study, but in all of their trading partners. I prioritize coverage of global trade over sophisticated measures. I use the length of the railway routes open at the end of each year as the absolute measure of capital endowment. This has the disadvantage that railways may have been owned publicly or by foreigners, but the advantage that railways were a relatively universal industry across countries. Moreover, the issue of foreign ownership is common across types of capital, and the railway route measure is widely used in the literature on economic development (Bairoch, Reference Bairoch1982) and trade politics of the period (Rogowski, Reference Rogowski1989).
Labor abundance is measured by population, and land by geographic area in 1913. I do not adjust for land usable for agriculture, nor for the share of the population actually in the workforce. This is not ideal, but coverage of all trading nations is not possible for the more subtle measures. In contrast, the data used here are available for 74 countries worldwide in the Cross-country Adoption of Technology Database Comin and Hobijn (Reference Comin and Hobijn2009).
Despite these caveats, the abundance measures have good face validity, corresponding to the “stylized facts” of the period. The UK (especially), France, and Germany have the highest levels of capital abundance, but this over-endowment decreases over time. Belgium and Italy see declines from lower initial levels, while the Scandinavian countries' relative endowment of capital is low but increasing through the period. All the countries in the sample outside Scandinavia are relatively abundant in labor compared to land.
Finally we must move from the preferences of each group to a single measure of labor's advantage as a trade ally. Labor is advantaged to the degree that its preferences are closer to a potential partner than that partner's alternative option. I take the distance between the two elite groups, land and capital, and subtract the distance between labor and its closest elite group. If labor is closer to one of the two elite groups than they are to one another, this “labor trade advantage” (LTA) measure will be positive; if the smallest distance from labor to another group on trade is greater than the intra-elite distance, the LTA is negative. Bigger dissimilarities are reflected in larger absolute values.
2.2. Model specifications
In principle, taxes are on the agenda annually in budget legislation. The country-year is the unit at which variation is possible, and taken as the unit of analysis. This time-series cross-sectional structure creates particular modeling issues (Beck and Katz, Reference Beck and Katz1995). The supporting material includes results from alternative specifications (including dynamic models considering long and short run effects). Since the main inferences are robust across these specifications, I present the simplest here: ignoring the dynamics but including country and year fixed effects to account for unobserved heterogeneity.
I incorporate various control variables suggested by the literature. Gross domestic product per capita (GDP p.c.) is included to measure the level of development, and create a dummy variable to indicate whether an explicit link between (direct) taxation and voting rights exists (Mares and Queralt, Reference Mares and Queralt2015).Footnote 9
There are some tricky questions about the inclusion of three further controls: trade openness, the breadth of the franchise, and the size of government. Trade as a share of the economy is shaped in part by the political processes examined here, so is post-treatment. On the other hand, trade is also affected by exogenous characteristics which vary across time and space, and existing levels affect the revenue and economic effects of tariffs. Openness may be an important omitted variable.
The extent of the franchise and the size of government pose structurally similar questions in terms of omitted variable versus post-treatment bias. Franchise extensions should increase progressivity (Acemoglu et al., Reference Acemoglu, Naidu, Restrepo, Robinson, Atkinson and Bourguignon2015), but the logic of coalition and inclusion implies that democratization might be a consequence of elites seeking to bolster their side of the trade conflict (Ansell and Samuels, Reference Ansell and Samuels2014). Similarly, expanding the public sector could be a concession to secure support from lower income groups, but studies of tax progressivity today argue that the structure of taxation is determined by its overall level (Ganghof, Reference Ganghof2006; Cusack and Beramendi, Reference Cusack and Beramendi2006).
On balance, in the period in question, I think that taxes as a share of GDP are more importantly post-treatment than pre-treatment, while the other two variables are more important as omitted variables. For taxes/GDP, the primary mechanisms for the endogeneity of structure to size work through the existence of high overall levels of taxation which do not apply in the pre-war period. Thus, I prefer specifications which exclude taxes/GDP and avoid the post-treatment bias. Nevertheless, I present results from the minimal and maximal models alongside my preferred specification in Table 1. Finally, the supplementary materials present analyses including a variety of indicators of state capacity. These leave the results substantively unchanged.
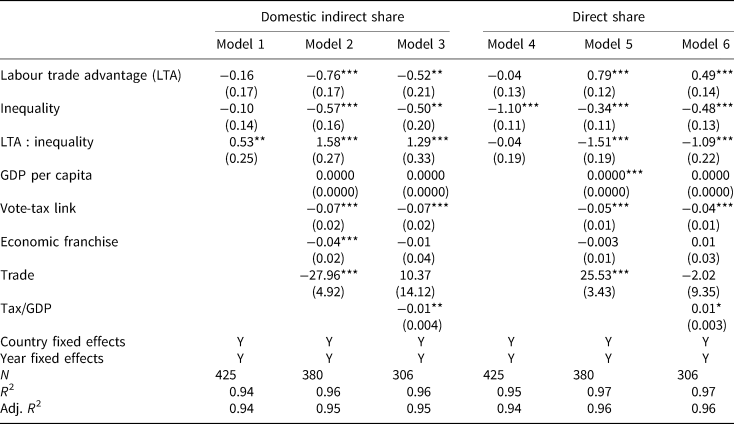
The determinants of revenue shares in total taxation, 1870–1913

***p < 0.01; **p < 0.05; *p < 0.1.
2.3. Results
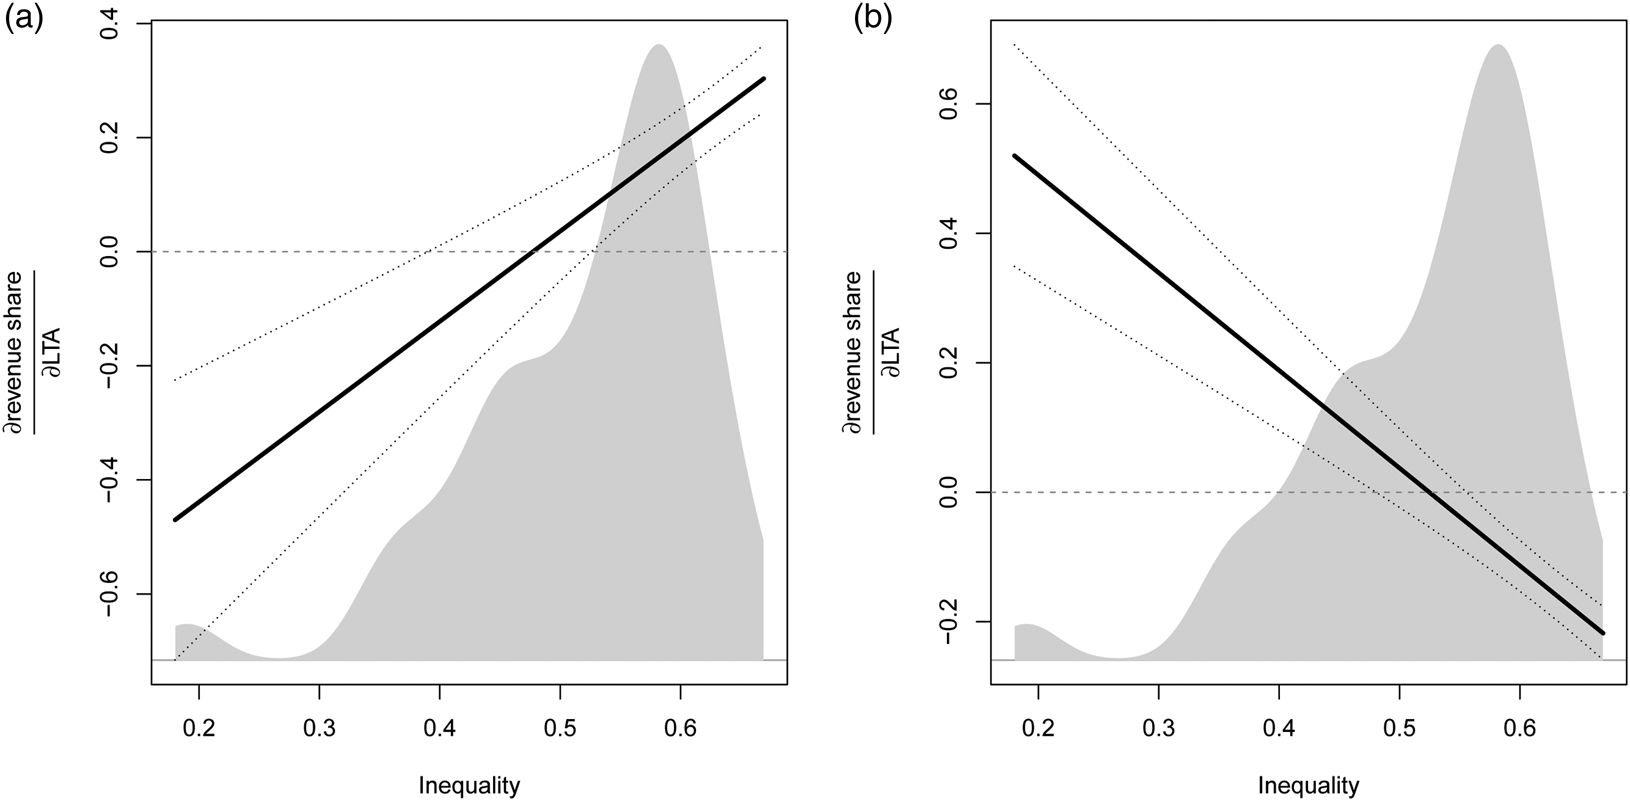
The results for the domestic indirect tax share and direct tax shares are presented in Table 1. But the main inference of interest is the interactive effect of trade preferences and inequality, and these are best illustrated graphically. Figure 3 shows the marginal effect of labor's trade advantage on the tax share outcomes as inequality varies.
The marginal effects of labor's trade advantage on (a) domestic indirect and (b) direct tax shares at varying levels of inequality. Estimates from Table 1.

At lower levels of inequality, there is a pronounced negative effect of the labor trade advantage on revenue from (regressive) domestic indirect sources, and a positive effect on the direct tax share. At low levels of inequality, shared trade interests between labor and an elite group are associated with material increases in progressivity. The shaded area indicates the distribution of observations on the inequality measure, reassuring us that these effects are relevant for a significant portion of the sample.
The size of the effect lacks a directly intuitive scale. However, one standard deviation of the measure of labor's trade advantage is 0.33. At levels of inequality that are average in the sample (0.50) a standard deviation move in trade advantage has no discernible impact. However, at the 25th percentile of inequality, the same improvement in labor's appeal as a trade ally translates to a 1.5 percentage point decrease in domestic indirect tax shares; at the 12.5th inequality percentile, a six-point decline.
2.4. Top tax rates
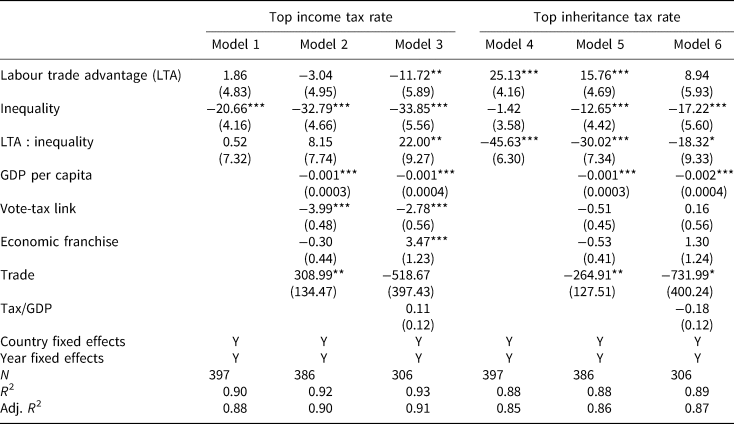
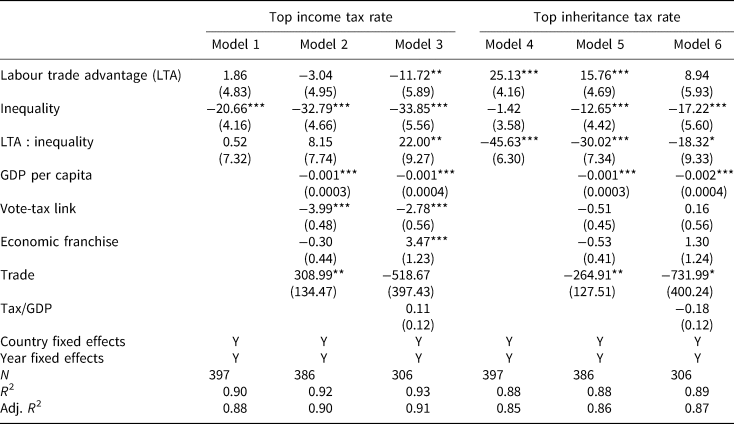
Table 2 shows the results for top tax rates. Data on the top rate of income and inheritance taxation, respectively, come from Scheve and Stasavage (Reference Scheve and Stasavage2016).Footnote 10
The determinants of top direct tax rates, 1870–1913
***p < 0.01; **p < 0.05; *p < 0.1.
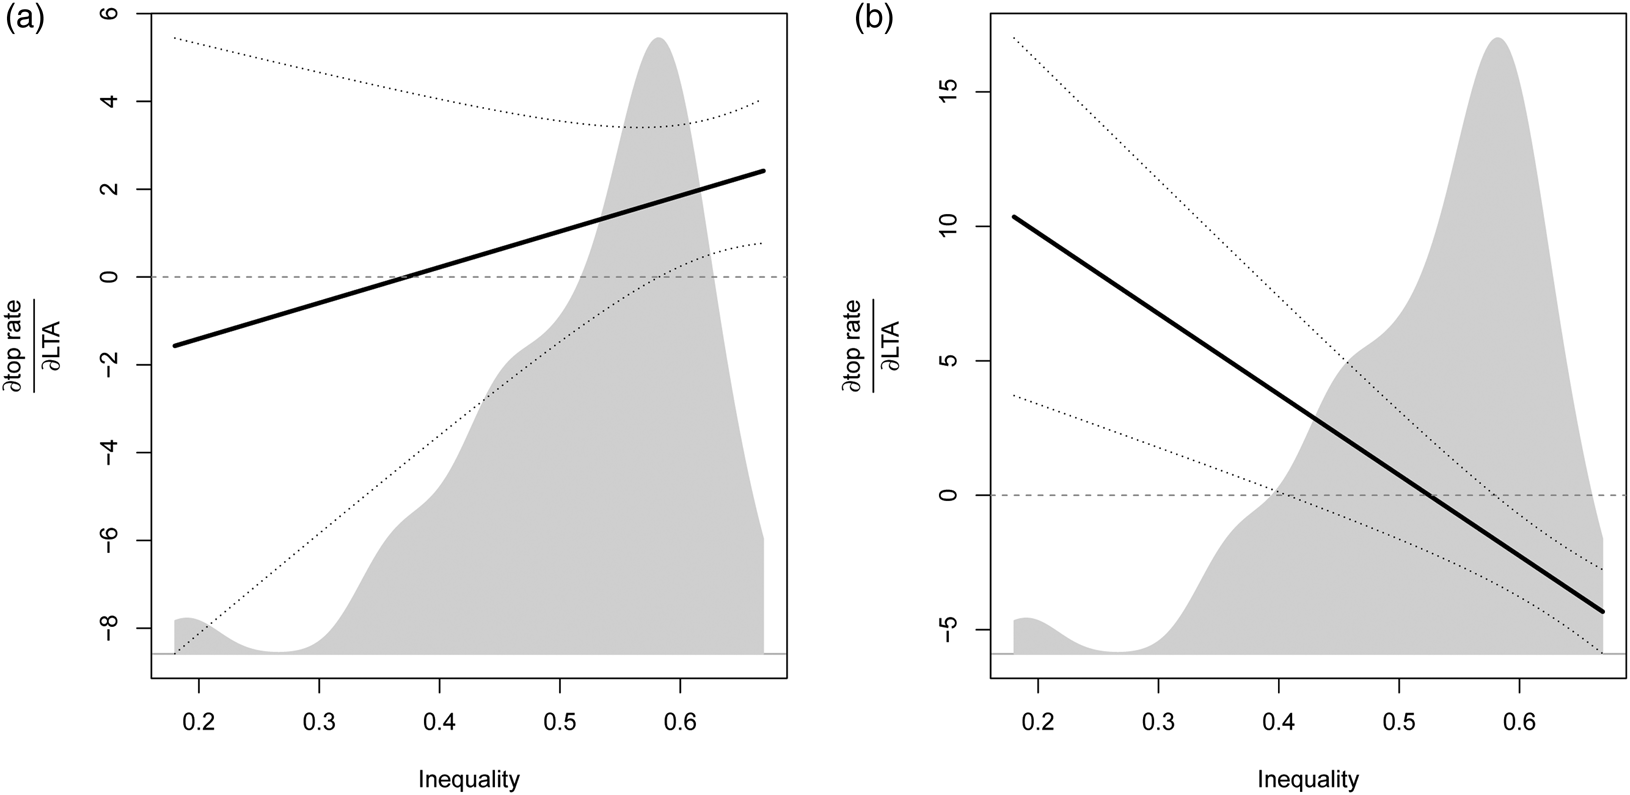
Figure 4 shows the marginal effects of labor's trade advantage at different levels of inequality.
The marginal effects of labor's trade advantage on (a) top income tax rates and (b) top inheritance tax rates at varying levels of inequality. Estimates from Table 2.

These results are more mixed. For income tax rates, inequality itself is negatively associated with top tax rates (in models without the interaction, both inequality and trade advantage are statistically significant, and signed as predicted by the theory), but the estimated interaction effect is “wrongly” signed (though not statistically significant). Figure 4(a) clarifies that only at high levels of inequality is a labor trade advantage associated with higher top rates, at odds with both the theory and the previous empirical results.
On the other hand, the results for top inheritance tax rates mirror those for the revenue shares (Figure 4(b)). At low levels of inequality, an improvement in labor's strategic position on trade increases the top inheritance tax rate. At the 25th percentile on inequality, a one-point change in trade advantage is associated with inheritance tax rates 2.65 points higher—which is almost exactly one standard deviation of that outcome.
Overall, the data from ten countries between 1870 and 1913 are broadly consistent with the idea that trade politics in the period shaped the politics of progressive taxation. The one exception is top rates of income taxation, where the critical interaction term is wrongly signed. Explaining this discrepant outcome is beyond the scope of this paper, but highlights the importance of considering outcomes beyond income taxation (Barnes, Reference Barnes2018).
3. Coalition, compromise, and taxation in Britain
As presented, the model illustrated elite incentives to include labor more fully in political coalitions. Alternatively, the price of labor support on trade could be pre-emptive progressive policy concessions. I explore these mechanisms through an analysis of Britain between 1903 and 1910. Edwardian Britain includes examples of both types of compromise. First, the Gladstone–Macdonald pact between Labour and the Liberals enabled labor candidates to run for election unopposed by Liberal party candidates in 1906. Second, in 1909 the Liberal government passed a sweeping progressive reform to taxation, in the form of the “People's Budget”.
Both pact and budget were national-level phenomena, but in each case, there is variation at the sub-national level: individual Liberal associations, and their preferred candidates, could resist the national pact; individual MPs could vote against the passage of the budget legislation in 1909. This sub-national variation allows us to consider the impact of trade interests. Local (constituency level) trade positions affect these outcomes, with concessions to progressivity more likely where the middle class shared trade (free trade) interests with Labour.
3.1. Case selection
What kind of evidence does the British case provide? The idea is not to make claims of representativeness and generalizability from the case study, but to check that the proposed mechanism can be found somewhere. This drives case selection on the basis that “one should first examine cases where we expect to see [the proposed mechanism] in action” (Goertz, Reference Goertz2017, p. 13).
Britain by 1903 is a most-likely case for the coalition mechanisms for two reasons. Economic inequality was relatively low, so is in the area of the “inequality space” where trade preferences should matter. By 1903, only Norway is measured as more equal using the rural inequality measure from the comparative analyses. Second, the issue of trade politics became highly divisive among elite politicians once Joseph Chamberlain launched his campaign for Tariff Reform.
Useful variation in local interests and behavior also recommends the British case. Political constituencies were deliberately varied in their economic and social characteristics, thanks to the 1885 Redistribution Act (Pelling, Reference Pelling1967, p. 3), creating identifying variation on trade interests. The decentralization of the Edwardian Liberal party, with national candidates selected by constituency associations, makes variation in local preferences relevant in national votes. Finally, there is recorded variation in two kinds of outcome: the ease of labor's run in the 1906 election, and voting on a progressive piece of tax legislation.
3.2. Trade, alliances, and redistribution in Edwardian Britain
The national-level evolution of trade, alliances, and progressive tax policy in Britain provides prima facie evidence of the mechanisms in question, and gives some context for the sub-national comparisons which follow. It is important to note that despite Britain's free trade history, a return to protection was a real possibility in the 1900s. Free trade was preserved, but not without “immanent threat” at the turn of the century (Howe, Reference Howe1997, p. 231).
Britain entered the 20th century with a Conservative–Unionist government with a large majority. But the government was fragmented, incorporating all factions of British politics opposed to Irish Home Rule. In 1903, Joseph Chamberlain, Secretary of State for the Colonies, introduced a proposal for Tariff Reform. Chamberlain advocated tariffs on imported goods to protect industry, raise revenue, and allow preferential terms for British colonies. The campaign re-mobilized the trade cleavage.
The possibility of protection was real. Britain is often seen as a bastion of free trade, but was not immune to the return of protectionist sentiment across Europe during the agricultural depression, nor in the renewed conflict after 1903. “Chamberlain's dramatic political initiative [Tariff Reform]… put Free Trade firmly ‘in the dock’ ” (Gomes, Reference Gomes1990, p. 74), and propelled tariffs to the top of the agenda. Disagreement within the cabinet in 1903 raised the possibility of an election, inspiring panic among the free traders lest protection be endorsed at the polls. The threat was in fact averted, but was real. Compromise on progressivity may not have been needed to secure free trade in the 1900s, but in the face of these new pressures, the need for concessions to maintain it is highly plausible.
Liberal and Labour leaders agreed the Gladstone–Macdonald electoral pact in 1903 to ensure that Liberal and Labour Representation Committee (LRC) candidates would not split the anti-Conservative vote. When the election came in 1906, this meant the deliberate withdrawal of Liberals in certain constituencies, to give Labour a free run. The LRC ran 50 candidates, 32 of whom ran with limited Liberal opposition (Bealey and Pelling, Reference Bealey and Pelling1958, p. 258). The removal of Liberals from electoral contests seems to have been motivated by fear of protectionist Conservative victory—as the theory implies. But the nationally-negotiated Gladstone–Macdonald pact was not uniformly easily implemented. Some local Liberal associations baulked at allowing redistributive candidates a free run. In the subsequent analysis, I examine whether trade interests at the local level explain where Liberals were more willing to make this concession.
Once in office, the Liberals also moved policy toward redistribution. The People's Budget was introduced to the parliament in April 1909 to “wage implacable warfare on poverty and squalidness” (quoted in Murray, Reference Murray1973, p. 172). Its major changes were to the taxation of income. Top rates were increased by the differentiation of earned and unearned income, by increased graduation within those schedules, and by the imposition of a super-tax. Those with incomes of over $\pounds 5000$ , previously taxed at the rate of 1 s, would become liable to a rate of 1s2d on their entire income, plus a supertax of 6d on income in excess of $\pounds 3000$
 . The budget also incorporated provisions for the taxation of land, although its subsequent implementation failed (Daunton, Reference Daunton2001, Table 11.1, p. 361). It was a deliberately progressive reform, and understood to be so. Members of the parliament knew that they were voting for, or against, progressivity. Moreover, the People's Budget did not include any directly trade-relevant changes. It incorporated changes to the taxation of alcohol, increasing domestic excises, but nothing that would lead us to expect greater support from free trade supporters.
Thus we can take two questions to the British data. First, did constituency trade orientations affect the way in which the Gladstone–Macdonald pact was implemented locally? Second, were free trade constituency MPs more likely to vote for the People's Budget?
3.3. Operationalization: constituency trade interests
The main challenge in this analysis is the measurement of trade preferences (and other variables) at the local level. Generating constituency-level measures directly from census data is impossible: parliamentary boundaries in Britain do not overlap with the census boundaries.Footnote 11. I proceed instead by quantifying secondary material. I rely on the well-developed historical study of British electoral geography and create a dataset from the canonical treatment of the period, Henry Pelling's Social Geography of British Elections, 1885–1910 (Pelling, Reference Pelling1967).Footnote 12
Social Geography was published in 1967, and provides a constituency-by-constituency account of late Victorian and Edwardian Britain. Pelling's focus is the geography of parties' electoral success. He links electoral outcomes to constituency characteristics drawn from primary (census) and secondary (county gazette, geographic books, and essays) sources, and uses parliamentary papers and national and local press to identify major political issues within each constituency.
I create an index of trade interests from these constituency descriptions. It has three levels: − 1 if the area is in favor of protection; 0 if trade is not mentioned, or the area is characterized as neutral; and 1 if Pelling reports support for free trade. For example, the description “[t]he other objection to the Liberals was that they were always hostile to Tariff Reform, which was a continuously live issue in Sheffield throughout this period” (p. 232) yields a protectionist coding. In contrast, Manchester North-West earns a free trade coding on the basis that “a predominantly Conservative middle class had been forced to change its allegiance [to the Liberals] by the Tariff Reform question” (p. 243).
I also use Pelling to code three other variables: the level of industrialization; socioeconomic level; and an indicator of military interests which captures the presence of barracks, navy shipyards, or industries reliant on military contracts. The first two factors track local payoffs to redistribution itself. I measure military presence given the link between Tariff Reform and Imperial (and thereby military) interests (Daunton, Reference Daunton2001, p. 314).
3.4. Analysis: coalition
The first set of outcomes to consider is the local implementation of strategic coordination in the 1906 election. I measure the outcome variable using data from Kollman et al. (Reference Kollman, Hicken, Caramani, Backer and Lublin2016). It takes three levels: no labor candidate; labor candidates running, but opposed by Liberals; and finally the easiest situation for those with redistributive preferences, where labor candidates run unopposed. I count as “labor” LRC candidates and “Lib-Labs”: trade unionist Liberals.
The three-level outcome calls for an ordered specification: I implement logit models. Along with the trade interest variable, I include the constituency level of industrialization and socioeconomic status, distinguish boroughs from counties, and include an indicator for double-member districts. Ceding one seat to labor was more likely where Liberals could nevertheless contest the constituency. Since the electoral pact did not apply north of the border, I include an indicator for Scotland.
Finally, I capture the political status quo at the previous election.Footnote 13 I differentiate seats contested by both Liberals and Conservatives in 1900 from those in which one or both did not run. For contested constituencies, I include the Conservative vote share and its square. This is because where the Liberals were already weak, ceding “unwinnable” constituencies implies no real concession.
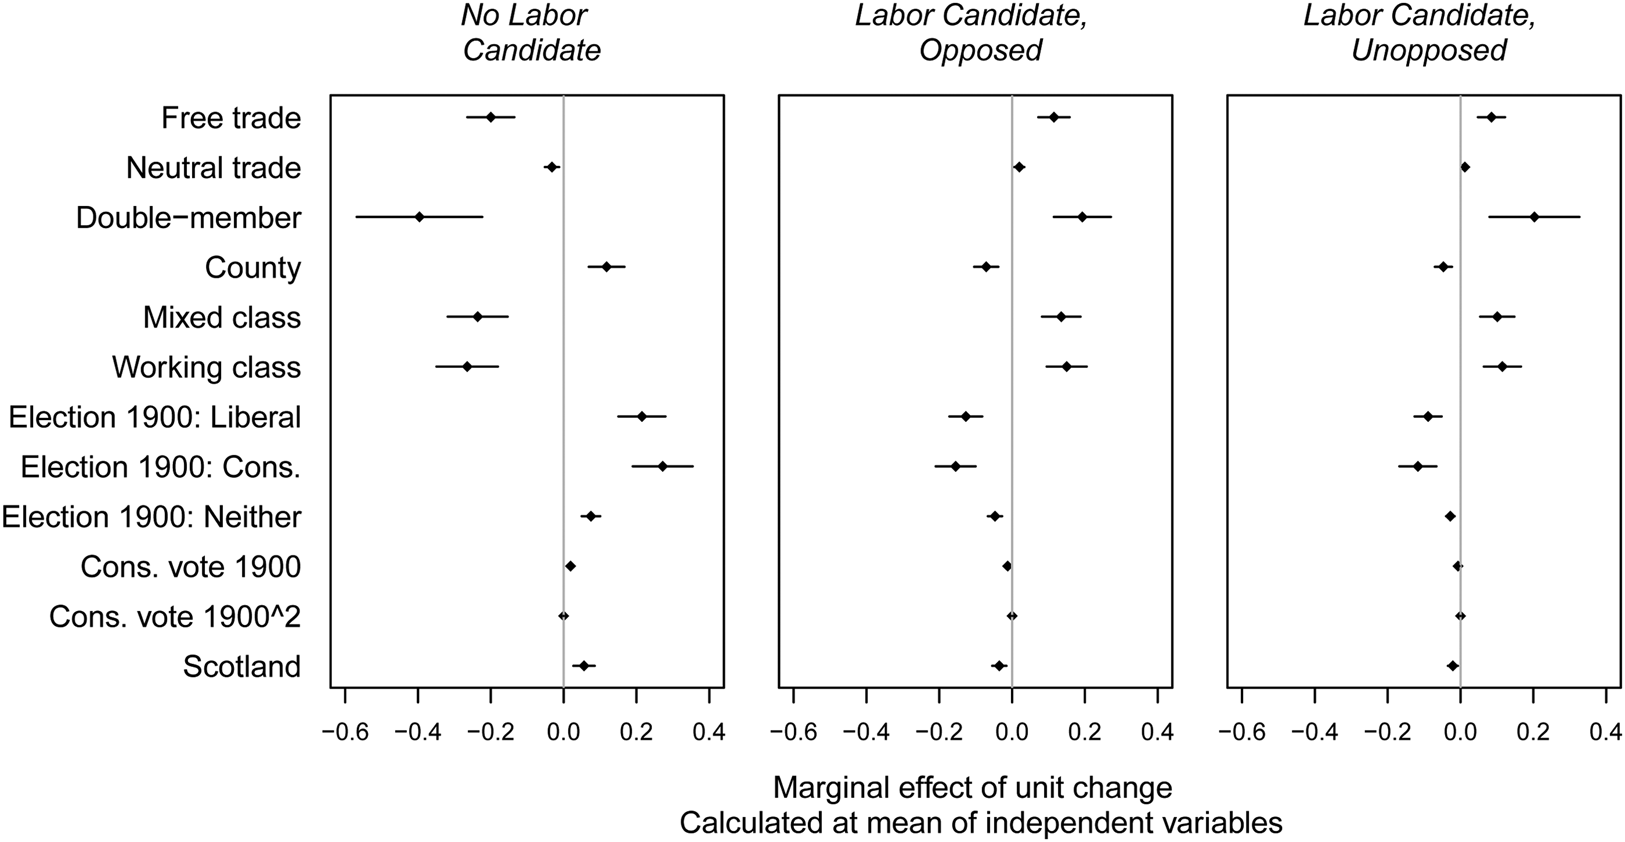
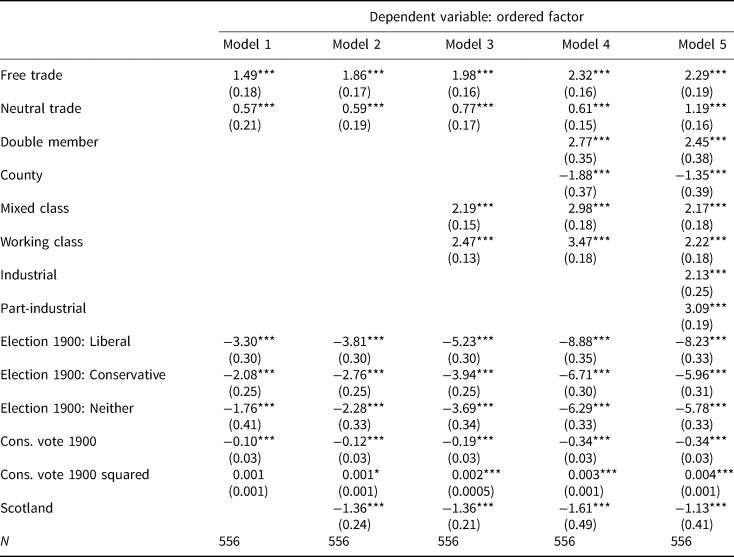
Figure 5 shows the results of this analysis in terms of marginal effects (coefficient estimates are in Table 3). The positive effect of the free trade indicator for unopposed labor candidates, compared to the (omitted) protectionist category, indicates that free trade interests translated to easier contests for labor candidates. The (approximately) two-point change on the linear predictor for free trade is slightly smaller than the effect of working-class constituencies in the figure, or a similar difference once the industrialization of the constituency is accounted for (model 5). This is a substantial effect.
Marginal effects on each level of how easy the Liberals made Labour's electoral situation in 1906. Estimates based on model 4, Table 3.

Ease of labor election in 1906. Model 4 provides estimates for Figure 5

Variables beginning “Election” indicate constituencies contested by only one, or neither, of the major parties—the omitted category contains Lib-Con contested constituencies.
***p < 0.01; **p < 0.05; *p < 0.1.
3.5. Analysis: policy
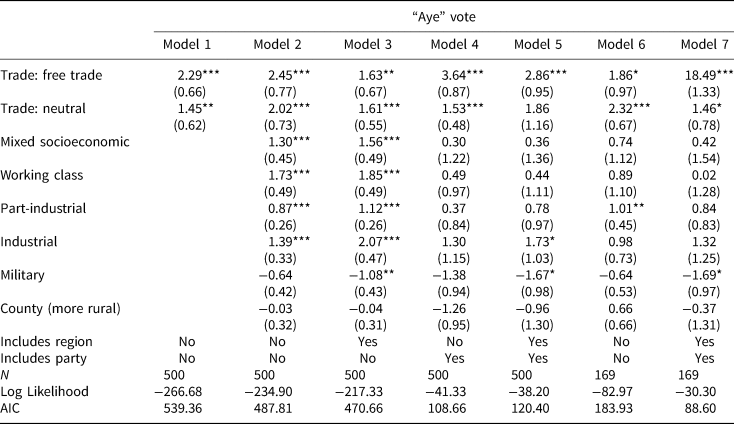
As described above, the “People's Budget” 1909 Finance Bill was a major progressive tax reform. I examine the final vote (“division”) on the bill in the House of Commons. In British parliamentary proceedings, bills are passed in the Commons upon their third reading. This had been proposed by the Chancellor of the Exchequer, but faced an amendment to delay for three months. The division was taken on rejecting this amendment.Footnote 14 I use binary logistic models of each MP's vote. Excluding Irish and university constituencies and the City of London (which Pelling's discussion omits) yields 500 observations.Footnote 15
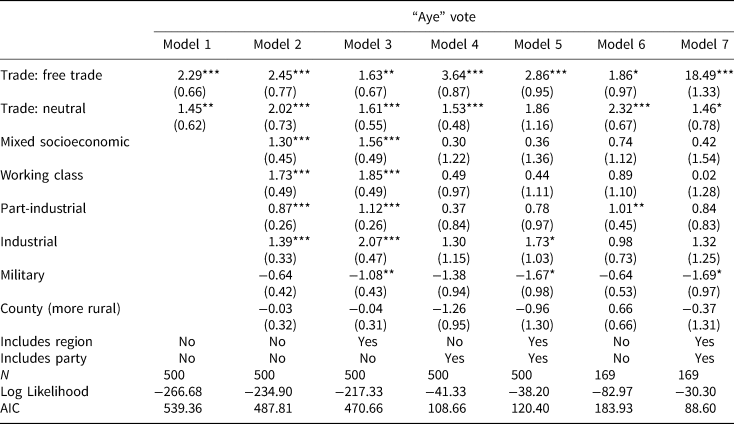
The estimated impact of trade interests (and other factors) on the Finance Bill votes, and their associated uncertainty, are displayed in Table 4. The data show that trade interests indeed mattered. The top two rows show the coefficients associated with neutral or free trade seats. Both types are statistically significantly more likely to support the budget measure than the (omitted) protectionist category.
Determinants of MPs' votes on the Third Reading of the 1909 Finance Bill
***p < 0.01; **p < 0.05; *p < 0.1.
Standard errors clustered by constituency type.
Omitted categories are: protectionist trade, upper class socio-eonomic, non-industrial.
“Split delegation” models include only MPs from parties and regions which included both “aye” and “no” votes.
Model 1, with no additional covariates, shows that the predicted pattern holds in the raw data. But the theoretical claim is that trade interests should matter for progressive taxation independent of other sources of support for redistribution. Models 2–5 incorporate the controls for direct interests in redistribution through the industrialization, county/borough, and socioeconomic status measures; and the control for military presence. To these I also add controls for region (model 3) or party (model 4) or both (model 5). Models 6 and 7 replicate models 3 and 5 using only those MPs in regions and parties where there is within-region, within-party variation in the outcome.
What is striking about Table 4 is not that the impact of trade interests is statistically significant, but that the effects are large. The conditional difference between a free trade and tariff reform constituency is of roughly equal size to the difference between a predominantly working class and predominantly middle class constituency.Footnote 16
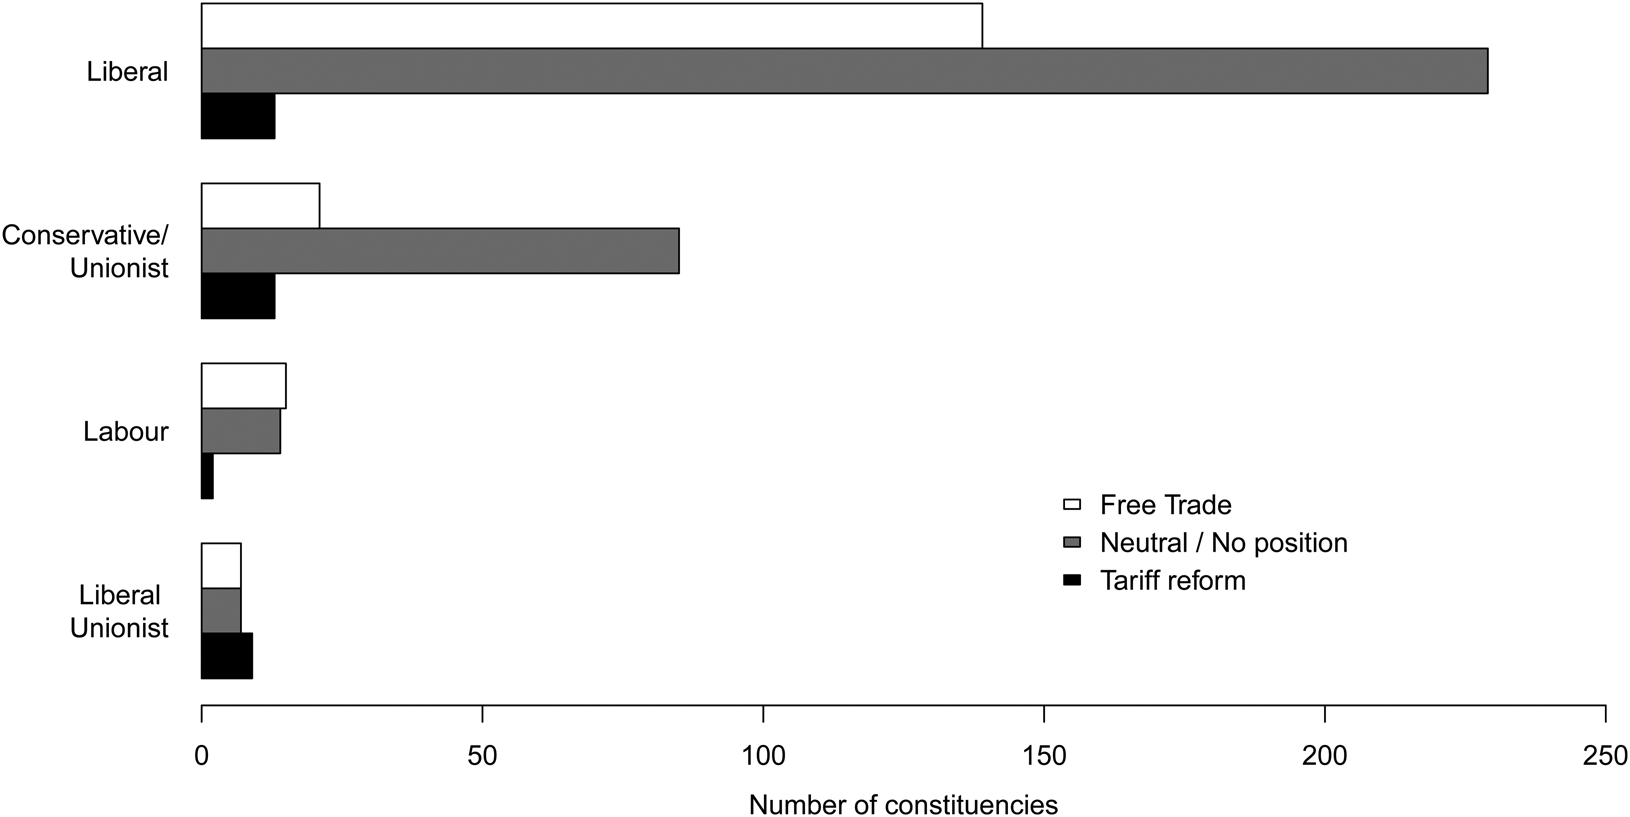
Models 4 and 5 warrant further discussion. These models include each MP's party as a covariate—model 4 dropping the region variable, and 5 including both. Political parties were becoming increasingly disciplined by the time of this vote, and the budget was a Liberal proposal. Given the importance of trade as an electoral issue, we might be concerned that trade interests are translated completely into partisan differences, making their effects impossible to differentiate from any broader differences between parties. Figure 6 indicates that while free trade constituencies were more likely to be held by Liberals, a good number of MPs in 1909 represented areas whose trade interests diverge from their party's position. These include 13 Liberal constituencies with protectionist positions (as many as there are protectionist Conservative constituencies), and 21 free trade Conservative constituencies.
The distribution of constituencies by constituency-type trade interests and party, 1909. Source: Author's calculations based on Pelling (Reference Pelling1967).

Second, it is unclear whether we should be interested in the effect of trade positions independent of party. Again this is an issue of post-treatment bias. While an MP's party should affect his vote, we are trying to isolate the difference between free trade, neutral, and protectionist constituencies. The party affiliation of the MP selected for a given seat is causally subsequent to this difference: Liberal MPs are elected because an area favors trade. Thus while I include these models with the party for completeness, I think models 3 and 6 are more useful estimates of the impact of trade interests.
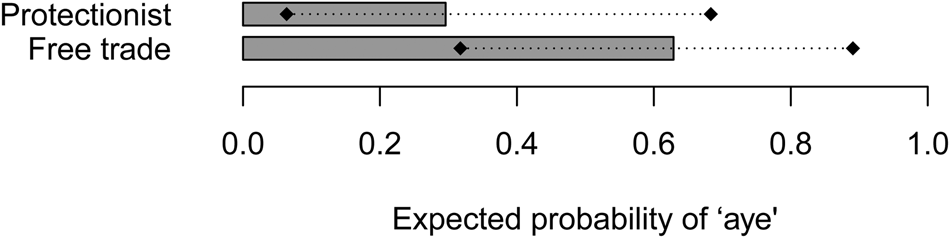
To interpret the size of these effects, Figure 7 shows the expected probabilities of an “aye” vote for a protectionist constituency, and for a free trade seat (from model 3). For a predominantly middle class, non-industrial borough in the central region, with no notable military presence, an MP from a protectionist constituency has only a 28 percent chance of supporting the bill; if his constituency is in favor of free trade, this probability is 63 percent.
Expected probability of MPs voting “aye” on the Third Reading of the 1909 Finance Bill. Generated from model 3, Table 4. Other constituency covariates set to: central region; predominantly upper/middle class; non-industrial; borough.

At the local level, greater elite concern about free trade is associated with redistributive concessions, both policy and political. The data from Britain are consistent with the theoretical mechanism of coalition and compromise. This same logic underpins the interaction between inequality and trade proximity in the cross-national data. The empirical record indicates an important role for trade politics in the emergence of progressive taxation in Europe.
4. Conclusions: trade matters
The core question here is why some countries had more progressive taxation than others, at the origin of modern taxation. Part of the answer is that the politics of trade led to differences in elite concessions on redistribution. Evidence from comparisons across European countries indicates that the relative trade positions of different groups were systematically associated with different tax outcomes, while in the case of Britain, political compromises and policy concessions were also more likely to be made precisely by those elites who shared trade interests with low-income groups. These findings have important implications beyond the limited western European, turn of the 20th century context.
First, while the empirical analysis here is limited to western Europe, the influence of trade politics on progressivity applies more broadly. The importance of trade has long been noted in histories of American tax policy (Mehrotra, Reference Mehrotra2004), where free trade and progressive taxation were closely linked. Southern, landed desires for free trade could only prevail in alliance with progressive demands on tax. The elites who favored compromise in the US were different—land rather than capital owners—but the influence of trade politics on progressive taxation is similarly clear.
This importance of two-dimensional political coalitions is not limited to trade politics: ethnic and religious divisions have been argued to reduce redistribution in explanations of why the poor do not expropriate the rich. However, the argument made here is novel for two reasons. First, in terms of empirical history, despite the importance of trade, scholars have not yet taken this second political dimension seriously in the analysis of progressive tax reforms. Second, and of more general theoretical importance, trade politics in the liberal era worked in favor of progressive policy, not against it. This insight is an important one for scholars of redistribution in other contexts: where there are multiple dimensions of political competition, redistribution can be “too high” as well as “too low”, compared to the unidimensional outcome. “Distracting” people from their purely distributive interests can be a successful strategy for left or right, depending on the distribution of preferences on the dimension that is mobilized.
Supplementary Material
The supplementary material for this article can be found at https://doi.org/10.1017/psrm.2019.39
Acknowledgments
I thank Ben Ansell, Peter A. Hall, Iain McLean, Lucas Leemann, Ajay Mehrotra, Ed Morgan-Jones, and Anne Wren for useful feedback. All remaining errors are my own.