




No CrossRef data available.
Policy Punctuations in American Political Institutions
Published online by Cambridge University Press: 12 March 2003
Abstract
Political institutions translate inputs—in the form of changed preferences, new participants, new information, or sudden attention to previously available information—into policy outputs. In the process they impose costs on this translation, and these costs increase institutional friction. We argue that the “friction” in political institutions leads not to consistent “gridlock” but to long periods of stasis interspersed with dramatic policy punctuations. As political institutions add costs to the translation of inputs into outputs, institutional friction will increase, and outputs from the process will become increasingly punctuated overall. We use a stochastic process approach to compare the extent of punctuations among 15 data sets that assess change in U.S. government budgets, in a variety of aspects of the public policy process, in election results, and in stock market returns in the United States. We find that all of these distributions display positive kurtosis—tall central peaks (representing considerable stability) and heavy tails (reflecting the punctuations, both positive and negative). When we order institutions according to the costs they impose on collective action, those with higher decision and transaction costs generate more positive kurtosis. Direct parameter estimates indicate that all distributions except budget data were best fit by the double-exponential probability distribution; budgets are Paretian.This project was funded by the Political Science Program of the National Science Foundation, Award SES9904700. We appreciate the support of Frank Scioli, the program officer, and various political science program directors. We benefited from comments by Frank Baumgartner, John Brehm, Chris Mackie, Peter John, John Padgett, Bat Sparrow, Jim True and John Wilkerson.
Information
- Type
- Research Article
- Information
- Copyright
- © 2003 by the American Political Science Association
On August 28, 1950, President Truman enthusiastically signed Social Security reforms he had urged for years, reforms that expanded Old Age and Survivors Insurance (OASI) benefits by 77%, expanded the covered population dramatically, and decreased the required contributions in the system. The result was a transformation in the program from a small system covering only 6% of the elderly in 1940 into a program “firmly established as part of American public policy” (Sparrow 1996, 34).1
This account relies heavily on Sparrow 1996 and True 1999.
The 1950 legislation radically transformed the small program established in major amendments to the Social Security Act in 1939. The 1950 statutory changes caused an explosion in Social Security expenditures. From FY (fiscal year) 1949 to FY 1950, real expenditures grew 3%. From FY 1950 to FY 1951, they grew 25%, and the next fiscal year they grew 37%—the largest two-year percentage increase in the history of the program—even though most payments would come much later as the newly covered retired. By 1952, expenditures had increased by an astounding 71%, and expenditures increased 10% a year or more for the next three fiscal years (True 1999).
Between these two landmarks, Congress enacted only two very minor adjustments to the program. This almost-complete absence of legislative output was not for lack of trying. Presidents Roosevelt and Truman urged change; major advisory commission reports indicated the desirability of reform, many bills were introduced, and both House and Senate committees held hearings and reported legislation. Sporadic, but vocal and persistent, calls for reform emerged immediately after the 1939 enactments and continued until 1950.
Moreover, there were good objective reasons for action. Sparrow (1996, 39) calls the failure to enact reform “puzzling” and points out that “a further expansion in the Social Security system would have guaranteed a large net increase in federal revenues, since most of the government's obligations would not be incurred until contributors retired. In the meantime, the government would receive desperately needed funds and would ease inflationary pressures by limiting consumer spending.” In other words, a “window of opportunity” existed; the issue occupied the national agenda before, after, and during the war, and great effort was expended in proposals, bill writing, and hearings, yet Congress, nevertheless, failed to pass legislation. When Congress finally acted, the result was not incremental adjustment, but major policy reform.
In democracies at least, it is easier to talk about an issue than to get serious action on it. In the United States, executive support or even support of legislative leaders may not ensure passage of a popular act; the system requires concurrent majority support in both houses of the legislature in addition to the President's acquiescence. In the case of Social Security, Republicans posed important counterarguments to Social Security expansion based on wartime revenue need—a kind of “lockbox” argument mimicked 60 years later. Airing of arguments takes time; opposition to change can be entrenched, and even extraordinarily good ideas can be thwarted for a long time.
The general lesson is that policymaking institutions are “sticky”—they do not respond simply or directly to demands or needs. Social, economic, and political changes are not automatically registered in public policies in democratic systems. Moreover, agenda access itself may also exhibit “stickiness,” albeit on a less dramatic scale. The agenda space is severely limited, and many issues can compete for the attention of policymakers. In the case of Social Security, during the “missing decade” (Sparrow's term) many bills were introduced in some years (54 in 1941), while very few were introduced in others (17 in 1943) (Sparrow 1996, 60). Executive and legislative attentiveness shifted from intense to absent during the long period of policy inactivity as other matters clamored for governmental attention.
Political institutions impose costs on policy action in direct proportion to how far a policy proposal has proceeded in the lawmaking process. It is easier to get an issue discussed than it is to get serious attention for a specific line of policy action; it is easier to get a hearing on a bill than to schedule it for a vote; it is easier to get one house of Congress to pass a bill than to get it enacted. These institutional costs act in a peculiar way. They keep the course of public policy steady and unvarying in the face of lots of changes; that is, they do not allow for continuous adjustment to the environment. Early decision theorists termed this pattern “incremental.” But these costs also cause major policy changes when dynamics are favorable—a “window of opportunity” opens, in the language of Kingdon (1995). These major policy shifts against an incremental backdrop are termed policy punctuations (Baumgartner and Jones 1993; True et al. 1999).
In this paper we examine this institutional friction in a more general framework than has normally been the case. We may think of policy processing within an institutional framework somewhat analogous to the geophysicists' plate tectonics. The earth's crust is divided into major segments, or plates, that slide against one another. Plate tectonics explains continental drift; it also accounts for earthquakes.
If we order observed earthquakes from the smallest to the largest, we will observe many, many, very small earthquakes (the incremental) and a number of very large ones (the punctuations) but very few moderate quakes proportionately. The earth's surface plates slide against one another, driven by powerful forces in the earth's core (the “inputs”). Even in the face of powerful dynamics, however, much of the time plate friction holds them together, allowing small magnitude quakes to release some of the pressure. But as time progresses, and the pressure builds, at some point a potentially disastrous “jump” must occur, bypassing a more moderate response to the pressure and resulting in the large magnitude quake. The inputs of plate pressure are not directly translated into “outputs” of earthquakes.
The Social Security story parallels this description of plate tectonics. During the 1940s focused demands resulted in minor adjustments to the 1939 basic statutory structure—minor incremental adjustments.2
Seamen affiliated with the War Shipping Administration were added to the system in 1943 and survivors of veterans killed in the war were added as beneficiaries in 1946 (Sparrow 1996, 36).
Geophysicists do not observe the friction of plates directly. Instead, they measure the outputs from the process (the earthquakes) and study their frequency distribution. We are in a similar position, but with one important advantage. It is relatively easy to order political institutions according to the extent to which they impose decision costs on policymaking activity. To the extent that a political institution adds decision costs to collective action, the outputs from that institution will exhibit periods of stability (“gridlock”) interspersed with periods of rapid change. The higher the decision costs that must be overcome to achieve a collective goal, the more punctuated the outputs are likely to be.
Here we examine distributions of change in a number of key American political institutions, under the thesis that the more friction that an institution or social process adds to a collective decision-making situation, the more punctuated will be the outcomes produced. Our primary focus is the policymaking process. We study the nature of change in agenda setting (Congressional hearings, New York Times, and Congressional Quarterly [CQ] coverage), lawmaking (statutes enacted and Presidential executive orders issued), and budgetary commitments. In addition, we study U.S. elections (Presidential, Congressional, and Senatorial) and, for comparative purposes, the U.S. stock market. Some idea of the magnitude of this task is suggested by the fact that the total number of observations upon which these distributions are based sum to 305,486.
The key question is how people interacting in political institutions process and respond to signals from the environment. If institutions add friction to informational inputs, then outputs will not be directly related to inputs. But how will inputs and outputs differ in policymaking systems? We posit that whatever the input flow, the output flow will be both more stable (ignoring many important signals) and more punctuated (reacting strongly to some signals). Institutional analyses show that a “policy core” exists that is not responsive to changes in preferences (for example, through replacement of legislators in elections), but when preferences change enough to move the pivotal legislator's preferences outside the core, then major punctuations in policy can occur (Hammond and Miller 1987; Krehbiel 1998). Policy process scholars have argued that policy agendas change when attentiveness and mobilization are directed at particular aspects of a complex environment, raising the probability of major policy innovations based on new ideas. Again, stability (when attention is not directed at the issue) and punctuation (when it is) occur in a single process (Baumgartner and Jones 1993). Similarly, in elections, first past the post voting systems and partisan identifications by voters operate together to add great stability to election patterns, which are, nevertheless, occasionally disrupted by realignments.
STOCHASTIC PROCESSES AND PUNCTUATED CHANGE
The methods we use to study the general properties of policy change are stochastic process approaches. In stochastic process models, randomness is fundamental to the model rather than assuming the position of an “error term” in a model that otherwise would exactly predict particular outcomes. Stochastic process models try to ascertain what kinds of probability distributions could have accounted for an observed frequency distribution of outcomes. They are most useful when the exact specification of a model is not possible, either because of the essential complexity and uncertainty or because of the current state of scientific knowledge. While political scientists have tended to gravitate more to point prediction models and regression studies, stochastic process approaches have become increasingly popular in the natural and biological sciences. A major reason is the recognition of the key importance of extreme values in the determination of the time paths of complex systems (Sornette 2000). The more traditional regression studies often relegate these critical values to the error structure of “unexplained variance.”
There is stochastic process work in political science, however. For the purposes of this paper, the most important studies are the budgetary studies by John Padgett (1980, 1981). Padgett derives and then estimates empirically the probability distributions associated with boundedly rational budgetary decision-making, showing that traditional incremental approaches will yield a normal distribution but that a sequential search model in which actors serially search for options (such as bigger and bigger budget cuts) until one satisfies the constraints they face will yield a double or two-sided Paretian distribution (because decision-makers can enjoy growth as well as suffer cuts). Also called the power distribution, it is characterized by a slender peak and heavy tails; it is the most famous of the punctuated distributions in science (Bak 1997; Mandelbrot 1997, 1999).
An idea of how frequency distributions can be used to study punctuated change is illustrated in Figure 1. There we plot the frequency distribution of inflation-adjusted annual percentage changes in U.S. Congressional Budget Authority from FY 1947 through FY 2000, pooled across Office of Management and Budget (OMB) subfunctions (Jones, Baumgartner, and True 1996).3
Political scientists are in the unfortunate situation of lacking both a comparative unit of measurement for policy change and time series long enough to focus only on changes in a single policy. As a consequence, we are forced to rely on percentage changes to achieve the necessary aggregation across policy content categories.

The clear pattern of stability coexisting with punctuations is striking. We have noted the Social Security expenditure changes discussed above in Figure 1 as an illustration of the pattern. The empirical distribution exhibits great stability around the mean; most changes are very small indeed. But the distribution also exhibits the signature “heavy tails” pattern: There are a considerable number of cases that are very far from the mean, indicating very large annual changes. As might be expected, there are more large budget increases than decreases—note the extraordinarily large positive tail. Most of the quantitative changes in the time series underlying the data come not from the incremental changes but from the extreme values.4
We assess the extensiveness of punctuations by the occurrences of “extreme values.” This is not strictly correct, because there could exist a pattern of extreme values that are temporally contiguous, suggesting large-scale instability rather than intermittent punctuations. Inspection of our data distributions suggests that this kind of instability is not common, but we cannot do here the case studies of the distributions necessary for a more complete analysis. The statistical study of extreme values now has a robust intellectual history (Kotz and Nadarajah 2000).
Frequency distributions with this general shape are characterized as having positive kurtosis. Kurtosis is defined statistically as the fourth moment around the mean; the variance and skew are the second and third moments. A unit-free measure of kurtosis somewhat analogous to the coefficient of variation measure of variance (the standard deviation divided by the mean) was developed by Karl Pearson; it is the raw fourth moment divided by the square of the variance (Anscombe and Glynn 1983).5
, where μ is the mean.
This standardized kurtosis has a value of three for the normal distribution; distributions with positive kurtosis (termed leptokurtosis) tend to have slender peaks and heavy tails as in Figure 1. Focusing on kurtosis offers a way of directly comparing the distributions we study, but in practice it encounters some difficulties in interpretation and application. As a consequence, we first examine kurtosis tests and then move to more accurate direct parameter estimates of the underlying probability distributions that are hypothesized to underlie the frequency distributions we study.6
Moreover, the dynamics of peaks (stability) and tails can differ, stochastically, theoretically, and empirically. It is not currently clear how kurtosis, which attempts to assess both within a summary measure, is affected in such circumstances. Direct parameter estimates can aid us in detecting differences in the dynamics associated with tail and peak.
COSTS IN POLITICAL INSTITUTIONS
An institution may be defined as a set of individuals acting according to common rules resulting in collective outcomes. Institutional rules are not neutral, in the sense that different rules often lead to different outcomes (Jackson 1990, 2). These aggregations of individuals interacting according to rules react to information from the environment and come to a collective response (even if the collective response is simply the sum of individual actions, as it is for markets and elections and roll-call voting in legislatures).
Decision-making systems impose four kinds of costs in making decisions in response to a changing environment: decision costs, transaction costs, information costs, and cognitive costs. Decision costs are costs that actors trying to come to agreement incur. They include bargaining costs and institutionally imposed costs, such as those built into a separation of powers governing arrangement (Bish 1973; Buchanan and Tullock 1962). Transaction costs are costs that parties incur after they come to agreement (North 1990). In market transactions, these involve such items as the cost of ensuring compliance to contractual agreements and other payments to third parties to complete the transaction. It ought to be clear that in advanced democracies decision costs in the policymaking process heavily outweigh transaction costs. The costs of bringing relevant parties to agreement in a system of separated powers (decision costs) generally outweigh the costs of holding hearings, enacting statutes, or changing budgetary allocations once agreement has been reached (transaction costs). In any case, we combine these costs in our analysis, terming them together “decision costs.”
Information costs are search costs—costs of obtaining information relevant to making a decision. These are costs that exist when a person (or an organization) wants to make a decision. Cognitive costs are costs associated with the limited processing capacity of any social institution comprised of human beings. These are costs that occur because people do not know they need to make a decision. If one is not attending to a key component of the environment, then he or she cannot decide whether or not to incur search or information costs.
We posit here that these costs act similarly on the capacity of political institutions to process the flow of information. Institutional costs in politics may approximate the manner in which friction operates in physical models. When friction is introduced into idealized physical models, nonlinear systems result (Bak 1997). Such open systems result in an output pattern that is episodic and punctuated, with extraordinary difficulty in making point predictions. Earthquakes are an example. Predicting a particular earthquake is not currently possible, but the patterning of earthquakes follows a lawlike pattern—the power function of the Guttenberg–Richter law (Bak 1997; Rundle, Turcotte, and Klein 1996; Schroeder 1991; Sornette 2000; West and Deering 1995).
AGENDA-SETTING EFFECTS
A hypothetical fully efficient decision-making institution that imposed no costs would respond seamlessly to the world around it. That is, it would incorporate all relevant aspects of the information it encountered and would “use up” all the information in its decision-making process. The outputs of such a system would perfectly reflect the information flows coming from its environment (Simon 1996). The major example of such a cost-free system is the classical model of a competitive economy.
In such a pure system,

where
- R = response = ΔO = change in output,
- S = information (signal),
- β = benefits derived from the information flow (<1).
The system reacts directly to the input flow by changing its output. If costs are assumed to act linearly on the system, then

Our hypothetical system continues to respond directly to the input flow. Now, however, it will not act until it recovers the costs that must be invested in reacting to the flow of information.
In idealized frictionless systems, the output (decision) result is entirely a function of the information received. This is a standard against which other processes may be compared. In such a system, if the information flow were distributed in a normal or Gaussian fashion, then the output flow would be normal, as the normal distribution is invariant under a linear transformation. There is good reason to expect the Gaussian as an input distribution. If participants in an institution receive information from independent diverse streams and weight and sum these diverse streams in an index, then the resulting distribution would be normal by the central limit theorem, at least in the limit. This is an important standard, because in most situations we cannot observe the flow of information into a policymaking system with any precision. Without a complete model of the policy system, something we lack at present, there is no way of knowing which aspects of a complex situation will be judged relevant (of benefit).7
One response is to think of news coverage as an input variable and to try to relate policy outputs to “the news.” This is not an appropriate strategy, however, because media scholars have shown that in many cases the news responds to what policymakers are doing, and is subject to manipulation by them (Bennett 1990).
The input flow, however, may not be normal because whatever processes generate that flow do not approximate the central limit theorem.8
Three central limit theory assumptions can lead to difficulties. They are the independence assumption (which we discuss later in the paper), the assumption that a decision-maker does not rely too heavily on a single source, and the finite variance assumption (very extreme values can occur).
Let us now turn to less-than-perfect human systems. If individual decision-makers rely on a limited set of indicators to monitor their environments, and update them or include newly salient aspects of the environment in the decision-making calculus episodically, the result will be a flow of “news” (that is, the information flow to which the decision-maker attends) that is not normal (Jones 2001, chap. 7). This kind of decision-making underlies agenda-setting studies. In effect, the decision-maker locks choice into a set of facts based in the past and must update in a punctuated manner in the face of change that cannot be ignored. The “news” is leptokurtic. If the news is leptokurtic, outputs in completely efficient institutions will be leptokurtic. Since collective outputs from markets and elections are simple aggregates of individual decisions, outputs will follow news flows.
Institutional decision costs will add to the kurtosis of output distributions. Difficulty in changing the status quo results in incremental decision-making rather than reform. This shows up in output distributions as the tall central peak associated with leptokurtic distributions. When change occurs, it requires substantial mobilization to overcome the stasis associated with the workings of political institutions and the tendency of humans to adopt rules of action that are difficult to change. As a consequence, when change occurs, it tends to be relatively extreme. This results in the characteristic “heavy tails” and “weak shoulders” of leptokurtic distributions. This leads to our first key hypothesis.
H1: Output change distributions from human decision-making institutions will be characterized by positive kurtosis.
If our reasoning is correct, we expect always to find positive kurtosis in the outputs of human institutions—elections, lawmaking, budgeting, media coverage, scheduled hearings on bills, etc.
INSTITUTIONAL FRICTION
Some institutions impose higher decision and transaction costs than others. We hypothesize that the higher the institutional costs imposed, the more leptokurtic the output distribution.
There would exist considerable friction in policymaking systems even if they were informationally efficient, because American political institutions are not designed to be fully responsive. Existing formal studies of institutions are equilibrium based, and hence static, but they clearly imply that continuous preference changes would result in discontinuous policymaking processes (Hammond and Miller 1987; Krehbiel 1998). Generally the costs that have been studied are decision costs; transaction costs are relatively low in the U.S. lawmaking process. Aspects of the policy process, however, vary in their susceptibility to decision and transaction costs. For example, holding a hearing on a policy-relevant issue entails decision costs, but these are far less onerous than actually passing a law.
H2: The more friction an institution imposes, the more leptokurtic its output distribution will be.
We can study only a sampling of social processes that might be relevant to policymaking. Broadly speaking, in this paper we examine three classes of processes: the U.S. stock market (because of the long history of study in finance and economics of these processes); U.S. Presidential, Congressional, and Senatorial elections (because of their relevance to political choice); and selected aspects of the U.S. national-level public policymaking process (because they represent collective choice most directly).
Can we rank this diverse set of institutions in order of the costs they impose on collective decision-making? To do so we first have to assume that, in effect, cognitive costs are about the same in each institutional setting. Then we need to think through how each institutional setting would increase decision costs relative to a hypothetically fully efficient system (that is, one that translated informational inputs into institutional outputs directly and seamlessly).
We have already noted that modern stock and bond markets impose low transaction costs (and no decision costs). As a consequence, in the United States at least, they fairly closely approximate the fully efficient institutional mechanism.
Elections are more problematic. In the past, high transaction costs have been imposed on some voters: non-property holders, blacks, women. The 2000 Presidential election, as conducted in Florida, indicates that transaction costs may still be imposed on some groups, even though the systematic exclusion practiced in the past no longer exists. The long periods we use for elections in the United States make the changing nature of the cost structure problematic. In the modern era, however, transaction costs have been relatively low, and theories of electoral choice have emphasized cognitive friction (in the form of partisan identification and, more recently, heuristic reasoning) to the virtual exclusion of institutional costs. In any case, whatever transaction costs have been imposed in the past should be imposed similarly for the three kinds of elections we study, and they should differ among themselves only in cognitive stickiness. We hypothesize that Congressional elections, because of their low visibility, will be more subject to leptokurtosis than either Senatorial or Presidential elections and that Senatorial elections will be more leptokurtic than Presidential ones.
Now we turn to the policymaking distributions. Policy process scholars find it useful to divide the policymaking process into stages such that an issue must access one stage before moving to the next. For example, an issue must access the agenda before it is enacted into law, and it must be enacted before a budgetary allocation (deLeon 1999). The process looks roughly like this:

The distributions we study essentially monitor the process at the agenda-setting, enactment, and resource commitment stages. The existing literature indicates that institutional costs increase as a proposal moves through the policy stages. It clearly is more difficult to get a statute passed than to get a hearing scheduled on a proposal. These institutional difficulties reflect decision costs—the blocks to collective policy action on the parts of the legislative and executive branches. Policy-stage theory allows us to rank these distributions by the stages they assess, under the assumption that decision and transaction costs will be higher as we move through the policy cycle.
In sum, we rank the various social processes we study in terms of institutionally imposed costs (least to most) as follows.
- Markets. Pure markets have low transaction and decision costs; modern stock and bond markets come very close to this ideal. Information is freely available. (Appendix 2 details a smattering of the long history of the empirical study of financial markets.)
- Elections. Voting in modern times has low transaction and decision costs, but elections themselves differ in the extent to which they impose information costs. In Presidential elections, information is more available (but can cost cognitive resources in organizing it). Less information is available in most House races
- Policy processes. Policy-stage theory implies the following ranking, from the least to the most costly.
- a. News coverage. We assess the systemic agenda via general news coverage. Changing from one topic of coverage to another is not cost-free, but it is relatively easy compared to lawmaking.
- b. Congressional hearings. We assess the policy or governmental agenda through the scheduling of hearings. The topic of scrutiny must attract attention (a cognitive cost) and incur some institutional costs (the minority party cannot schedule hearings alone).
- c. Congressional quarterly coverage. The coverage of inside-the-beltway coverage of issues likely mimics the salience of issues on the governmental agenda. The specialized press has no independent agenda-setting power; rather it indexes the lawmaking activity of Congress.
- d. Executive orders. The president alone acts, but executive orders often have major policy impacts (Mayer 2001). Decision costs are high but are concentrated within a single branch of government.
- e. Statutes. Both houses of Congress and the President must cooperate in the lawmaking process; decision costs imposed by the structure are very high.
- f. Budgets. The literature indicates a complex interaction between cognitive and institutionally imposed costs. Institutionally, large changes are subject to the same dynamics as statutes. Cognitively, budget routines and operating procedures dominate the proceeding, and these tend to be highly resistant to change.
Aspects of this ranking may be debatable, but at least it provides a starting point for comparing the outputs of diverse institutional arrangements. In any case, it is clear that political institutions impose decision and transaction costs because of their deliberate design and operation and that this facet of political life can be examined empirically.
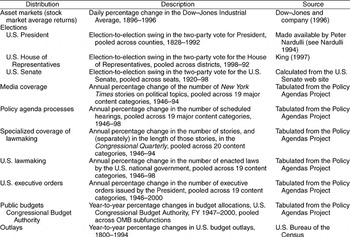
Table 1 indicates the nature and sources of the data we employ. We noted above that what we term cognitive costs interact with institutionally imposed costs, so that it is somewhat artificial to try to disentangle them. However, in cases where institutionally imposed costs are very low, leptokurtosis in output distributions very likely indicates that cognitive costs are operative. It is always possible, of course, that the distribution of information is leptokurtic in such circumstances, so in this case we rely on the argument above concerning implicit indicators. That implies that, in the limit at least, information is normally distributed, and hence deviations from normality in such institutions are due mostly to cognitive costs. Elections and asset markets (stock and bond markets) are both characterized by very low decision costs (generally the buyer or voter has control over the decision) and transaction costs.

FINDINGS
All of the distributions we studied are first-difference change scores or percentage changes; our theory applies to changes. For all distributions, we pool the time series change scores across the basic units. (See Appendix 1 for a discussion of measurement and analysis strategies employed here.)
There is no ideal method for comparing distributions regarding their punctuations, so we settled on a three-stage approach. First, we ran Kolmogorov–Smirnov (K-S) tests on all the distributions; then we examined the sample kurtosis for the distributions; finally, we moved to the direct parameter estimate approach.
The K-S test compares the values of a distribution of data to a theoretical probability distribution; significance implies that the observations do not follow the distribution of interest. This test is not particularly powerful; it is fairly easy to reject the null hypothesis. Nevertheless, the null hypothesis that the underlying probability distribution is either normal or lognormal is easily rejected for all the distributions we studied.
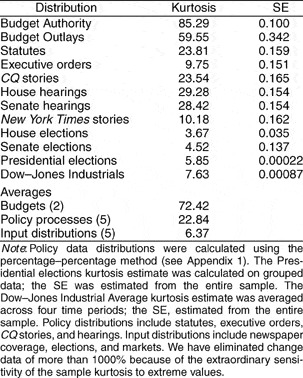
Armed with this information, we examined the standardized kurtosis values for each of the distributions we studied. These results are presented in Table 2. Kurtosis has suffered from difficulties in interpretation (Finucan 1963; Moors 1988) and is flawed as an empirical measure (Balanda and MacGillivray 1988; Groeneveld 1998). In effect, it is too sensitive to the extreme values to estimate the full shape of the distribution properly. But it is the best direct comparative measure we have.

Table 2 generally supports our institutional friction hypothesis. First, all distributions suffer from what finance economists term the “excess kurtosis problem” (Mills 1995)—each and every one of the values exceed that expected from the normal distribution. We can test the statistical hypothesis that the observed sample kurtosis exceeds the expected three9
The sample kurtosis is distributed normally with variance equal to 24/n in the limit (Anscombe and Glynn 1983).
We can say more. Let us divide the distributions into three groups: those assessing final output commitments (the budget distributions), those indicating public policy processes, and those independent of policymaking institutions (here termed “input distributions”). We see great differences in the average sample kurtosis—over 72 for the budget distributions and almost 23 for the policy process distributions, but only 6.37 for the input distributions.10
The policy process distributions include statutes, executive orders, CQ stories, and House and Senate hearings. Input distributions include New York Times coverage, elections, and markets.
There are, however, several “out-of-order” distributions within these groups. The most glaring of these is the kurtosis for executive orders, which falls closer to the values characteristic of the input distributions than to the policy distributions. Also noteworthy is that the kurtosis for statutes is less than that for hearings. For the input distributions, elections seem to exhibit less kurtosis than markets. Again, however, these results cannot be viewed as solid without confirming evidence.
We now move to estimate directly the form of the probability distributions underlying the frequency distributions. It is technically not possible to study all types of possible probability distributions by directly estimating parameters, but it is appropriate for two important classes of distributions—the double exponential (or Laplace) and the double Paretian.11
“Double” because change can occur in a positive or a negative direction. Direct estimates differ from the more familiar quantile comparisons (“q–q” plots). Direct parameter estimation allows researchers to distinguish among distributions within a family.
Indeed, theoretically the Paretian is so punctuated that its variance is infinite. This applies to the theoretical distribution; in empirical practice all moments may be estimated.

We present below selected frequency distributions and their associated scatterplots used to estimate the type of probability distribution with the highest likelihood of generating the empirical frequency distributions. Paretian and exponential distributions may be estimated by examining the fit of the frequency distribution (frequencies versus category midpoints) in log–log and semilog plots, respectively.13
For the Paretian, y=aXb →ln(y) = ln(a) + b ln(X); for the exponential, y = aebx → ln(y) = ln(a) + bX, where X represents the category midpoints of the variable of interest, and y represents the frequencies associated with the midpoints.
As is common practice, we use the cumulative frequencies to estimate the plots. Each side of the distribution is cumulated from its extreme (tail) to the middle category. This makes no difference in the estimation procedure and displays the fundamental aspects of the distribution by stabilizing the “chatter” at the tails of the distributions.
All of the distributions we studied except for government budgets were best approximated by a double-exponential probability distribution. In almost all cases, the fits were exceptionally good, although the right (positive-change) tails for the policy distributions display better fits than the left (negative) tails.
Policy Process
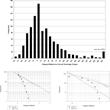
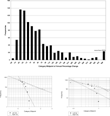
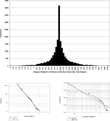
We expect to find more pronounced punctuations in policy commitment distributions than in agenda-setting distributions. Early in the policy process, when proposals struggle to gain agenda access, cognitive costs are high but institutional costs are reasonably low. The scheduling of a policy topic for a hearing is indicative that policymakers are taking the topic seriously—the topic has accessed the policy or governmental agenda, but holding the hearing requires paying only limited decision and transaction costs. Figure 3 shows the frequency distribution for Senate hearings, along with the log–log and semilog plots for the distribution. The hearings data are skewed toward the positive side. The slopes for the left side of the scatterplots have been reversed in sign for purposes of comparison. The fit for the log–log plot displays a distinct downward curvature, indicating that the fit is not good; basically the distribution is less ‘wild’ than the Paretian. The semilog plot fits much better. The slope estimates for the two tails are distinctly of different absolute magnitudes; this indicates that punctuations are more likely in a positive direction than a negative one.

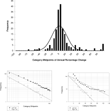
Figure 4 depicts the frequency distribution and the associated scatterplots for lawmaking. The frequency distribution is not as well structured as the other policy distributions, but a right long tail is clearly present, and the right tail displays an excellent fit. The left tail fits less well, a phenomenon that characterizes all of the policy frequency distributions. Moreover, the strong central peak is not as much in evidence in the distribution—it is overshadowed by the extended tail. This is characteristic of exponential distributions as the parameter increases in absolute magnitude. One interpretation of this finding is that when major statutory change occurs, it tends to shift activity from the existing set of policy concerns to new ones.

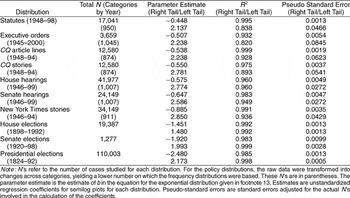
Table 3 presents the exponential fits for policy data (except government budgets), as well as for the elections data. Because of differences in measurement, the market, elections, and policy data are not directly comparable, but they are comparable within sets. The policy output data can be ranked by using the parameter value—essentially lower values indicate more extended tails.15
There are difficult statistical issues associated with direct parameter estimates. First, cumulated plots will not yield independent errors, but the error seems to be trivial (Sornette 2000, 141). Second, the number of cases is not properly represented by the number of points plotted. We report “psuedo-standard errors” to indicate that we adjust these for the actual number of cases studied. This is not entirely correct either, because the extreme values are estimated by fewer points than the points closer to the center of the distribution.

As hypothesized, accessing the systemic agenda, assessed by the New York Times coverage of politics and government, displays more moderate change—essentially more flexibility—in moving from policy topic to policy topic than distributions assessing later stages in the policy cycle. Accessing the policy or governmental agenda, assessed by the scheduling of hearings, comes next, with House hearings slightly more punctuated than Senate hearings. This can be due to constitutional facets that require hearings in certain categories—appropriations, for example. In any case, the difference is not large, and both fit the general pattern.
Inside-the-beltway specialized coverage by the CQ displays a higher kurtosis than press coverage or the scheduling of hearings. This may be a surprise at first glance, but it became clear that CQ's coverage is indexed to the lawmaking activities of Congress. As hypothesized, statutes are the most punctuated of all the exponential policy distributions. Lawmaking requires the cooperation of three separate policymaking institutions and, as a consequence, should be exceptionally sticky. Presidential executive orders occupy a position between the agenda-setting variables and the statutes. Presidential attention must be engaged for him to issue an executive order, but he commits the nation to a policy change with his signature (Mayer 2001). While he need not secure the cooperation of other branches of government in the process, he must deal with intrabranch cooperation among affected agencies, the OMB, and the Justice Department.
Public Budgets.
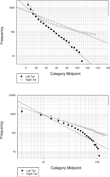
Next we examine resource commitment. Figure 5 presents scatterplots for U.S. Congressional Budget Authority, pooled across OMB subfunctions, for 1947–96 (Figure 1 presents the frequency distribution). We have focused on policy subfunctions, eliminating financial transactions, and have adjusted for inflation. Figure 6 presents the full set of graphs for U.S. Budget Outlays, 1800–1994. Table 4 describes the log–log fits for the two budget series we examined. In each case, the Paretian fit better than the exponential. For U.S. Budget Authority, available only for the modern era, an exponential fit the left, negative change tail better than the Paretian. That is, program curtailment is less punctuated than program growth since the Second World War.


Growth and Retrenchment in Public Policy.
A close look at the semilog plots for the policy distributions suggests a slight upward curvature for the right (positive-change) tail. This is suggestive of a “stretched exponential”, which may be viewed as more leptokurtic than the pure exponential (Laherrere and Sornette 1998).16
This phenomenon affects many natural and economic series, as Laherrere and Sornette (1998) show, and may have accounted for a premature classification of many phenomena as power functions.
The downward curve is not a consequence of the constrained range of the data due to our use of percentage changes; the end point of these tails occurs prior to the theoretical minimum of -100%.
We have conceived of institutional friction as imposing stability but being subject to occasional punctuations. We generally associate it with distributional kurtosis. But there may be an element of institutional friction associated with skew: Affected interests may be able to retard retrenchment punctuations.
Elections
Elections in general should be characterized by less institutional friction than policymaking processes, and our distributional analysis shows that is indeed the case. Figure 7 presents the results for House elections; similar results were obtained from the analyses of Senate and Presidential elections. As is the case for the policy distributions, the exponential is the proper fit for this distribution. The slopes for each side of the double exponential are similar in absolute value, indicating that change is about as likely in one direction as the other.

Within elections, Presidential contests are the least punctuated, while House contests are the most (see Table 3). House elections are characterized by long periods of very little deviation in the voting patterns for the incumbent, punctuated by occasional large swings. Missing is the moderate adjustment that is expected with the normal. It is of course well-known that legislators may make themselves safer than might be predicted by the policy attitudes of the represented, but our approach offers a method of comparison not available when we examine distributions in isolation. It is likely that information in Presidential elections leads to more frequent updating, and hence more moderate change, than in House elections.
Markets
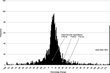
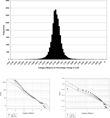
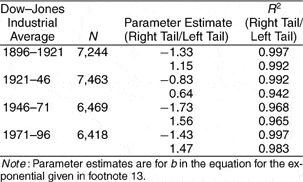
Markets, in theory, should be the most friction-free of the major political and economic institutions in America. Figure 8 presents the results for U.S. stock market returns as a composite diagram across 100 years of the Dow–Jones Industrial Average. We estimated exponential fits for daily returns for the Dow–Jones Industrial Average for four separate periods and for the entire series, 1896 through 1996. Table 5 presents these results.


Financial economists have studied the kurtosis associated with stock returns (beginning with Mandelbrot 1964). Direct empirical estimates of the distributions have been rarer than time series studies, and occasionally analysts have rushed to conclude that stock markets follow power functions (Peters 1991, 1994). Table 5 shows that stock markets, like much political data, follow an exponential probability distribution. The upward curvature is suggestive of the stretched exponential.
SOME CAVEATS IN STUDYING DYNAMICS
The distributions we have studied order themselves clearly into three groups: the “input distributions” (elections, markets, and news coverage), with relatively low kurtosis and shorter tails; the “policy process” distributions (hearings, CQ coverage, executive orders, and statutes), with higher kurtosis and somewhat more extended tails; and the budget distributions, with very high kurtosis and both relatively high stability and thick tails. Within the policy process distributions, there are relatively more extreme values later in the policy cycle (statutes) compared to earlier (hearings).
The finding of so many exponential distributions among those we studied is intriguing but causes some modification of the institutional friction theory. Technically statisticians categorize the exponential distribution as (relatively) thin-tailed, sometimes using the exponential as the dividing point between thin- and thick-tailed distributions. In addition, in the case of the exponential, peakedness and stretched tails (a better term than “thick tails” for the exponential) are inversely related. Empirically this means that, within the exponential family of distributions, major changes or punctuations must be compensated for by “giving up” some stability or peakedness. That is not the case for the Paretian, where both stability and punctuations can increase at the expense of the shoulders.
As the parameter for the exponential increases, then, the tail becomes more “stretched out” and there are relatively more extreme changes. But this is at the cost of stability. Both stability and punctuations occur relatively less in any exponential distribution than in Pareto distributions, but the exponential parameter is an important governor of the extensiveness of punctuations within the exponential family. As the exponential parameter increases, there are relatively more punctuations and relatively less stability. This seems to be the dynamic characteristic of most policymaking distributions, even statutes. It suggests that policymaking systems following an exponential path are more adaptive to incoming information than systems following a Paretian path.
A second issue relates to the causal dynamics that underpin the distributions we have studied. We have relentlessly pursued the notion that political change is affected by institutional friction, and it is clear that there is considerable evidence for the hypothesis. This cannot be the whole story of punctuated political distributions, however. Most importantly, heavy tails in frequency distributions can be caused by cascades—bandwagons and fads, for example. In such situations, there exists interdependency among the cases. Such “chain reaction” dynamics is most in evidence in the budget data, where clearly program budgets are not completely independent, nor are they dictated solely by macro budgeting concerns (which would induce case dependency). More generally, any process that induces interdependency (such as the familiar monitoring and mimicking behaviors observed in markets and in lobbying) result in “thick-tailed” distributions. We cannot address just how these cascading processes are intertwined with friction-related institutional costs here, but we believe that this ought to be a major avenue of future research in policy processes.
While our direct parameter tests indicate that the double exponential fits both the elections data and the stock market data, the distribution for elections is more centrally peaked than that for stock market data. As a consequence, the punctuations for the stock market are relatively more extreme and the central stability is relatively less rigid. Election swings are bounded, while stock market returns are not, which can account for the difference. But other factors may be at work. Both institutions aggregate individual choices in a straightforward manner, but Tip O'Neil's dictum, “All politics is local,” suggests that elections for the House of Representatives, at least, are less subject to national election trends than stock markets. As markets become more linked, they could be more subject to cascades even as information is more and more widely available. One fruitful line of inquiry would be to examine more thoroughly the “anchoring” effect of local forces in Congressional elections. It stands to reason that election distributions will be more strongly anchored by the incumbency effect, something that does not exist for markets.
The general point here is that it is difficult to isolate the effects of institutional friction, which leads to punctuated outputs, from cascade dynamics, which also leads to punctuated outputs. And of course there are other potential causal processes that could account for the distributions we analyze in this paper. A disadvantage of the stochastic process approach is that it is less amenable to ruling out alternate causal models than the more familiar regression-based structural modeling approach. On the other hand, examining distributions can lead to radically different understandings of causal mechanisms, to fresh tests of causal processes, and to new directions of research.
CONCLUSIONS
In this paper, we have demonstrated the following.
- All of the distributions display distinct positive kurtosis that exceeds that of the normal distribution.
- If we order institutions in terms of the institutional costs they impose on taking collective action, then the associated output distributions are increasingly leptokurtic.
- Where institutionally imposed costs are very low, positive kurtosis is still in evidence.
- All of the distributions are best approximated by the exponential except for budgets, which are Paretian.
- In the case of policy change, entering new policy domains is more punctuated than withdrawing from old ones.
Such empirical regularities require a general approach, based in how institutionally imposed costs and the cognitive limitations of participants act to affect how information coming from the environment is processed. This moves us to a high level of abstraction, one incapable of assessing the details of how institutions operate but that allows comparison among institutions currently addressed in a separate, disjoint manner. In the case of U.S. national policymaking institutions, our approach implies that “gridlock” is an incomplete description of policy processes and that institutions with higher costs on action display a greater tendency to lurch between stability and punctuations.
A few particulars may be addressed. It may be noted that if one institution's outputs serves as information for a second, the second must have a leptokurtic output distribution. But normally institutions are not so tightly linked; a degree of choice and attention accompanies any decision-making process. Similarly if institutions follow a uniform news source to access information, then they all are hostage to the distribution of outputs produced by that source. This strategy would violate our early assumption about implicit indicators as a strategy for information acquisition, but in any case it would not vitiate any key finding in this paper. For example, it cannot account for the ordered kurtosis we find related to institutionally imposed costs.
Because of the small number of observations, in most cases we needed to pool observations across time and subcategories. It is possible that our pooling approach has, in effect, resulted in a mixture of different stochastic processes. We did some rudimentary tests—looking at budgetary functions rather than subfunctions and examining the outlays data across the longer time period; in each case, no differences emerged. It is also the case that mixing a set of similar probability distributions often yields a different observed distribution.18
Padgett (1980) shows that a mixture of Paretian distributions results in an exponential distribution, for example.
Perhaps most importantly, our central finding that institutions act to cause greater punctuations than would be expected based on the information flow seems directly at odds with the notion that institutions regularize human interactions. First, the series we have studied are limited to the United States. Given a liberal democratic system, it is the case that institutions add friction to human choices in a predictable way—they cause greater stability but more severe change when it does occur. The right balance between stability and change is elusive, but too much stability can lead to major disruptions, even revolutions, when change occurs, whereas hyperresponsiveness to incoming information may not allow for any continuity and future planning (Jones 1994). Moreover, because decision costs, unlike transaction costs, impose policy choices on the unwilling, ensuring that major policy shifts are based on large majorities, seems normatively justifiable.
Why do liberal democratic social processes apparently display less extreme behavior than natural phenomena? We noted that many scientists have claimed that Paretian or power distributions characterize many physical phenomena. There have been dissents (Laherrere and Sornette 1998), but these studies have found stretched exponentials, reaching toward the extreme values of the Paretian. Excepting positive change in government budgets, we report none of the extreme distributions found in natural sciences. A possible answer may be found in the openness of the system examined. Forest fires are far less likely to be catastrophic if regular lightening strikes ignite fires; if fires are contained, and fuel builds (that is, the system is more “closed” to inputs), then the likelihood of extreme fires may increase. Similarly, dykes on rivers may prevent moderate floods but inadvertently increase the (still small) probability of major floods.
We have noted that “exponential” policymaking systems in effect give up peakedness in order to achieve punctuations. Paretian policymaking systems can give up shoulders for both peakedness and punctuations. It is likely, then, that exponential policy systems are more adaptable to changing real-world circumstances. That certainly seems to be the case from the distributions we have studied in this paper.
In human systems, intervention may act to move a previously well-behaved system into a more punctuated one (as in the case of forest fires or river engineering), but the opposite may occur as well. The key may be to think of tuning a system toward regular disruption, suffering dislocations but avoiding the catastrophe. This notion has been advanced for policymaking subsystems (Jones 1994). This kind of system may be better modeled by the exponential than the Paretian.
In any case, the empirical regularities that underlie political (and perhaps economic) change are so pervasive that a general approach is warranted. At present, an information-processing approach that is sensitive to both the cost structure imposed by institutions and the cognitive limits of actors seems most promising.
APPENDIX 1: MEASUREMENT AND DATA
As noted above, our measures are change scores—either first differences or percentage changes—usually pooled across subcategories. In this Appendix we detail the measurement strategies used here Particularly important for the policy data is the different ways to calculate percentage changes; each is legitimate but they have different theoretical implications.
For Presidential elections, we pool across counties; for House elections, across election districts; and for Senate elections, across seats. Electoral data are swing ratios, basically first differences for electoral margins.19
The swing ratio is calculated as the election-to-election differences in the Democratic percentage of the two-party vote across House elections (by District) and Senate elections (by seat).
We calculate our year-to-year percentage change scores in the amount of attention paid to each major topic using the following formula:

Thus, if there were 24 hearings on health care in 1946 and 12 in 1947, the year-to-year change would be −0.50. We use this method because it enables us to capture both change in attention to issues and the overall growth of the agenda over time.
We could also choose a relative measure of change; for example, calculating the percentage of the total agenda comprised by each issue area in each year and then calculating difference or percentage change scores:

For example, if health comprised 10% of the agenda in 1946 and 12% in 1947, we could measure the amount of change as 12%−10% = 2% or as (12%−10%)/10% = 0.20. These two approaches actually have different theoretical implications. The first, the percentage–count method, allows for growth in the total size of the policy agenda. It does so by basing change on what has occurred before within the policy area. The second, the percentage–percentage method, treats the agenda space as constant through time. It bases change on both what went before in a policy arena and what is happening in other policy arenas. We generally prefer the first, because an expanded capacity of government seems to imply a growing capacity to process issues, but use the second for the direct tests of kurtosis, since the skewed distributions from the percentage–count method cause estimation problems.
The results we report here are robust with respect to the choice of methods for calculating change—this does not influence the functional form of the aggregate change distributions. However, the specifics of the parameter estimates are affected. The positive and negative tails of the policy distributions are approximately symmetrical for the percentage–percentage method, but for the percentage–count method the positive (growth) tail is more punctuated.
APPENDIX 2: NOTES ON THE EFFICIENT MARKET THESIS
Markets for assets such as stocks and bonds in modern capitalist economies impose few transaction costs (and no decision costs) on participants. Informational inputs should be efficiently translated into outputs (returns). This notion has been around for a century. In 1900, Louis Bachelier articulated what was to become the efficient market thesis(EMT), (Maikel, 1992). If market returns (defined as the difference between prices at time2 minus prices at time1) were independent, identically distributed random variables, then they would follow a random walk (dubbed Brownian motion by Einstein five years later). The modern literature may be dated to the early 1960s, when Eugene Fama formalized the EMT (Cootner 1964). Soon after Samuelson formulated the problem as a martingale, which implied that “information contained in past prices is instantly, fully, and perpetually reflected in the asset's current price” (Campbell, Lo, and McKinley 1997, 30). This formulation implies that, given the available information, the conditional expectation of future price changes is zero.
The EMT, as codified by 1970 (Fama 1970), implies that market returns ought to follow a random walk (perhaps with drift) and, hence, be normally distributed (by the central limit theorem). The problem is that market returns do not display such behavior. Rather, market returns in many empirical studies display pronounced positive kurtosis (and less pronounced skew) in comparison to the normal (Lux 1998; Peters 1991, 1994). This anomaly has led researchers to postulate different underlying distributions and stochastic processes to account for the empirical findings, but there has been a tendency to avoid full discussion and examination of the substantive interpretations of these deviations (Lux 1998) or to claim that somehow they are rational (Hershleifer 1995). It is hard, however to escape the interpretation that markets are just not fully efficient, that this inefficiency is rooted in the cognitive capacities of actors, and that these cognitive costs result in leptokurtosis (Plott and Sunder 1982; Shiller 2000; Shleifer 2000).
References
Anscombe F. J.
Glynn William J.
1983
Distribution of the Kurtosis Statistic b2 for Normal Samples
Biometrika
70
227-34Google Scholar
Bak Per
1997
How Nature Works.
New York
Springer-Verlag
Balanda K. P.
MacGillivray H. L.
1988
Kurtosis: A Critical Review
American Statistician
42
111-19Google Scholar
Baumgartner Frank R.
Jones Bryan D.
1993
Agendas and Instability in American Politics
Chicago
University of Chicago Press
Baumgartner Frank R.
Jones Bryan D.
Michael MacLeod
1998
Lessons from the Trenches: Quality, Reliability, and Usability in a New Data Source
Political Methodologist
8
1-10Google Scholar
Bennett W. Lance.
1990
Toward a Theory of Press-State Relations in the United States
Journal of Communication
40
103-25Google Scholar
Bish Robert
1973
The Public Economy of Metropolitan Areas
Chicago
Markham
Buchanan James M.
Gordon Tullock
1962
The Calculus of Consent
Ann Arbor
University of Michigan Press
Campbell John Y.
Andrew Lo
MacKinlay A. Craig
1997
The Econometrics of Financial Markets
Princeton N.J.
Princeton University Press
Cootner Paul H.
1964
The Random Character of Stock Market Prices.
Cambridge, MA
MIT Press
deLeon Peter
1999
The Stage Approach to the Policy Process
Theories of the Policy Process
Paul Sabbatier
Boulder, CO
Westview
Company Dow-Jones and
1996
100 Years of Dow Data
Chichopee, MA
Dow–Jones
Fama Eugene F.
1970
Efficient Capital Markets: A review of Theory and Empirical Work
The Journal of Finance
25
383-417Google Scholar
Finucan H. M.
1963
A Note on Kurtosis
Journal of the Royal Statistical Society, Series B
26
111-12Google Scholar
Groeneveld Richard A.
1998
A Class of Quintile Measures for Kurtosis
American Statistician
51
325-29Google Scholar
Hammond Thomas
Miller Gary J.
1987
The Core of the Constitution
American Political Science Review
81
1155-74Google Scholar
Hirshleifer David
1995
Social Influence, Fads, and Informational Cascades
The New Economics of Human Behavior
Mariano Tommasi
Kathryn Ierulli
Chicago
University of Chicago Press
Jackson John E.
1990
Institutions in American Society
Ann Arbor
University of Michigan Press
Jones Bryan D.
1994
Reconceiving Decision-Making in Democratic Politics
Chicago
University of Chicago
Jones Bryan D.
2001
Politics and the Architecture of Choice
Chicago
University of Chicago Press
Jones Bryan D.
Baumgartner Frank R.
True James L.
1996
The Shape of Change: Punctuations and Stability in U.S. Budgeting, 1947–96.
Presented at the Midwest Political Science Association, Chicago
King Gary
1997
Elections to the United States House of Representatives, 1898–1992.
Ann Arbor
Inter-University Consortium for Political and Social Research, University of Michigan.
No. 6311
Kingdon John
1995
Agendas, Alternatives, and Public Policies
2nd ed.
Boston
Little, Brown
Kotz Samuel
Saralees Nadarajah
2000
Extreme Value Distributions: Theory and Practice.
London
Imperial College Press
Krehbiel Keith
1998
Pivotal Politics: A Theory of U.S. Lawmaking.
Chicago
University of Chicago Press
Laherrere Jean
Didier Sornette
1998
Stretched Exponential Distributions in Nature and Economy
European Physical Journal B
2
525-39Google Scholar
Lux Thomas
1998
The Socio-Economic Dynamics of Speculative Markets
Journal of Economic Behavior and Organization
33
143-65Google Scholar
Maikel Burton
1992
Efficient Market Thesis
New Palgrave Dictionary of Money and Fianance
P. Newman
M. Milgate
J. Eatwell
London
Macmillan
Mandelbrot Benoit
1964
The Variation of Certain Speculative Prices
The Random Character of Stock Market Prices
Paul H. Cootner
Cambridge, MA
MIT Press
307–32
Mandelbrot Benoit
1997
Fractals and Scaling in Finance
New York
Springer
Mandelbrot Benoit
1999
Multifractals and 1/f Noise
New York
Springer
Mayer Kenneth
2001
With the Stroke of a Pen: Executive Orders and Political Power
Princeton, NJ
Princeton University Press
Mills Terence C.
1995
Modelling Skewness and Kurtosis in the London Stock Exchange FT-SE Index Return Distributions
Statistician
44
323-32Google Scholar
North Douglass
1990
Institutions, Institutional Change, and Economic Performance.
New York
Cambridge
Padgett John
1980
Bounded Rationality in Budget Research
American Political Science Review
74
354-72Google Scholar
Padgett John
1981
Hierarchy and Ecological Control in Federal Budgetary Decision-Making
American Journal of Sociology
87
75-128Google Scholar
Peters Edgar F.
1991
Chaos and Order in the Capital Markets
New York
John Wiley
Peters Edgar F.
1994
Fractal Market Analysis.
New York
John Wiley
Plott Charles
Shyam Sunder
1982
Efficiency of Experimental Security Markets with Insider Information: An Application of Rational-Expectations Models
Journal of Political Economy
90
663-98Google Scholar
Rundle John B.
Turcotte Donald L.
William Klein
1996
Reduction and Predictability of Natural Disasters
Reading, MA
Addison–Wesley
Schroeder Manfred
1991
Fractals, Chaos, Power Laws.
New York
Freeman
Shiller Robert J.
2000
Irrational Exuberance.
Princeton, N.J.
Princeton University Press
Shleifer Andrea
2000
Inefficient Markets.
Oxford
Oxford University Press
Simon Herbert A.
1996
The Sciences of the Artificial.
3rd ed. Cambridge, MA
MIT Press
Sparrow Bartholomew H.
1996
From the Outside In: World War II and the American State
Chicago
University of Chicago Press
Sornette Didier
2000
Critical Phenomena in Natural Sciences
. Berlin
Springer
True James L.
1999
Attention, Inertia, and Equity in the Social Security Program
Journal of Public Administration Research and Theory
9
571-96Google Scholar
True James L.
Jones Bryan D.
Baumgartner Frank R.
1999
Punctuated Equilibrium Theory
Theories of the Policy Process
Paul Sabbatier
Boulder, Colo
Westview
West Bruce J.
Bill Deering
1995
The Lure of Modern Science.
Singapore
World Scientific
Distributions Studied
Sample Kurtosis Calculated on Raw Data

Exponential (Semilog) Fits for Policy and Election Frequency Distributions

Goodness-of-Fit Measures for Paretian Distribution for Government Budget Data
Distributions Studied
 You have Access
- 262
- Cited by
Comments
No Comments have been published for this article.