1. Introduction
A large variety of melt models of different complexity and scope have been developed during recent decades. These range from physically based energy-balance models (e.g. Reference Brun, Martin, Simon, Gendre and ColéouBrun and others, 1989; Reference Blöschl, Kirnbauer and GutknechtBlöschl and others, 1991; Reference Arnold, Willis, Sharp, Richards and LawsonArnold and others, 1996) to empirical methods based on one or more meteorological variables, often only on air temperature (e.g. Reference BraithwaiteBraithwaite, 1995). Although melt rates are determined by the surface-energy balance, methods based on heat flux are often not applicable because the required data are unavailable. This is particularly true of high-mountain regions. Hence, temperature-index methods have been the most widely used for computing snow and ice melt, as air temperatures are generally the most readily available data. Temperature-index methods have provided the melt inputs for most conceptual runoff models (for summaries, see Reference Fountain and TangbornFountain and Tangborn, 1985; WMO, 1986) as well as for most ice-dynamic models (e.g. Reference HuybrechtsHuybrechts, 1994). They have also been used for climatic sensitivity studies, since climate scenarios are typically given in terms of air temperature and precipitation changes (e.g. Reference Laumann and ReehLaumann and Reeh, 1993; Reference Jóhannesson, Sigurdsson, Laumann and KennettJóhannesson and others, 1995).
Temperature-index modelling rests upon an assumed linear relationship between ablation and positive air-temperature sums, the factor of proportionality being the degree-day factor. Although they do not describe the physics of the melt process, index models yield results comparable to those of energy-balance models when daily runoff is computed un a catchment scale (WMO, 1986). However, classical temperature-index models have two major drawbacks:
-
(1) The temporal resolution is restricted. Degree-day methods work well over longer time periods, but the accuracy decreases with increasing time resolution (Reference Lang, Kraijenhoff and MollLang, 1986). For hydrological purposes most degree-day models employ a daily resolution, assuming the degree-day factor to be constant in time (e.g. Reference Lindström, Gardelin, Johansson and PerssonLindström and others, 1996) or to vary seasonally (e.g. Reference Quick and PipesQuick and Pipes, 1977; Reference GottliebGottlieb, 1980; Reference TangbornTangborn, 1984; Reference Braun, Grabs and RanaBraun and others, 1993). In glaciated and snow-covered basins, a daily time resolution is insufficient to capture the peak discharges, as melt-dominated discharge regimes are subject to pronounced diurnal cycles (Reference Meier and TangbornMeier and Tangborn, 1961). Because constant degree-day factors are inappropriate for high temporal resolution, sub-diurnal time steps tend to be considered by energy-balance approaches (e.g. Reference Baker, Moser, Oerter and ReinwarthBaker and others, 1982).
-
(2) The spatial variability of melt rates is not modelled accurately. Usually the degree-day factors are assumed invariant in space, although some models use different degree-day factors for snow and ice, or for different aspect classes (e.g. Reference BraunBraun and others, 1995). However, melt rates can be subject to substantial small-scale variations in space, particularly in high-mountainous regions, as a result of the effects of surrounding topography. Topographic effects, such as topographic shading, aspect and slope angles, exert a strong control on the spatial distribution of global radiation, and thus on melt, as global radiation has generally been recognised as a major source of energy for melt (for summary, see Reference Ohmura, Kasser and FunkOhmura and others, 1992). Consequently, although the degree-day factor may be a good index of average melt raies, it does not allow the spatial dynamics of the melt process to be taken into account.
These drawbacks pose a major problem to high-resolution modelling of melt with respect to space and time, when data availability is restricted. During the last decade, prompted by an increase in computational power, a trend towards higher-resolution modelling can be observed. For instance, hydrologie models more frequently adopt hourly time steps instead of a daily time resolution, nourished by an increasing demand to predict peak discharges for flood-forecasting purposes. Concerning the spatial variability, there is an increasing need for spatially distributed melt models (Reference Kirnbauer, Blöschl and GutknechtKirnbauer and others, 1994), since lumped melt models, although widely used (WMO, 1986), generally are not capable of handling the extreme heterogeneity encountered in complex topography. Consequently, there is a current lack of models that are capable of handling both sub-diurnal time steps and the spatial characteristics of complex topography, while being based only on moderate meteorological input data.
At the site scale, many attempts have been made to improve the performance of index models by including more climatic variables, such as wind speed, vapour pressure or radiation components (e.g. Reference AndersonAnderson 1973; Reference Lang, Kraijenhoff and MollLang, 1986; Kustas and others, 1991). Reference MartinecMartinec (1989) incorporated global radiation and albedo into model formulations in order to achieve a better simulation of hourly snowmelt rates. However, the method is still empirical, but has higher data requirements. An interesting approach to explaining the spatial variability of melt was suggested by Reference Cazorzi and dalla FontanaCazorzi and Fontana (1996). The temperature-index approach was combined with a distributed radiation index based on monthly maps of potential global radiation in order to compute snowmelt rates on a 20 m resolution grid. However, the use of monthly radiation maps does not account for the daily variations in melt rates.
This paper suggests a new temperature-index model accounting for both the spatial and the daily variability of melt rates. This is accomplished by including potential clear-sky direct solar radiation, and hence without the need for additional meteorological input data besides air temperature. The model is fully distributed, i.e. snow and ice melt are calculated for each raster element of a 30 m resolution digital elevation model (DEM). The results are compared to those obtained from the classical degree-day method and an extended temperature-index approach including measured global radiation. The models are applied to Storglaciären, a small valley glacier in northern Sweden, using data from two melt seasons. Model verification is performed by comparing simulated and measured cumulative melt on the glacier and simulated and measured hourly discharge at the glacier terminus.
2. Site description and data collection
Storglaciären is located in Swedish Lappland (67°55′ N, 18°35′ E) and has a total surface area of 3.1 km2 (Fig. 1). The glacier ranges in altitude from 1120 to 1730 m a.s.l. The average annual temperature, as measured at the Tarfala research station 1 km northeast of the glacier (1130 m a.s.l.) between 1965 and 1995, is –3.9°C and the average summer temperature (June–August) is 5.5°C (Reference Grudd and SchneiderGrudd and Schneider, 1996).
From June to September 1993 and 1994 a comprehensive field programme was conducted on Storglaciären, including micrometeorological, ablation and discharge measurements (Reference Hock and HolmgrenHock and Holmgren, 1996). Several automatic weather stations were operated on the glacier, collecting data on air temperature, relative humidity, wind speed, wind direction, radiation components and precipitation (Fig. 1). Data were sampled every 10 seconds, and averages were stored on data loggers every 15 min. In this paper, only the air-temperature and global radiation measurements are of interest. Air temperature was measured by Rotronic sensors. At stations A and C the sensors were unventilated, and at station B a ventilated and an unventilated sensor were installed side by side. During daytime, the hourly temperature means of the unventilated sensor considerably exceeded those of the ventilated sensor, on calm clear-sky days by up to 6°C (Reference HockHock, 1994). The temperature differences showed distinct periodic cycles, roughly following the daily course of global radiation. Due to instrument failure, ventilated temperature data were available during only about half of the total period of station operation. Using the data from this period, a correction formula was derived to correct the data of the unventilated sensor as a function of global radiation and wind speed during the remaining periods.
Drainage basin of Storglaciären with 25 m contour lines. N and S refer to the sites of the water-stage recording stations at the glacial streams, Nordjåkk and Sydjåkk. Black dots mark the positions of the ablation slakes in 1994, only slightly differing from the ones in 1993. Circles labelled A, B and C denote the sites of three micro-meteorological stations on the glacier.

As part of the routine programme of the Tarfala research station (Reference Holmlund, Karlén and GruddHolmlund and others, 1996) more than 50 ablation stakes distributed evenly across the glacier were available to monitor ablation throughout the season. The stakes were read several times during the melt seasons. Snow density was measured in several pits on the glacier at the beginning and the end of the melt seasons and occasionally in between in order to allow for conversion of the stake readings into water-equivalent melt. A density of 900 kg m-3 was assumed for ice. The 1993 mass balance was positive (1.00 m) mainly as a result of very high winter accumulation. The 1994 mass balance was –0.37 m (Reference Holmlund, Karlén and GruddHolmlund and others, 1996). The summer of 1994 was exceptionally dry and sunny, unlike that of 1993, which was cold and wet.
Discharge was continuously monitored approximately 300 m below the glacier terminus at the principal streams, Nordjåkk and Sydjåkk, using mechanical stage recorders (Fig. 1). The stage–discharge relationships were established for each stream by means of discharge measurements based on the salt-dilution technique (Hock and Schneider, 1995). The relationships are well established for discharges up to approximately 2 m3 s-1 on Nordjåkk and 1 m3 s-1 on Sydjåkk. For flood flows beyond these ranges, usually occurring several limes per melt season (Figs 5 and 6), the relationships could not he verified. Hourly records of total discharge were derived for both summers.
3. Model Description
Ablation was computed for every hour and for each gridcell of a 30 m resolution DEM (Reference SchneiderSchneider, 1993). A discharge model was coupled to the mass-balance model to enable the simulation of hourly glacial discharge.
3.1. Snow and ice melt
Melt is computed from three different temperature-index methods, assuming melt to be proportional to positive air temperatures: (1) the classical degree-day method, (2) a method including potential clear-sky direct solar radiation, and (3) a method including potential clear-sky direct solar radiation and measured global radiation.
Model 1: Classical degree-day factor
Melt rates M (mm h-1) are obtained by the most basic formulation of a temperature-index approach:

where DDF is the degree-day factor (mm d-1 °C-1), different for snow and ice surfaces, T is screen level air temperature and n is the number of time steps per day, here n = 24, as the time step is 1 h. The degree-day factor for ice is expected to exceed that for snow under otherwise identical conditions as a result of the difference in albedo between these surfaces (Reference BraithwaiteBraithwaite, 1995). The factor applied for snow is also assumed for lint surfaces. DDFsnow and DDFice are assumed constant in space and time. Consequently, computed melt rates over ice and snow are only a function of air temperatures. The areal distribution of melt rates will be rather uniform neglecting the terrain effects by slope, aspect and topographic shading. Temporally, for positive air temperatures, the daily melt cycles will be linearly proportional to the daily temperature cycles.
Model 2: Temperature index including potential clear-sky direct solar radiation
A new temperature-index method is developed, aiming to overcome the shortcomings of the classical degree-day approach with respect to the spatial and daily variability of melt rates. Melt rates are determined to a large extent by-global radiation (the sum of direct solar and diffuse radiation), which in turn is strongly affected by atmospheric conditions and by local topography, particularly in high-mountainous regions. Consideration of the atmospheric effects on global radiation at the surface would require radiation or cloud data, whereas the effects of topography are predictable from well-known geometric relationships, without the need for meteorological data.
The new approach incorporates a radiation index in terms of potential direct solar radiation at the surface, based on the following considerations: (1) potential direct solar radiation can be calculated without any meteorological input data; (2) it considers topographic effects, such as slope, aspect and effective horizon, thus introducing a distinct spatial element; (3) it is subject to pronounced daily cycles, similar to the ones generally observed for melt rates. The radiation index refers to clear-sky conditions, Reduction of potential clear-sky direct radiation due to clouds is neglected to avoid the need for additional meteorological input data. This aspect is considered in model 3 for comparison. The new method involves the computation of slope and aspect angles for each rasier element of a DEM. In addition, for every hour and each gridcell, shading due to surrounding topography is calculated based on the effective horizon and the position of the sun. A DEM sufficiently large to allow for the accounting of topographic shading of the entire area considered is required as input.
Potential clear-sky direct solar radiation at the surface is incorporated into the model formulation in the following way:

where MF is a melt factor (mm d-l °C-1), a snow/ice is a radiation coefficient different for snow and ice surfaces, I is potential clear-sky direct solar radiation at the ice or snow surface (W m-2) and T is air temperature (°C). The melt factor and the radiation coefficient are empirical coefficients. I is calculated as a function of top of atmosphere solar radiation, an assumed atmospheric transmissivity, solar geometry and topographic characteristics:

where I 0 is the solar constant (l368 W m-2; Reference Fröhlich, McBean and HantelFröhlich, 1993), (R m/R)2 is the eccentricity correction factor of the Earth’s orbit for the time considered, with R the instantaneous Sun–Earth distance and R m the mean Sun–Earth distance, φ a is the mean atmospheric clear-sky transmissivity, P is the atmospheric pressure, P 0 is the mean atmospheric pressure at sea level, Z is the local zenith angle and θ is the angle of incidence between the normal to the grid slope and the solar beam. A constant value of 0.75 is assumed for the clear-sky transmissivity φ a (Reference HockHock, 1998), lying within the range 0.6–0.9 reported in other studies (Reference OkeOke, 1987). Strictly speaking, φ a will vary in space and time. In this context, however, the assumption of a constant value is considered sufficiently accurate, as the computed direct radiation is not interpreted directly as energy available for melt, but rather represents an index which subsequently is scaled by the empirical coefficient a. The ratio P/P 0 accounts for the effect of altitude, yielding higher direct radiation at higher elevations. The introduction of cos Z in the exponent expresses the variation of the path length with sun altitude. Potential direct radiation was calculated every 10 min and hourly means were applied in Equation (2).
For the incidence angle, the widely used solution proposed by Reference Garnier and OhmuraGarnier and Ohmura (1968) is applied:

where β is the slope angle, Z is the zenith angle and φ sun and φ slope are the solar azimuth and the slope azimuth (aspect) angle, respectively. The zenith angle is approximated as a function of latitude, solar declination and hour angle using standard methods (e.g. Reference SellersSellers, 1965; Reference IqbalIqbal, 1983). Potential direct solar radiation is set to zero between sunset and sunrise and for the gridcells that are shaded by surrounding topography. In these cases the model corresponds to the classical degree-day approach (model 1). In all other cases the degree-day factor is modified as a function of potential direct solar radiation, and hence varies diurnally with the course of direct radiation and spatially as a function of topographic-shading, slope and aspect angles.
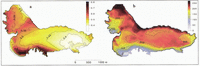
The effects of topography on shading and potential direct solar radiation are illustrated in Figure 2, revealing considerable variations over short distances. Within a distance of approximately 1 km the potential direct solar radiation averaged over three summer months ranges from < 50 W m-2 on a north-exposed slope to > 250 W m-2 on a south-exposed slope. The temporal variations of clear-sky direct solar radiation are shown in Figure 3, illustrating the distinct daily cyclicity. Therefore, by including potential direct radiation I in the model formulation, both diurnal and spatial variations in calculated melt are taken into account. Measured data are not required for the calculation of I, since surface topography and solar geometry determine its value. Consequently, the meteorological input ?f model 2 is identical to that of the classical degree-day method (model 1), namely, only air-temperature data.
Model 3: Temperature index including potential clear-sky direct solar radiation and measured global radiation
As stated above, model 2 is based on the assumption of clear-sky conditions. Under cloudy or overcast conditions, however, direct solar radiation may be considerably lower than the potential value, and consequently its contribution to the energy available for melt will be reduced. To investigate this effect, the approach above is extended using global radiation data collected in the area considered in order to scale the second term in parentheses in Equation (2). The ratio of measured global radiation to potential clear-sky direct radiation is included to indicate the deviations from clear-sky conditions. The formulation reads:

where MF and a are empirical coefficients as in Equation (2), G s is measured global radiation (W m-2) at a site in the area considered and I s is potential clear-sky direct solar radiation (W m-2) at the site of the global radiation measurements. The temporal variations of I s and G are shown in Figure 3. During clear-sky conditions global radiation exceeds theoretical direct solar radiation I, whereas during cloudy conditions global radiation may be considerably lower than I, as a result of reduced direct radiation. Hence, the ratio G s/I s is largest under clear-sky conditions and the ratio is smallest under overcast conditions, ranging roughly between 1.2 and 0.2. Consequently, the second term in parentheses in Equation (5), and hence calculated melt, will decrease with reduced direct radiation due to increasing cloudiness. The ratio is not defined when the site of the measurements is shaded, as direct radiation is zero. During such periods the last ratio before the station became shaded is assumed until a new ratio can be calculated, usually the following morning.
Spatial variation of shading given as ratio of number of shaded hours to total number of hours (a) and potential clear-sky direct solar radiation (W m-2) (b) on Storglaciären, averaged for each gridcell, 15 June–15 September.

Hourly potential clear-sky direct solar radiation I (a) and measured global radiation G (b) at station B on Storglaciären (Fig. 1), 1 July–1 September 1994.

3.2. Discharge routing
Melt-rate data were not available with a sufficiently high temporal resolution to enable the verification of modelled short-term patterns. Therefore, a discharge model was coupled to the melt model, in order to allow for additional model validation, in particular of diurnal fluctuations, by means of measured discharge, as discharge data were available with an hourly time resolution. The discharge-routing model is based on Reference Baker, Moser, Oerter and ReinwarthBaker and others (1982) and has previously been applied to Storglaciären by Reference Hock and NoetzliHock and Noetzli (1997). Hourly sums of melt and rain are routed through the glacier by three linear reservoirs i, one each for firn, snow and ice. Total hourly discharge is given by

where R(t) is the rate of water inflow to the reservoir i, here equivalent to the sum of meltwater and rain, and k is the storage parameter with the unit of time. Different storage parameters are used for each reservoir, thus accounting for the marked differences in throughflow velocities of these media. The k values were assumed constant in time and were taken from Reference Hock and NoetzliHock and Noetzli (1997).
4. Model application and parameter optimisation
The data recorded at station B (Fig. 1) were used as input. Air temperature was extrapolated by a lapse rate of 0.55°C (100 m)-1 as derived on average from the temperature data of stations A and B. The data of station C were not used, because the temperatures are considered to be affected by proximity to the mountain wall in the west. The surface type was prescribed by raster maps, indicating for each gridcell whether the surface was ice or snow. For each season, a sequence of such maps was produced, each map assumed to be valid for a different period of a few days during the melt season, thus taking into account the retreat of the snowline (Reference Hock and NoetzliHock and Noetzli, 1997). The maps were also used to allocate the corresponding k values for discharge-routing to each gridcell (Equation (6)).
Discharge and melt were compared to measurements for different periods of time according to the availability of data for model verification. Hourly discharge was simulated for the periods 9 July–17 August 1993 and 11 July–6 September 1994. Cumulative meltwater equivalent was modelled for the periods 7 June–17 September 1993 and 5 July–25 August 1994. The performance of the model was assessed by the agreement between computed and recorded discharge hydro-graphs and the agreement between computed and measured melt rates at the ablation stakes. The agreement with respect to discharge was expressed in terms of the efficiency criterion R 2 (Reference Nash and SutcliffeNash and Sutcliffe, 1970) and a modified version R ln 2 (Reference SchullaSchulla, 1997):


where Q is discharge, the subscripts “m” and “s” denoting measured and simulated, respectively. The bar refers to the mean and n to the number of time steps calculated. Both criteria assume a value of 1 in case of perfect agreement.
The criterion R 2 is widely used for assessment of the model performance, often as the sole criterion (e.g. Reference GottliebGottlieb, 1980). The criterion R ln 2 is a measure of the agreement between simulations and observations emphasising low-flow conditions. When the logarithms are found, discrepancies between modelled and observed discharge during peak flows exert less impact on its numerical value. On Storglaciären, peak flows involve two uncertainties: first, the gauging stations could not be calibrated for high water flows, leading to much uncertainty of the measured hydro-graphs during such periods; secondly, flood events are to a large extent induced by heavy rainfall. Precipitation measurements and interpolation can be subject to large errors, introducing much uncertainty into modelled hydrographs, independent of the performance of the melt model. Therefore, here both R 2 and R ln 2 were considered for model evaluation. In addition, graphical inspection of the discharge hydrographs was considered important.
Melt simulations were evaluated using the criteria Y 1 and Y 2 based on the differences between simulated M s and measured melt M m at each ablation stake on the glacier:


where the bar refers to the mean, and n to the number of ablation stakes. The numerical criteria defined in Equations (7)–(10) were also used to optimise the model parameters DDFsnow/ice, MF and a snow/ice (Equations (1), (2) and (5)). Optimisation was achieved by varying the parameters until optimal agreement between simulations and observations was obtained. The 1994 data were used for optimisation. The parameters obtained were then applied to the 1993 dataset without any alterations.
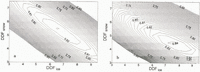
Optimisation involved two steps. First the agreement between simulated and observed discharge was maximized. In Figure 4, R 2 and R ln 2 values are mapped as a function of DDFice and DDFsnow (model 1), in order to isolate optimal parameter values. The results are not unambiguous. The response surfaces are very flat in the larger vicinity of peak values, indicating that parameters are not well defined. Comparable results can be achieved by a large variety of parameter sets. In addition, physically unreasonable combinations (e.g. sets with DDFsnow exceeding DDFice) also lead to large R 2 values. The optimal parameter set using R 2 as numerical criteria differs considerably from the one using R ln 2. Highest-efficiency R 2 is obtained using DDFsnow = 5.5 and DDFice = 6.5, whereas peak R ln 2 results from DDFsnow = 4.5 and DDFice = 7.5, with the mail mm d-1 °C-1 (Fig. 4).
Both parameter sets lead to considerable overestimation of cumulative meltwater equivalents, yielding on average 1.52 and 1.46 m, respectively, for the period considered in 1994 (5 July–25 August). Total summer ablation, however, amounted lo only 1.43 m, of which roughly 1.1–1.2 m melted during the period considered. The same was true for models 2 and 3. Parameter sets yielding model efficiencies R 2 and R ln 2 exceeding 0.8 could be found, but these tended to overestimate melt.
Variation of the efficiency criteria R2 (a) and Rln 2 (b) as a function of degree-day factors for snow, DDFsnow, and ice, DDFice (mm d-1 °C-1). Contour lines are plotted at 0.005 intervals.

The problem of finding unambiguous calibrations of parameters poses a problem, in particular, in glaciated areas, because glaciers represent unlimited sources or storages of water. For instance, an underestimation of rain could be compensated for by increased melt. Thus, good discharge results can be obtained, although intermediate results are modelled incorrectly. As a solution, Reference Braun and AellenBraun and Aellen (1990) constrained the parameters by means of specific net balance data in addition to discharge data. Reference MooreMoore (1993) used glacial equilibrium lines or transient glacial snowlines to tune model parameters. Here, in a second step, the ablation measurements were used to constrain the parameters, so that good agreement was achieved both between simulated and observed melt and between simulated and observed discharge. Thus, optimised parameters are given in Table 1.

5. Results
5.1. Discharge simulations
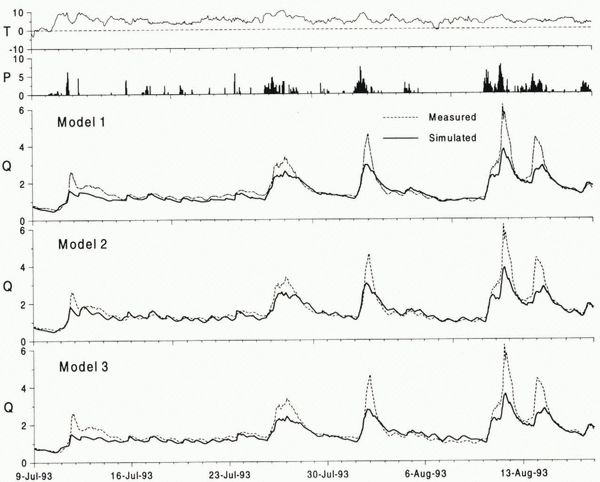
Simulated and observed discharge hydrographs are given in Figures 5 and 6. The statistics are listed in Table 2. Computing melt from the classical degree-day method yields a good simulation of the seasonal pattern of discharge, but the diurnal discharge fluctuations are hardly reflected by the model. Clearly, the daily temperature fluctuations are not sufficient lo account for the daily cycles in meltwater production, as discussed from a theoretical point of view by Reference Lang and BraunLang and Braun (1990).
Model 2 including potential clear-sky direct solar radiation considerably improves the discharge simulations as judged from the R 2 efficiency criteria (Table 2) and particularly from visual inspection of the discharge hydrographs (Figs 5 and 6). In contrast lo the previous model, the new-method produces pronounced diurnal discharge cycles. This strong qualitative improvement in model performance is also quantitatively supported by higher R 2 values. The improvement is more readily delectable in the 1994 hydrograph, since melt-induced discharge cycles prevailed. In contrast, the 1993 discharge regime was dominated by a few rain-induced peaks. Model 3 incorporating global radiation docs not lead to further improvement of discharge results. The efficiency criteria are even lower compared to the results of model 2 (Table 2). The reduction ?f direct radiation during cloudy conditions may have been at least partly compensated for by an increase in longwave radiation balance.
Whereas, in general, the amplitudes of the daily discharge cycles can be modelled well by models 2 and 3, they tend to be underestimated during the main ablation period in 1994 (end of July to beginning of August). The underestimation, although to a lesser extent, has also been observed by Reference Hock and NoetzliHock and Noetzli (1997), applying an energy-balance model to the dataset. Part of the error is attributed to the assumption of constant storage parameters of the linear reservoirs (Equation (6)). The storage parameters are expected lo vary with discharge and with time (Reference GurnellGurnell, 1993), since the internal glacier drainage system evolves as the melt season progresses (Reference Röthlisberger, Lang and ClarkRöthlisberger and Lang, 1987).
Simulated cumulative discharge volumes are underestimated by all models (Table 2). The discharge hydrographs reveal that the errors are mainly due to underestimation of flood flows. This is to a large extent attributed to the uncertainties concerning the calibration of the gauging stations under flood-flow conditions and potential underestimation of precipitation.
5.2. Melt modelling
Simulated and observed meltwater equivalents at the ablation stakes are compared in Figure 7. The simulations represent the spatial means of 30 m by 30 m gridcells, whereas the stake measurements refer to an individual point inside each of these areas. Considering the simplicity of the melt models, there is a fair agreement between measured and simulated meltwater equivalents, although the parameter sets obtained from the 1994 data tend to underestimate the larger meltwater amounts in 1993. This error may be attributed to the different weather characteristics of the optimisation and the verification year, characterised by predominantly dry and sunny weather in 1994 and rainy and overcast conditions in 1993. The melt parameters will vary according to the relative contributions of the energy-balance components, and their relative importance varies with weather conditions.
Simulated and measured mean hourly discharge Q (m3 s-1) of Storglaciären, precipitation P (mm h-1) and air temperature T (°C) at station B (Fig. 1) for the period 11 July–6 September 1994 (calibration year) using models 1–3.

The measured summer balance in 1993 obtained between 22 May and 17 September amounted to 1.25 m (Reference Holmlund, Karlén and GruddHolmlund and others, 1996), of which only approximately 1.21 m melted during the period calculated (7 June–17 September). Simulations of areal melt rates agree well with this value, although there is a tendency for areal melt to be underestimated by all models (Table. 2).
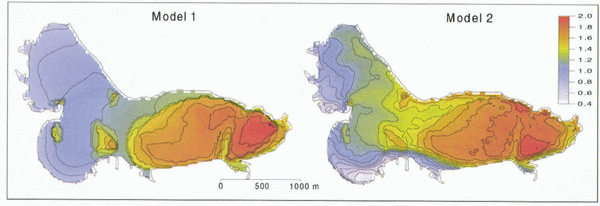
The spatial distribution of cumulated melt is given in Figure 8, comparing the results of models 1 and 2. Using the classical degree-day method (model 1), spatial variations in melt rates are relatively uniform, only resulting from the temperature lapse rate and the differences in surface conditions (snow or ice). Topographic effects are not considered by definition (Equation (1)), as the degree-day factor is constant in space for the same surface type (snow or ice). Model 2 including potential direct solar radiation gives a more realistic pattern of melt rates. For example, melt rates on south-facing slopes exceed those on north-facing slopes, as would be expected. The effects of topography are considered in terms of potential direct solar radiation (Equation (2)), which depends on slope and aspect angles and topographic shading.
5.3. Modelled degree-day factors
The spatial and daily variability of the degree-day factor is investigated by modelling degree-day factors from the melt obtained from an energy-balance model described in detail in Reference Hock and NoetzliHock and Noetzli (1997). For every hour and each grid-cell, inch obtained as the residual in the energy-balance equation was divided by the interpolated positive air temperature. Thus obtained theoretical hourly degree-day factors represent the factors needed to yield the same amount of melt as obtained front the energy-balance model. Melt rates modelled by the energy-balance model were in good agreement with measurements (Reference Hock and NoetzliHock and Noetzli, 1997), justifying the assumption that any deviations are sufficiently small to allow for this procedure. Smaller deviations would not matter for the sake of the present argument. In Figure 9 the spatial patterns of modelled degree-day factors are shown for 6 hours on 7 July 1994, a clear day.
Results clearly show that the degree-day factors vary considerably in space and time. Temporally, the factors are subject lo distinct daily cycles, with peak values exceeding 15 mm d-1 °C-1 at some gridcells. Values approach zero during night, although air temperatures exceed 5°C during most night hours on this particular day. This finding is in agreement with Reference Singh and KumarSingh and Kumar (1996), who found diurnal cycles of snowmelt factors ranging front 0 to 14 mm d-1 °C-1 on a Himalayan glacier during 3 days. The pattern in Figure 9 also clarifies why constant degree-day factors do not work on an hourly time-scale. The assumption of a constant degree-day factor will tend to overestimate melt at night and underestimate melt during daytime, resulting in considerable underestimation of daily amplitudes in melt rates.
Simulated and measured mean hourly discharge Q (m3 s-1) of Storglaciären, precipitation P (mm h-1) and air temperature T (°C) at station B (Fig. 1) for the period 9 July–17 August 1993 (verification year) using models 1–3.

Spatially, large variations occur within very short distances, clearly reflecting the effects of topography on melt rates. The daily cyclicity and the spatial variability of the modelled degree-day factors correspond to the temporal and spatial pattern of potential clear-sky direct solar radiation (Figs 2 and 3). This similarity is exploited in the new temperature-index model that includes potential direct solar radiation (Equation (2)) and provides its “physical basis”.

Time-averaged degree-day factors obtained from the ablation and temperature measurements at the climate stations on Storglaciären are listed in Table 3. The values lie within the range reported from other glaciers. These are generally derived from cumulative positive air temperatures over periods of days to months and lend to vary from 2 to 7 mm d-1 °C-1 over snow and 5 to 11 mm d-1 °C-1 over ice surfaces (for summary, see Reference BraithwaiteBraithwaite, 1995).
Direct comparison of measured values with the ones applied in lumped degree-day models, however, is limited. The latter replace a spatially variable function by their areal mean. Thus, such degree-day factors refer to spatial averages, whereas the degree-day factors derived from measurements are point values and these vary strongly from site to site as illustrated in Figure 9. As a consequence, derivation of degree-day factors for spatially lumped degree-day models from point measurements or, vice versa, the use of point measurements to verify or tune such models (e.g. Reference Braun, Grabs and RanaBraun and others, 1993; Reference Hottelet, Braun, Leibundgut and RiegHottelet and others, 1993) must be treated with caution. A measurement site will seldom be representative of the spatial average, considering the enormous spatial variability of the degree-day factors. This applies in particular to high-mountainous regions, where melt rates and degree-day factors very considerably in space.

Measured vs simulated water-equivalent melt (m) at the ablution stakes on Storglaciären, 5 July–25 August 1994 (calibration year) and 7 June–17 September 1993 (verification year), using the temperature-index models defined in Equations (1), (2) and (5).

6. Conclusions
Temperature-index models are widely used due to a lack of data for the alternative energy-balance approach. Modelling discharge of Storglaciären during two summers based on the classical degree-day approach yielded a fair agreement between simulated and measured discharge hydrographs on a seasonal basis. However, the approach proved to be inappropriate for modelling the diurnal discharge fluctuations typical of glacial discharge regimes. Clearly, daily amplitudes of melt rates considerably exceed the daily amplitudes of air temperature. In addition, by definition, the topographic effects on melt of slope, aspect and shading are not considered, yielding an unrealistic areal distribution of melt rates in complex terrain. Computing degree-day factors for every hour and for each gridcell of the glacier from inch obtained from an energy-balance model showed that the degree-day factors are subject to both considerable diurnal and spatial variations. This implies that melt rates calculated from spatially lumped models using the classical degree-day approach cannot be verified by measurements at the site scale.
A new grid-based temperature-index model (Equation (2)) is suggested, including potential clear-sky direct solar radiation at the surface in an empirical way, thus considering the daily cyclicity of melt rates and the geometric effects on melt attributable to terrain. The approach exploits the fact that potential direct solar radiation is subject to a pronounced daily cyclicity and to a large spatial variability. This variability corresponds to the typical daily and spatial patterns of melt rates. Thus, allowing the degree-day factor to vary according to potential direct solar radiation permits both a belter simulation of the diurnal melt cycles and a belter simulation of the spatial variability of melt rates in complex topography. It is emphasised that the new approach docs not need data other than air temperature, as potential direct solar radiation is merely computed from solar geometry and topography.
The model provides an alternative to methods based on heat flux, if the spatial distribution or sub-diurnal cycles of melt rates are of interest but the meteorological data are restricted. It represents a major improvement on the classical degree-day method, allowing for high-resolution modelling of melt rates with respect to both spare and time, and yet is based solely on air temperature as meteorological input variable. For instance, the new approach may provide the melt input to short-term runoff forecasts in glacierized or snow-covered basins, if sub-diurnal time-steps are needed. It may also improve the spatial representation of melt rates in ice-flow models, particularly when melt rates are affected by topographic effects. Although the model assumes clear-sky conditions, the incorporation ?f measured global radiation to account for the effect of reduced direct radiation under cloudy conditions did not improve results.
Simulated cumulative areal meltwater equivalent (m) of Storglaciären, 5 July–25 August 1994, using models 1 and 2. Areas of increased melt correspond to the areas where ice is exposed.

Modelled hourly degree-day factors (mm d-1 °C-1) on Storglaciären for 6 hours on 7 July 1994. The well-defined areas of increased degree-day factors on the glacier tongue correspond to the areas where the ice is exposed.

Acknowledgements
The staff of the Tarfala research station are gratefully acknowledged for their support during the fieldwork and for providing mass-balance data for Storglaciären. H. Blatter, T. Konzelmann, H. Lang and D. MacAyeal made valuable comments on the manuscript. K. Schroff prepared the meteorological instrumentation. J. Schulla provided his shading routine and C. Schneider provided the DEM. The work was financed by the Swiss National Foundation for Scientific Research (grant No. 2100-037839.93). The fieldwork on Storglaciären was supported by the “Kommission für Reisestipendien der Schweizerischen Akademie der Naturwissenschaften”.