Introduction
Psychosis is the defining characteristic of schizophrenia-spectrum disorder, although psychotic symptoms are encountered across the wider range of major mental disorder (World Health Organisation, 2010) and in the general population (Nazroo, Reference Nazroo1997; Johns et al. Reference Johns, Nazroo, Bebbington and Kuipers2002; King et al. Reference King, Nazroo, Weich, McKenzie, Bhui and Karlsen2005; Vanheusden et al. Reference Vanheusden, Mulder, van der Ende, Selten, van Lenthe and Verhulst2008; Nuevo et al. Reference Nuevo, Chatterji, Verdes, Naidoo, Arango and Ayuso-Mateos2012; Cohen & Marino, Reference Cohen and Marino2013). It is a mental state characterised by distortions in thought and perception and inappropriate affect, which may involve hallucinations, delusions, excessive and unwanted suspicions, or abnormalities of behaviour (World Health Organisation).
The expression of psychosis may vary with cultural background (Adebimpe et al. Reference Adebimpe, Klein and Fried1981; Littlewood & Lipsedge, Reference Littlewood and Lipsedge1981; Radhakrishnan et al. Reference Radhakrishnan, Mathew, Richard and Verghese1983; Chu et al. Reference Chu, Sallach, Zakeria and Klein1985; Maslowski et al. Reference Maslowski, Jansen van Rensburg and Mthoko1998; Weisman et al. Reference Weisman, Lopez, Ventura, Nuechterlein, Goldstein and Hwang2000; Suhail & Cochrane, Reference Suhail and Cochrane2002; Barrio et al. Reference Barrio, Yamada, Atuel, Hough, Yee and Berthot2003; Arnold et al. Reference Arnold, Keck, Collins, Wilson, Fleck and Corey2004; Yamada et al. Reference Yamada, Barrio, Morrison, Sewell and Jeste2006; Thomas et al. Reference Thomas, Mathur, Gottesman, Nagpal, Nimgaonkar and Deshpande2007; Bauer et al. Reference Bauer, Schanda, Karakula, Olajossy-Hilkesberger, Rudaleviciene and Okribelashvili2011; Chang et al. Reference Chang, Newman, D'Antonio, McKelvey and Serper2011). There may be cultural differences in the content of psychotic symptoms (Maslowski et al. Reference Maslowski, Jansen van Rensburg and Mthoko1998; Weisman et al. Reference Weisman, Lopez, Ventura, Nuechterlein, Goldstein and Hwang2000; Yamada et al. Reference Yamada, Barrio, Morrison, Sewell and Jeste2006; Viswanath & Chaturvedi, Reference Viswanath and Chaturvedi2012) and/or in the language with which these symptoms are expressed (Kleinman, Reference Kleinman1987). In addition, the onset and expression of psychosis may be influenced by social context, as suggested by the higher prevalence of paranoid symptoms among ethnic minorities diagnosed with psychosis in Western countries (Littlewood & Lipsedge, Reference Littlewood and Lipsedge1981; Kendler, Reference Kendler1982; Fabrega et al. Reference Fabrega, Mulsant, Rifai, Sweet, Pasternak and Ulrich1994; Whaley, Reference Whaley1998; Suhail & Cochrane, Reference Suhail and Cochrane2002; Barrio et al. Reference Barrio, Yamada, Atuel, Hough, Yee and Berthot2003; Veling et al. Reference Veling, Selten, Mackenbach and Hoek2007). These issues complicate the monitoring of psychosis risk as it becomes uncertain whether group differences in symptom prevalence reflect underlying differences in levels of mental ill-health, or whether they are a consequence of the way in which groups with different ethnic or cultural backgrounds interact with the diagnostic assessment or screening instruments.
Population-based studies of ethnic variation in psychosis risk have relied on the assumption that self-reported symptoms reflect levels of mental ill-health in equivalent ways across groups (Nazroo, Reference Nazroo1997; Johns et al. Reference Johns, Nazroo, Bebbington and Kuipers2002; King et al. Reference King, Nazroo, Weich, McKenzie, Bhui and Karlsen2005; Vanheusden et al. Reference Vanheusden, Mulder, van der Ende, Selten, van Lenthe and Verhulst2008; Cohen & Marino, Reference Cohen and Marino2013). This assumption, however, is rarely tested explicitly, so much of the evidence pertaining to ethnic variation in psychosis risk, therefore, remains limited by the possibility of ethnic or cultural bias.
We examined data from two existing epidemiological studies to formally test the assumption of cross-ethnic equivalence through an analysis of measurement non-invariance in response provided to the Psychosis Screening Questionnaire (PSQ). Furthermore, we sought to compare ethnic differences based on observed PSQ response with differences based on latent variable means to illustrate the potential implications of assuming psychometric equivalence of the PSQ in a cross-ethnic context.
Our aims were to: (1) examine ethnic differences in the prevalence of self-reported psychotic symptoms; (2) compare across ethnic groups the measurement properties of the PSQ; and (3) evaluate ethnic differences in observed and latent response patterns, considering potential ethnic biases in PSQ screening response.
Methods
Study population
This study uses data from the Fourth National Survey of Ethnic Minorities (FNSEM: conducted during 1993/4 in England and Wales, n = 8207) (Modood et al. Reference Modood, Berthoud, Lakey, Nazroo, Smith and Virdee1997) and the Ethnic Minority Psychiatric Illness Rates in the Community study (EMPIRIC: conducted during 2000/1 in England, n = 4281) (Sproston & Nazroo, Reference Sproston and Nazroo2002; UK Data Archive). The FNSEM employed a multistage stratified random sample using the Postcode Address File (PAF) as a sampling frame and contains within it a boosted sample of ethnic minorities. EMPIRIC consists of a random subset of White British individuals recruited into the 1998 Health Survey for England (HSE) (King et al. Reference King, Nazroo, Weich, McKenzie, Bhui and Karlsen2005) and all individuals recruited into the 1999 HSE (Erens et al. Reference Erens, Primatesta and Prior2001) who had agreed to be contacted for further interviewing (Sproston & Nazroo, Reference Sproston and Nazroo2002). The 1999 HSE contained a boosted sample of ethnic minorities, and both the 1998 and 1999 HSE employed similar sampling strategies to the FNSEM. Given similarities in design, coverage of the same groups and use of identical measures, we were able to combine FNSEM and EMPIRIC to obtain a uniquely powered population-based sample of White British and ethnic minority groups in England and Wales. Further details on the construction of our study population are provided in an online supplement (online Supplement 1).
We excluded individuals with missing data on ethnicity (n = 263) and Chinese individuals (n = 214) as a preliminary screening of the items suggested symptom prevalence in this group was too low for the purpose of our study. This left a sample of n = 12 011 individuals, of whom n = 3467 identified as White British; n = 851 as White Irish; n = 1899 as Caribbean; n = 2590 as Indian; n = 1956 as Pakistani; and n = 1248 as Bangladeshi.
Psychotic symptoms
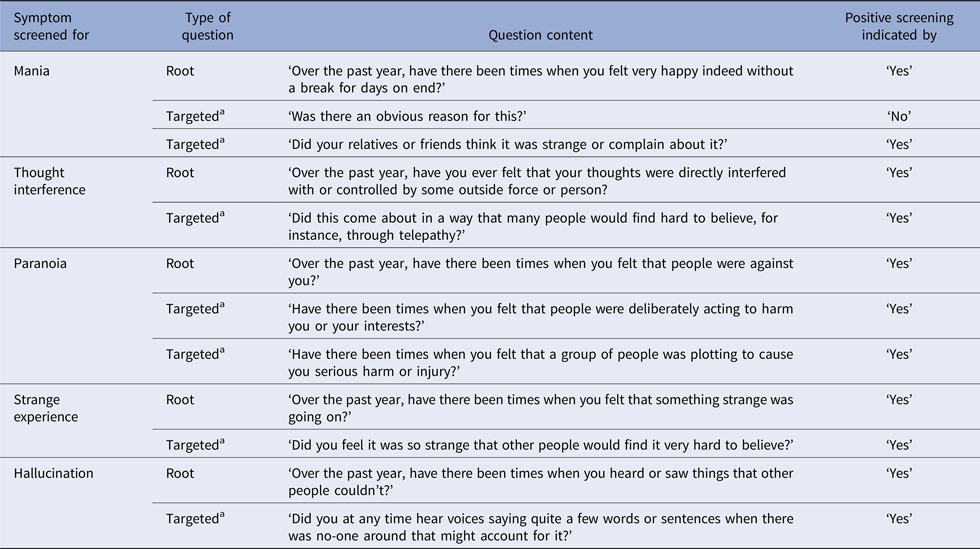
We assessed the presence of five self-reported psychotic symptoms (mania, thought interference, paranoia, strange experience, hallucination) using the PSQ (Bebbington & Nayani, Reference Bebbington and Nayani1995). Each was assessed with a root question to assess the presence of psychosis-like experience, and one or two targeted questions to corroborate the experience as being symptomatic to psychosis (Table 1).
The psychosis screening questionnaire

a Targeted questions were only asked in case of positive response to the root question.
We derived a dichotomous measure for each of the five symptoms, capturing endorsement of the root and targeted questions. In addition to these five dichotomous measures, we constructed a composite screening measure capturing response across all five symptoms (0 = negative on all; 1 = positive on any). We excluded 156 individuals (1.3%) with missing values on PSQ screening variables.
Measurement model
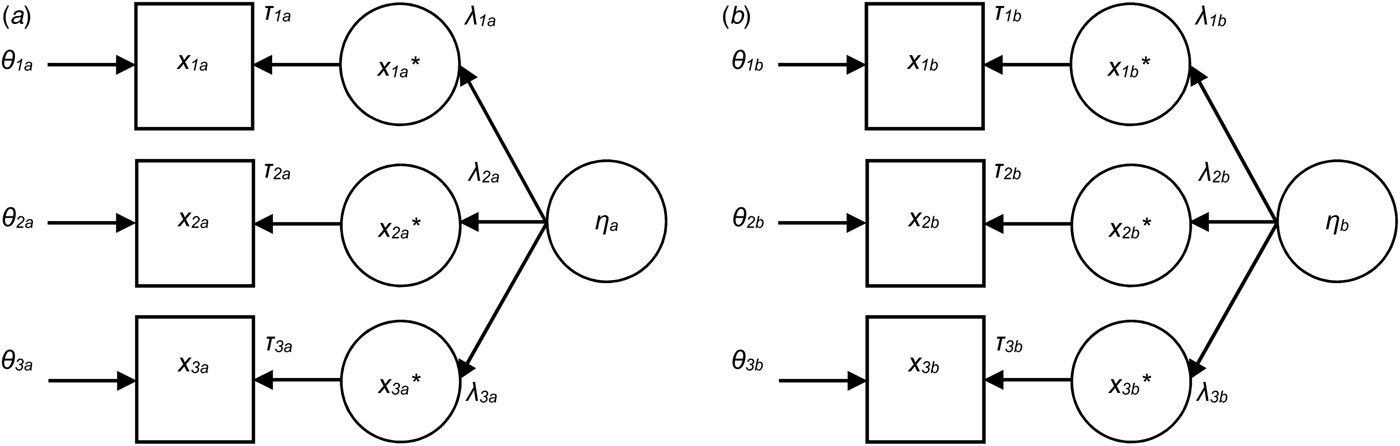
Measurement models assume that a set of observed (or manifest) variables can be considered a proxy for an unobserved (or latent) variable that may be of primary interest to the researcher. Latent variables are assumed to cause manifest variables in the same way that having poor mental health (a latent trait) may cause one to report symptoms (a manifest response). As latent variables cannot be directly observed, they are instead inferred from patterns of correlation among the manifest variables. Given our use of categorical data, we employed a continuous latent response model (Millsap & Yun-Tein, Reference Millsap and Yun-Tein2004) assuming that observed dichotomous variable [x] is determined by unobserved scores on a latent continuous response variable [x*], which itself is determined by an unobserved score on latent construct [η]. This recognises that, while symptoms are typically recorded as dichotomous traits (i.e. absence v. presence), the underlying experience of symptoms may follow a continuous distribution, in which only a sufficient amount of latent continuous response [x*] would result in positive response on the manifest variable [x]. Furthermore, the specification of a latent variable [η] in relation to multiple latent continuous response variables [x*] allows for a conceptual distinction between an underlying cause of mental ill-health (e.g. psychosis) and the symptoms ensuing from this cause (e.g. hallucination).
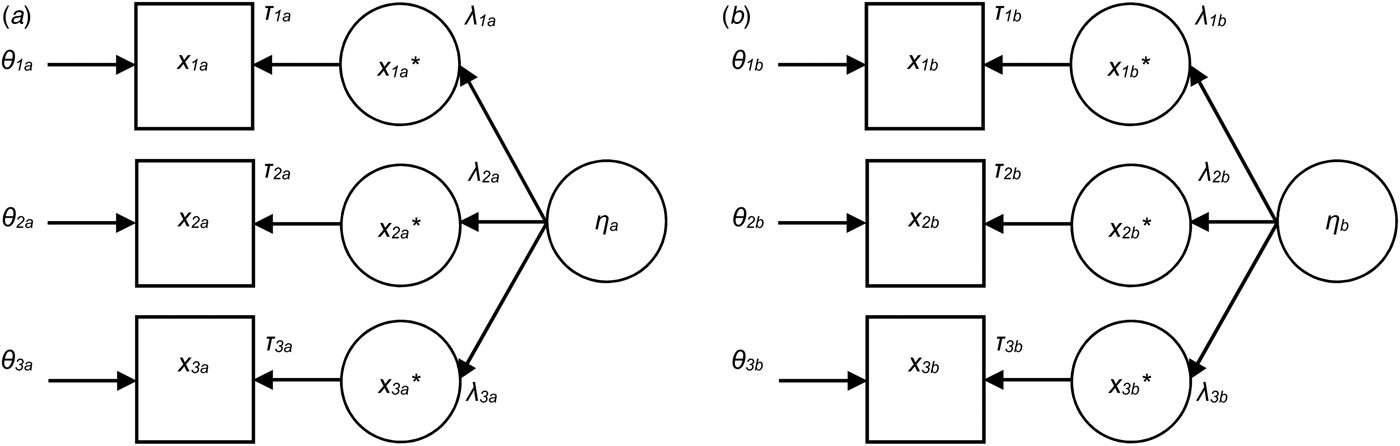
We illustrate this conceptual model in Fig. 1a. Latent variable [η a] is assumed to cause three continuous latent response variables [x 1a*, x 2a*, x 3a*], with the strength of these associations captured by factor loadings [λ 1a, λ 2a, λ 3a]. The continuous latent response variables then, in turn, cause positive response on manifest variables [x 1a, x 2a, x 3a] when the level of latent continuous response exceeds the value of item-specific response thresholds [τ 1a, τ 2a, τ 3a]. Furthermore, variation in the manifest variables that cannot be accounted for by the continuous latent response variables is captured as residual variance [θ 1a, θ 2a, θ 3a]. It is worth emphasising that a factor loading may, therefore, be thought of as a measure of strength of association between the latent trait and a latent continuous response variable; the response threshold as the level of latent continuous response required for endorsement of the manifest variable; and the residual variance as a measure of the reliability with which a manifest variable captures the latent continuous response variable (i.e. with smaller residual variance equalling greater reliability).
Example of a continuous latent response model with three manifest variables and a single latent variable, tested simultaneously in two groups. Notes: Groups are denoted by subscripts [a] and [b]. Manifest variables are represented by [x 1, x 2, x 3] in squares. Latent continuous response variables are represented by [x 1*, x 2* and x 3*] in circles. Latent trait variables are represented by [η] in circles. The relationship of latent trait [η a] with latent response variable [x 1a*] is denoted by factor loading [λ 1a]. The level of latent response [x 1a*] at which positive response to manifest variable [x 1a] is likely to occur is denoted by response threshold [τ 1a]. Residual variance in observed measure [x 1a] is denoted by [θ 1a].
Measurement non-invariance
The application of a continuous latent response model to a multiple-group setting enables the comparison of model parameters across groups (Fig. 1a and b). Specifically, comparing factor loadings, response thresholds and residual variances across groups can inform the researcher about group differences in terms of (i) the strength of association of the latent trait with the latent continuous response variables, (ii) levels of latent continuous response at which the manifest variables are endorsed, and (iii) the reliability with which the manifest variables capture the latent continuous response variables. Conversely, the equality of factor loadings, response thresholds and residual variances implies that an item is psychometrically equivalent in the groups under study.
The procedure of testing for measurement non-invariance involves the specification of a hierarchical sequence of measurement models imposing increasingly strict equality constraints on model parameters across groups. More restrictive models are then compared with less restrictive counterparts in terms of fit to the data. We examined measurement non-invariance across three levels: (1) Configural invariance requires that the manifest variables measure the same latent trait in each of the groups, but does not require equality of factor loadings or response thresholds. For purposes of model identification, the factor means are fixed to zero and item residual variances fixed to one (Muthén & Muthén, Reference Muthén and Muthén1998–2010). (2) Strong factorial invariance requires that the manifest variables measure the same latent trait in each of the groups, as well as equality of factor loadings and item response thresholds. For model identification, the factor mean is fixed to zero and residual variances are fixed to one in the reference group, while means and residual variances are allowed to vary in other groups (Muthén & Muthén, Reference Muthén and Muthén1998–2010). (3) Strict factorial invariance poses an additional constraint on the residual variances (by fixing them to one across groups), while fixing the latent mean to zero in the reference group and allowing the latent means to vary in the other groups. Conditions of partial measurement non-invariance can exist where not all items meet a given set of invariance assumptions.
Our motivation to identify the strictest possible condition of measurement invariance (including conditions of partial invariance) was to minimise the risk of bias in the comparison of latent means. Although there is a view that strict factorial invariance may not be necessary for the comparison of latent factor means, the debate around this issue is ongoing. There are conditions under which models assuming strong factorial invariance can produce biased latent mean estimates (Lubke & Dolan, Reference Lubke and Dolan2003; Deshon, Reference Deshon2004; Wu et al. Reference Wu, Li and Zumbo2007) and it has been recommended that researchers use their discretion on whether testing for strict factorial is necessary (Vandenberg & Lance, Reference Vandenberg and Lance2000).
Factor structure, goodness-of-fit and difference testing
To investigate the latent dimensionality of the PSQ, we used Stata 12.1/SE (StataCorp, 2011) to randomly divide our study population (n = 12 011) into two subsets (Set 1: n = 6040/Set 2: n = 5971) and checked that these were broadly similar in terms of ethnic composition. Using Mplus 6.12 (Muthén & Muthén, Reference Muthén and Muthén1998–2010), we explored the latent structure of the PSQ in our study population using the Set 1 data and then tested this latent structure with a confirmatory factor analysis (CFA) of the Set 2 data. The fit of these models was assessed with the χ2 test of overall model fit (good fit indicated by [0 ⩽ χ2 ⩽ 2df] (Byrne, Reference Byrne1991); acceptable fit by [2df ⩽ χ2 ⩽ 3df] (Carmines & McIver, Reference Carmines, McIver, Bohrnstedt and Borgatta1981)); the root mean square error of approximation (good fit indicated by RMSEA < 0.06) (Hu & Bentler, Reference Hu and Bentler1999); and the comparative fit index (good fit indicated by CFI ⩾ 0.95; acceptable fit by CFI ⩾ 0.90) (Bentler, Reference Bentler1990; Hu & Bentler, Reference Hu and Bentler1999). To determine whether the identified factor structure was appropriate for the groups under study, we examined the fit of group-specific CFAs using the same fit statistics (online Supplement 2).
We then performed a sequence of multiple-group CFAs (Jöreskog, Reference Jöreskog1971) (Mplus syntax provided in online Supplement 3). First, we assessed the fit of a measurement model assuming configural invariance. A model assuming strong factorial invariance was then compared with the configural invariance model with a χ2 difference test to assess whether the imposed equality constraints on factor loadings and response thresholds had resulted in worse fit to the data. If strong factorial invariance was rejected (at p < 0.05), we identified the item with the largest modification indices for factor loadings and response thresholds across groups, released the equality constraints for these parameters, and compared the fit of a model assuming partial strong invariance with the configural invariance model. We repeated this procedure until a model with acceptable fit was identified. We then proceeded to test for strict factorial invariance against a model assuming (partial) strong invariance, again using a χ2 difference test to assess whether the additional constraints on residual variances had resulted in worse fit to the data. If strict factorial invariance was rejected in favour of (partial) strong invariance, we identified the item with the largest modification index for residual variances across groups, released the equality constraint on the residual variance parameter, and compared the fit of a model assuming partial strict invariance with the (partial) strong invariance model. Again, this procedure was repeated until a model with acceptable fit was identified.
Probability weighting
Both the FNS and EMPIRIC studies intentionally oversampled ethnic minority respondents to ensure sufficient numbers for comparison. Using UK Census data, we scaled the FNS and EMPIRC probability weights so that the ethnic composition of our study population was consistent with that of the population of England and Wales in 1991 (for FNS respondents) and with the population in England in 2001 (for EMPIRIC respondents). Details of our method are provided in an online supplement (online Supplement 4).
Sensitivity analyses
To assess the robustness of our findings against our choice of psychometric approach, we also examined the PSQ for measurement non-invariance using Multiple Indicators Multiple Causes (MIMIC) models (online Supplement 5). Rather than stratifying the study population by ethnicity and assessing the fit of a model simultaneously in multiple groups, MIMIC models examine the influence of ethnic group membership on the mean level of latent trait, which in turn is determined by the response on PSQ items. The assessment of measurement non-invariance is then performed by testing for the presence of direct effects of ethnicity on PSQ items, holding constant group differences in latent factor means. Conceptually, this can be thought of as an assessment of whether certain groups are more (or less) likely to endorse a given PSQ item, irrespective of their tendency to report psychotic symptoms per se. Within this framework, significant direct effects of ethnicity on observed PSQ items are interpreted as evidence for measurement non-invariance.
Results
Descriptive statistics
Compared with British whites (56% female), females were under-represented in Indian (51%), Pakistani (51%) and Bangladeshi groups (49%). Furthermore, respondents from Caribbean (mean age = 39.7 years [95% CI = 38.9–40.6]), Indian (39.1 [38.3–39.9]), Pakistani (34.6 [33.8–35.4]) and Bangladeshi groups (34.6 [33.7–35.6]) were on average younger than White British (44.7 [44.1–45.4]) and White Irish counterparts (43.5 [41.8–45.2]).
Ethnic differences in prevalence of self-reported symptoms
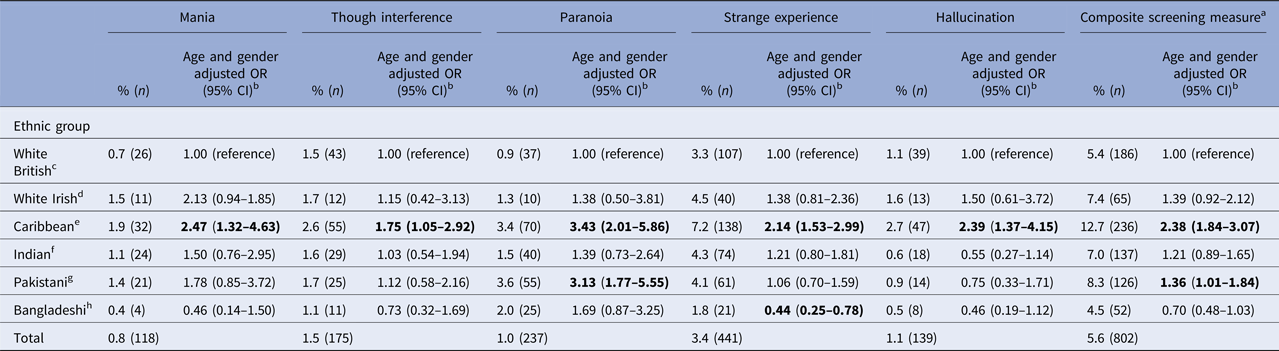
Approximately 5% of our study population reported psychotic experiences (Table 2). Prevalence was greatest among Caribbean individuals of whom 13% reported at least one psychotic symptom, compared with 5% of British Whites (age and sex-adjusted odds ratio [aOR] = 2.38 [1.84–3.07]). Prevalence in terms of the individual symptoms was also greatest among Caribbean individuals who, most notably, were more likely than British Whites to report paranoid symptoms (aOR = 3.43 [2.01–5.86]). Prevalence was also increased among Pakistani individuals, of whom 8% reported psychotic symptoms (aOR = 1.36 [1.01–1.84]). This difference, however, was largely driven by an excess in reporting paranoid symptoms (aOR = 3.13 [1.77–5.55]) and was not consistently observed in relation to other PSQ items. Risk of reporting psychotic symptoms was moderately increased in the Indian (7%, aOR = 1.21 [0.89–1.65]) and White Irish groups (7%, aOR = 1.39 [0.92–2.12]) compared with British Whites. The overall risk of reporting psychotic symptoms was moderately lower in the Bangladeshi group than among British Whites (5%, aOR = 0.70 [0.48–1.03]), despite being more likely to report paranoid symptoms (aOR = 1.69 [0.87–3.25]).
Ethnic differences in psychotic symptoms prevalence
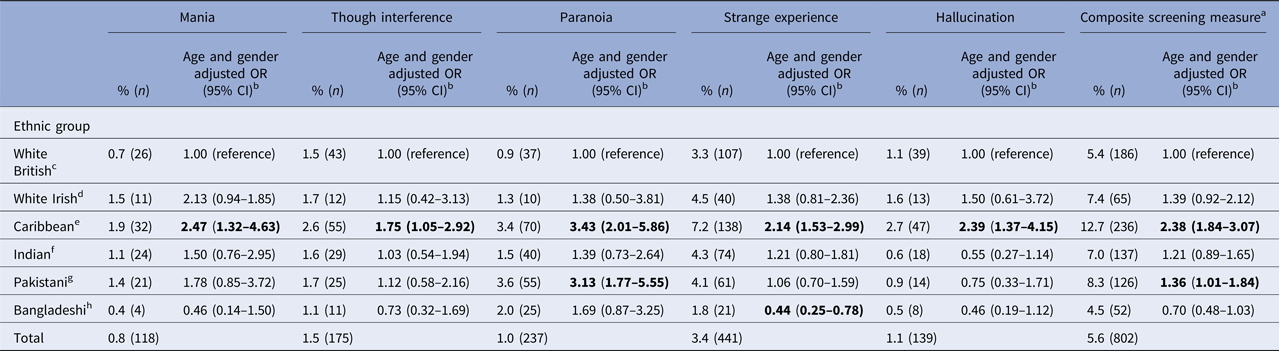
a Positive screening on any PSQ symptom.
b Odds ratio with 95% confidence interval.
c Reference group, N = 3444.
d N = 848.
e N = 1877.
f N = 2538.
g N = 1908.
h N = 1240.
Factor structure of the PSQ instrument
In an exploratory factor analysis (EFA) of the Set 1 data, we examined the scree plot and eigenvalues (online Supplement 6) as well as fit statistics and parameter estimates for a 1-factor solution (online Supplement 7). While the 1-factor solution provided good fit to the data (χ2 [df, p] = 5.38 [5, 0.37]; RMSEA = 0.004; CFI = 0.999), the mania item was only weakly associated with the latent factor (rotated factor loading [s.e.] = 0.09 [0.11]). Furthermore, Mplus statistical output for these analyses contained a warning that the cross-tabulations of the mania item with other PSQ items contained zero cells. As this implies a tetrachoric correlation of one, the mania item was therefore rendered unsuitable for use in multiple-group analyses based on tetrachoric correlation matrices, such as those reported in our study (Reference Muthen and MuthenMuthen & Muthen).
We then conducted a CFA of the Set 2 data, comparing a one-factor model which included the mania item with a one-factor model which did not (online Supplement 8). Again, the mania item was only weakly associated with the latent factor (standardised factor loading [s.e.] = 0.28 [0.14]), and when we excluded the mania item the fit of the model improved (CFA model including mania item: χ2 [df, p] = 15.64 [5, 0.008], RMSEA = 0.019, CFI = 0.937; CFA model excluding mania item: χ2 [df, p] = 2.41 [2, 0.299], RMSEA = 0.006, CFI = 0.997). We evaluated the fit of a one-factor solution in each of the groups (online Supplement 2) finding that the one-factor model without the mania item yielded good fit in the White British, White Irish, Caribbean, Pakistani groups and adequate fit in the Indian and Bangladeshi groups. However, we identified an additional zero cell in the cross-tabulation of the thought interference and hallucination items in the analysis of the Bangladeshi group. Given the choice to exclude an additional PSQ item from further analysis or the Bangladeshi group in its entirety, we chose the latter as we felt this would least impact on our inference from these data.
Psychometric comparison
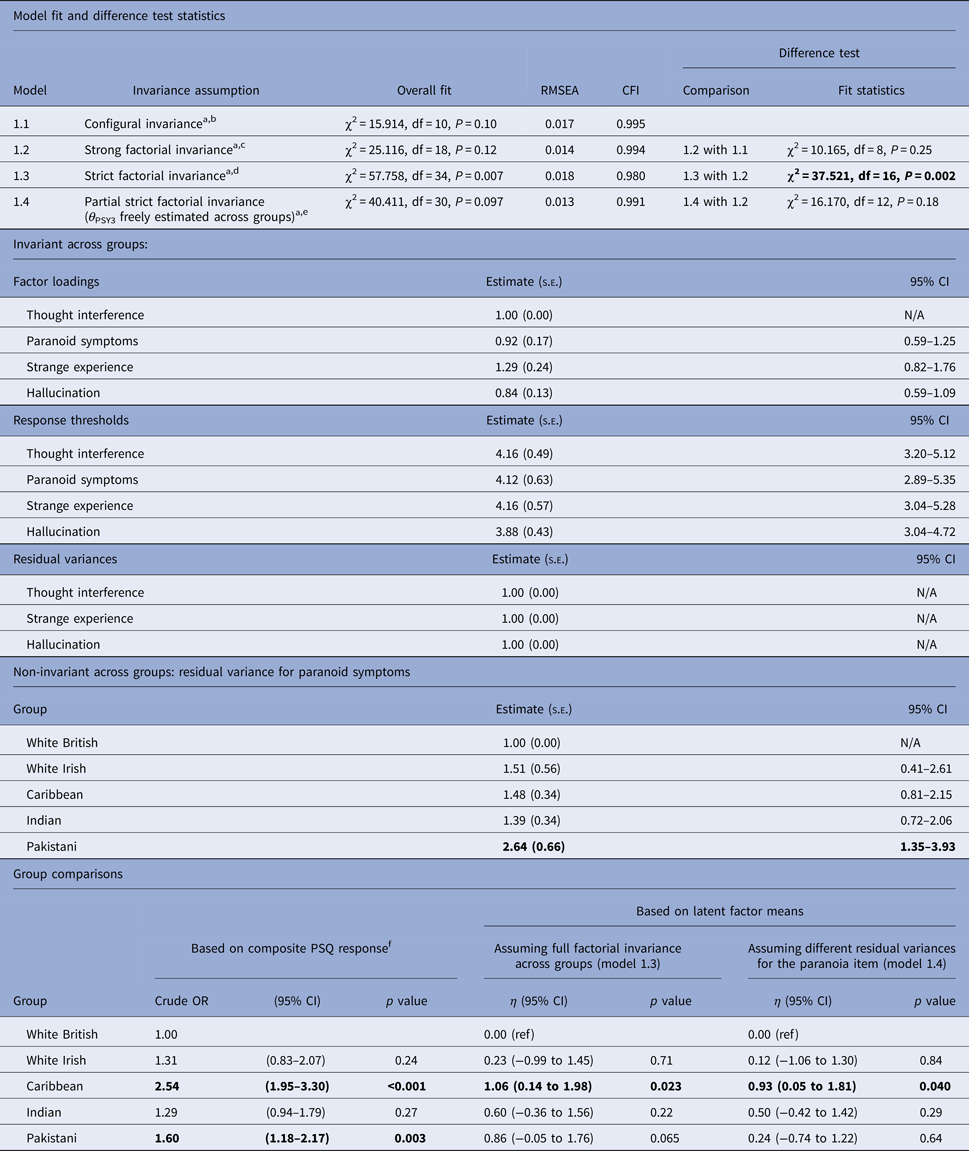
We then performed a sequence of multiple-group CFAs of four PSQ items (through interference, paranoia, strange experience and hallucination) across five groups (White British, White Irish, Caribbean, Indian and Pakistani) (Table 3). All multiple-group models provided a good fit to the data. The χ2 test of overall model fit was consistently within the 0 to 2df range, RMSEA statistics were below 0.06 and CFI statistics were above 0.95. Difference test statistics suggested a model assuming strong factorial invariance did not result in worse fit compared with the configural invariance model (model 1.2 difference test p value = 0.25). Our results, therefore, suggested that the item factor loadings and response thresholds were invariant across groups. However, placing further constraints on residual variances, the fit of the model deteriorated (model 1.3 difference test p value = 0.002). Examining modification indices for residual variances across groups, we identified the item measuring paranoid symptoms to be the largest source of measurement non-invariance. When we released the constraints on the residual variances for this item, a model assuming partial strict invariance provided an acceptable fit to the data compared with the strong factorial invariance model (model 1.4 difference test p value = 0.18). Compared with British Whites, the residual variance of the paranoia item was larger in the Pakistani group. We note that an investigation of our data with a MIMIC model produced a consistent result (see online Supplement 5).
Fit statistics and model results for multiple-group confirmatory factor analyses

a Factor loading for marker item thought interference fixed to 1 across groups.
b Factor loadings and response thresholds allowed to vary, residual variances fixed to 1 across groups.
c Factor loadings and response thresholds constrained to equality, residual variances fixed to 1 for British Whites but freely estimated in other groups.
d Factor loadings and response thresholds constrained to equality, residual variances fixed to 1 across groups.
e As model 1.3, but allowing the residual variances for paranoid symptoms to be freely estimated across groups.
f To ensure that group differences in manifest and latent response patterns were based on the same selection of PSQ items, we excluded the mania item from the composite screening measure.
g N = 10,615, of whom N = 3444 British Whites, N = 848 Irish Whites, N = 1877 Caribbeans, N = 2538 Indian, and N = 1908 Pakistani.
Group comparisons based on composite screening measures and latent means
We examined the potential impact of measurement non-invariance by comparing group differences based on PSQ composite screening response with group differences based on latent means obtained from our measurement models (Table 3). Furthermore, we compared latent mean differences based on a model which (erroneously) assumed strict factorial invariance (i.e. model 1.3) with those based on a model in which the different residual variances for the paranoia item across groups had been accounted for (i.e. model 1.4). Based on observed PSQ screening response, Pakistani (Crude OR 1.60 [1.18–2.17]) and Caribbean groups (Crude OR 2.54 [1.95–3.30]) were at greater odds of reporting psychotic symptoms compared with British Whites. However, group comparisons in terms of latent means suggested only the Caribbean group was at greater risk of experiencing psychotic symptoms, and that latent differences between Pakistani and White British groups were exaggerated when measurement non-invariance in the paranoia item was not accounted for. These findings may, therefore, signal problems with the validity of self-reported paranoid symptoms in the context of cross-ethnic psychosis research. We note that consistent results were found when we investigated our data with a MIMIC model (online Supplement 5).
Discussion
Our study examined ethnic differences in psychotic symptom prevalence and assessed the psychometric characteristics of the PSQ in a cross-ethnic context. There were four main findings. First, the Caribbean and Pakistani individuals were more likely than British Whites to report psychotic symptoms. However, while this risk was apparent across all PSQ items in the Caribbean group, risk among Pakistani appeared to be driven mainly by a greater likelihood of reporting paranoid symptoms. Second, our exploratory and confirmatory factor analyses revealed that the mania item was weakly associated with the latent factor and was therefore psychometrically distinct from other PSQ items. However, the lack of correlation between the mania item and other PSQ items may be unsurprising considering that the psychotic symptoms associated with mania are more likely to be congruent with elated mood and involve themes of grandeur rather than those of persecution or paranoia captured by the other PSQ items. Third, multiple-group CFAs suggested that the thought interference, strange experience and hallucination items were measured in fully equivalent ways across the groups under study. The paranoia item, however, captured the latent factor with greater residual variance among Pakistani respondents than among British Whites. Fourth, notwithstanding evidence for measurement non-invariance, Caribbean individuals were at greater risk of reporting symptoms and had higher levels of latent trait. The higher prevalence of self-reported psychotic symptoms among Caribbean individuals in our study population is therefore unlikely to be an artefact of measurement (Morgan et al. Reference Morgan, Charalambides, Hutchinson and Murray2010).
Our study adds to a growing body of research investigating the psychometric characteristics of screening instruments for psychosis-like experiences in cross-cultural settings. We investigated the psychometric properties of the PSQ simultaneously across several ethnic groups in a large UK population-based sample. This allowed the direct comparison of factor model parameters for groups who self-identified as having White British, White Irish, Caribbean, Indian, or Pakistani backgrounds.
There were several limitations. First, despite the large size of our study population, we were limited in the number of comparisons we were able to draw. Small group sizes and/or low symptom prevalence meant we were unable to test our models for Chinese and Bangladeshi groups or to evaluate potential measurement non-invariance in the mania item. Second, given the low prevalence of psychotic symptoms in our study population, the normality assumption for the latent variables may have been violated. Simulation studies have shown that tetrachoric correlations may overestimate associations between the underlying latent continuous response variables when the normality assumption for the latent variables does not hold, suggesting that our results may have exaggerated the true association between these symptoms in the general population (Flora & Curran, Reference Flora and Curran2004). Third, while noting that the clinical validity of the PSQ instrument has been evidenced for a subset of high-risk individuals within the FNSEM (Nazroo, Reference Nazroo1997), our data did not include diagnostic records and we were, therefore, unable to evaluate differences between ethnic groups in terms of the clinical relevance of PSQ items or latent factors. Fourth, we emphasise that our results are contingent on assuming the existence of a latent construct which caused the observed response on the PSQ in our study population. This assumption underlies all latent variable methods, including those used in psychometric assessment, and is untestable when objective markers for a disorder under investigation are not available or do not yet exist. It has recently been argued that if one were to relinquish the latent variable assumption, it would become possible to view the symptoms as being constitutive of disorder, rather than consequential to it (Borsboom & Cramer, Reference Borsboom and Cramer2013; McNally, Reference McNally2016). From this perspective, the paranoid symptoms reported by Pakistani respondents in our study population would have validity in their own right, rather than being merely a biased measure of an underlying latent construct. Further research is therefore needed to determine the clinical relevance of self-reported paranoid symptoms the context of cross-ethnic psychosis research.
Our results are consistent with prior evidence in finding a higher prevalence of paranoid symptoms in ethnic minority groups compared with a majority population (Littlewood & Lipsedge, Reference Littlewood and Lipsedge1981; Kendler, Reference Kendler1982; Fabrega et al. Reference Fabrega, Mulsant, Rifai, Sweet, Pasternak and Ulrich1994; Whaley, Reference Whaley1998; Suhail & Cochrane, Reference Suhail and Cochrane2002; Barrio et al. Reference Barrio, Yamada, Atuel, Hough, Yee and Berthot2003; Veling et al. Reference Veling, Selten, Mackenbach and Hoek2007). While it is difficult to appraise our findings in a field where only a few studies have been conducted to date, we propose that problems relating to the measurement of paranoid symptoms may arise specifically in the context of majority-minority relationships. Exposure to ethnic and racial inequalities may foster a ‘healthy’ cultural mistrust (Whaley, Reference Whaley1998) which then becomes conflated with the expression of paranoid symptoms when one is screened for psychosis, thus introducing noise into the measurement. Alternatively, it is possible that exposure to racial discrimination gives rise to true paranoid symptoms more readily than to other psychotic symptoms. In support of this, population-based evidence from the Netherlands suggests that exposure to discrimination at baseline is associated longitudinally with the first onset of delusional ideation, but not with the first onset of hallucinatory experience (Janssen et al. Reference Janssen, Hanssen, Bak, Bijl, de Graaf and Vollebergh2003). This, therefore, provides an alternative explanation for the excess in paranoid symptoms among the non-white ethnic groups included in our study population, and potentially for their differential association with the latent factor when compared with a White British reference population. For reasons discussed here, our findings warrant caution when assessing paranoid symptoms to proxy ethnic variation in psychosis risk within the context of major ethnic inequalities, although further research is needed to investigate the generalisability of these findings to other populations and screening instruments for psychosis.
Conclusions
PSQ items capturing thought interference, strange experience and hallucination were measured in fully equivalent ways across the ethnic groups included in our psychometric assessment, and may, therefore, be used to proxy ethnic variation in psychosis risk in our study population. The role of the paranoia item was less clear-cut. From a psychometric point of view, it provided a less reliable measure of variation in a latent trait between ethnic groups, which may signal problems with the validity of this item in a cross-ethnic context. Alternatively, it is possible that true paranoid symptoms are more prevalent than other psychotic symptoms in ethnic minority populations, which could explain their differential association with the latent trait under investigation in this study. Given our findings, we recommend that self-reported paranoid symptoms be investigated separately from other self-reported psychotic symptoms in future studies of ethnic variation in psychosis risk to appreciate more fully the social context in which these symptoms are reported.
Supplementary material
The supplementary material for this article can be found at https://doi.org/10.1017/S0033291718000399
Acknowledgements
This study was carried out as part of an ESRC funded PhD studentship.
Declaration of Interest
None.