


Introduction
Habitat loss is known to impact dispersal across habitats, which is vital for maintaining genetic diversity and for range shifts in response to environmental changes (Van der Stocken et al. Reference Van Der Stocken, Carroll, Menemenlis, Simard and Koedam2019a). Understanding the relationship between spatial and genetic structuring of populations is fundamental for developing effective conservation strategies that maintain habitat connectivity (Durrant et al. Reference Durrant, Burridge, Kelaher, Barrett, Edgar and Coleman2014, Taylor et al. Reference Taylor, Robertson, Carter and Ramstad2021, Wright et al. Reference Wright, Bishop, Matthee and Von Der Heyden2015), and this understanding is contingent on characterising dispersal capabilities.
One habitat type particularly vulnerable to habitat loss is mangrove forest, a type of intertidal wetland found along coastlines in tropical, sub-tropical and warm-temperate climates (Bryan-Brown et al. Reference Bryan-Brown, Connolly, Richards, Adame, Friess and Brown2020). Between 2000 and 2012, mangrove forests were lost at an average annual rate of 0.16% globally (Hamilton & Casey, Reference Hamilton and Casey2016), with rates of 0.18% in Southeast Asia (Richards & Friess, Reference Richards and Friess2016), 0.08% in Mexico and 0.05% in Brazil (Hamilton & Casey, Reference Hamilton and Casey2016). Across the globe, mangroves are threatened at the local and regional scales by aquaculture, agriculture, urban development and pollution, while simultaneously facing the broader scale threats of sea level rise and climate change. Mangrove forests are of exceptionally high ecological and economic value (estimated $194,000 per hectare per year, Costanza et al. Reference Costanza, de Groot, Sutton, van der Ploeg, Anderson, Kubiszewski, Farber and Turner2014) as they provide crucial ecosystem services. The provision of these services depends on the size and arrangement of forest patterns (Bryan-Brown et al. Reference Bryan-Brown, Connolly, Richards, Adame, Friess and Brown2020). Even in areas with low rates of mangrove loss, there is a global trend towards ubiquitous fragmentation, which can pose a threat to mangrove biodiversity (Bryan-Brown et al. Reference Bryan-Brown, Connolly, Richards, Adame, Friess and Brown2020). Therefore, there is a need to quantify the impact of fragmentation on mangrove biodiversity. The impacts of fragmentation on biodiversity can vary among species. Typically, species that cannot disperse widely are at greater risk of being negatively affected by fragmentation (Fletcher et al. Reference Fletcher, Didham, Banks-Leite, Barlow, Ewers, Rosindell, Holt, Gonzalez, Pardini, Damschen, Melo, Ries, Prevedello, Tscharntke, Laurance, Lovejoy and Haddad2018, Laurance, Reference Laurance1991, Ricketts, Reference Ricketts2001). In mangroves, the matrix between habitat patches is composed of water, which can be easily traversed by propagules, and human-modified land use, which cannot be colonised by mangroves. Therefore, to better understand how mangrove biodiversity could be impacted by fragmentation, it is important to understand the impacts of geographic distance on mangrove propagule dispersal.
Buoyant mangrove propagules have the capacity for long-distance dispersal by water because they remain viable for extended periods of time and can drift in ocean currents (Binks et al. Reference Binks, Byrne, McMahon, Pitt, Murray and Evans2019). This could be expected to lead to high connectivity between habitat patches, which could mean that increasing distance between patches would have little effect on genetic isolation. However, field studies have shown that mangrove propagules tend not to disperse far from their release point, leading to patterns of isolation-by-distance (Al-Qthanin & Alharbi, Reference Al-Qthanin and Alharbi2020, Binks et al. Reference Binks, Byrne, McMahon, Pitt, Murray and Evans2019, Clarke, Reference Clarke1993, Van der Stocken et al. Reference Van Der Stocken, Ryck, Vanschoenwinkel, Deboelpaep, Bouma, Dahdouh-Guebas and Koedam2015, Yan et al. Reference Yan, Duke and Sun2016). For instance, propagules of Avicennia marina, the world’s most widely distributed mangrove species, can remain viable in water for several months (Rabinowitz, Reference Rabinowitz1978). However, their obligate dispersal period, during which they float before developing roots for anchoring, is only around one week (Rabinowitz, Reference Rabinowitz1978). Once they land on suitable substrate, mangrove propagules can usually root and grow rapidly because many taxa exhibit viviparity, where the seed germinates while attached to the parent plant (Clarke, Reference Clarke1993, Ng & Sivasothi, Reference Ng and Sivasothi2001). These traits, combined with the risks of dispersal, could explain why mangrove propagules might tend to favour establishment near their release point (Binks et al. Reference Binks, Byrne, McMahon, Pitt, Murray and Evans2019, Clarke, Reference Clarke1993). Even in species with highly dispersive life history features, abiotic factors like ocean currents, coastal topography and habitat discontinuities can affect the realised dispersal distance (Binks et al. Reference Binks, Byrne, McMahon, Pitt, Murray and Evans2019, Cowen & Sponaugle, Reference Cowen and Sponaugle2009, Selkoe et al. Reference Selkoe, D’Aloia, Crandall, Iacchei, Liggins, Puritz, von der Heyden and Toonen2016).
Dispersal across habitats is essential for enabling gene flow and maintaining habitat connectivity. Measures of genetic distance such as Nei’s genetic distance (Nei, Reference Nei1972) and FST (Wright, Reference Wright1950) provide useful insights into the genetic structure and connectivity of a habitat (Bohonak, Reference Bohonak1999). If mangrove patches are more isolated from each other and propagules cannot disperse between them, there will likely be a larger pairwise genetic distance between these patches (Jaquiéry et al. Reference Jaquiéry, Broquet, Hirzel, Yearsley and Perrin2011). Therefore, this meta-analysis explores the effects of geographic distance on genetic distance in mangrove plants, with the aim of providing insight into the effect of patch isolation on genetic isolation in mangroves.
Methods
Systematic literature search and inclusion criteria
In May 2021, we conducted an extensive search of the relevant literature, following the preferred reporting items for systematic review and meta-analysis (PRISMA) statement, which provides a standardised framework for reporting systematic reviews and meta-analyses (Moher et al. Reference Moher, Liberati, Tetzlaff, Altman and Group2009). We used the following search terms in Web of Science and Scopus:
-
1. mangrove AND fragment* AND (‘genetic diversity’ OR ‘genetic differentiation’)
-
2. mangrove AND connect* AND (‘genetic diversity’ OR ‘genetic differentiation’)
-
3. mangrove AND isolat* AND (‘genetic diversity’ OR ‘genetic differentiation’)
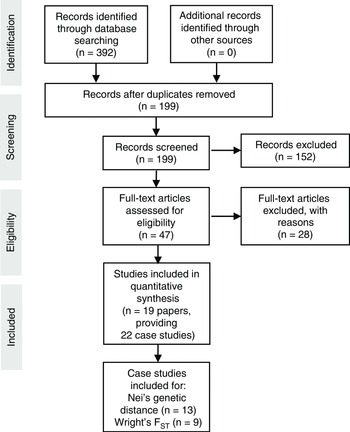
An initial search, after removing duplicates, yielded 199 papers, which we screened for eligibility. This resulted in the exclusion of 148 papers that were not relevant and 4 papers for which we lacked access to the full texts. From the 47 papers that remained, we selected papers that reported the results of a Mantel test for the correlation between matrices of untransformed Euclidean geographic distance on Nei’s genetic distance (11 papers, representing 13 case studies) or untransformed Wright’s FST (8 papers, representing 9 case studies). We chose Nei’s genetic distance and FST as measures of genetic diversity because they were the most commonly reported so this helped maximise the sample size. We expect that our sample size of 22 studies is large enough to provide sufficient power to make meaningful conclusions (Jackson & Turner, Reference Jackson and Turner2017). The analysis of the effect of geographic distance on Nei’s genetic diversity is hereafter referred to as ‘Nei’s meta-analysis’, and the analysis of the effect of geographic distance on Wright’s FST is hereafter referred to as ‘FST meta-analysis’.
Statistical analysis
For the effect size, we extracted Pearson’s r value from the reported Mantel test in each paper. Where R2 was reported, it was converted to r by taking the square root (this was done in two papers for the Nei’s meta-analysis and eight papers for the FST meta-analysis). Each study was weighted according to the following formula developed by Reed and Frankham (Reference Reed and Frankham2003) specifically for meta-analyses of genetic diversity:
 $\sqrt {\left( {A - 2} \right)\; \times N} $
, where
 $A$
is the number of populations and
 $N$
is the number of individuals for each study.
Analyses were conducted using the metafor (Viechtbauer, Reference Viechtbauer2010) and robumeta (Fisher et al. Reference Fisher, Tipton and Zhipeng2017) packages in R version 4.2.1 (R Core Team, 2022). We used a random-effects model because studies were drawn from different populations. For the analysis, we transformed Pearson’s r to Fisher’s Z to ensure normal distribution. After performing meta-analytic calculations, we converted Fisher’s Z back to Pearson’s r for reporting summary effect sizes (Quintana, Reference Quintana2015).
We used the Q-statistic to assess heterogeneity among studies. The Q-statistic is the ratio of observed variation to within-study variance. It evaluates the null hypothesis that all studies are examining the same effect (Quintana, Reference Quintana2015). Different studies used different mangrove plant species and different molecular markers to assess genetic variation (Table S1). To assess the effect of this, we fitted separate meta-analytic models that moderated for the effects of species and marker, respectively. To account for effect size dependency resulting from the same study reporting multiple effect sizes (2 papers in the Nei’s meta-analysis and 1 paper in the FST meta-analysis), we used robust variance estimation as this is appropriate for meta-analyses with less than 40 studies and does not assume knowledge of within-study correlations (Quintana, Reference Quintana2015). We used Egger’s regression test to assess publication bias by testing for funnel plot asymmetry. Publication bias is the phenomenon whereby studies with larger effect sizes are more likely to be published and therefore included in the meta-analysis (Quintana, Reference Quintana2015).
Results
Included studies
There were 13 case studies for Nei’s genetic distance and 9 case studies for FST (Table S1, Figure 1). The distribution of sample sites across all included studies is shown in Figure S2. Egger’s regression test for funnel plot asymmetry showed no effect of publication bias (Nei’s meta-analysis: z = 0.158, p = 0.875; FST meta-analysis: z = 1.31, p = 0.192; Figure S1).
PRISMA flowchart (Moher et al. Reference Moher, Liberati, Tetzlaff, Altman and Group2009) showing the sequence of selection of papers for meta-analysis of the effects of geographic distance on genetic distance.

Effect sizes
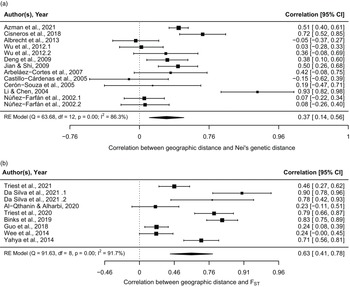
We found a significant association between geographic distance and Nei’s genetic distance (estimated model coefficient = 0.37, 95% CI = 0.14–0.56, z = 3.07, p = 0.002; Figure 2a), which was not changed when accounting for effect size dependency by robust variance estimation (estimated model coefficient = 0.39, 95% CI = 0.12–0.66). We also found a significant association between geographic distance and FST (estimated model coefficient = 0.63, 95% CI = 0.41–0.78, z = 4.77, p < 0.0001; Figure 2b), which was not changed significantly when accounting for effect size dependency (estimated model coefficient = 0.75, 95% CI = 0.38–1.11).
Effect of geographic distance on (A) Nei’s genetic distance and (B) genetic distance measured by FST for the original unadjusted models, with Fisher’s Z transformed back to Pearson’s r. The polygon at the bottom of each plot shows the estimated model coefficient and its bounds represent the 95% confidence intervals (CIs). Each squared point corresponds to a different study, as labelled. The size of the squared point corresponds to the contribution of that study to the estimated model coefficient. The references for all studies included in the meta-analysis can be found in the Supplementary material.

Heterogeneity and moderator analysis
There was significant heterogeneity among the included studies (Nei’s meta-analysis: Q = 63.7, df = 12, p < 0.0001; FST meta-analysis: Q = 91.6, df = 8, p < 0.0001). Li and Chen (Reference Li and Chen2004) contributed disproportionately to the overall heterogeneity in Nei’s meta-analysis. Therefore, for the purpose of comparison, we fitted a separate random-effects model to the same data set but excluded Li and Chen (Reference Li and Chen2004). This reduced the summary effect size from 0.37 (95% CI = 0.14–0.56) to 0.29 (95% CI = 0.12–0.45). The overall heterogeneity was reduced, but there was still significant heterogeneity (Q = 40.4, df = 11, p < 0.0001). Since excluding this study did not significantly remove the heterogeneity, all other analyses include this study.
To determine the source of heterogeneity, we conducted mixed-effects moderator analyses with taxon and marker as separate moderator variables. The type of genetic marker significantly moderated the correlation between geographic distance and FST (QM = 12.0, df = 3, p = 0.0075) but not Nei’s genetic distance (QM = 3.63, df = 4, p = 0.46). Differences in the taxon investigated did not significantly moderate either of these correlations (Nei’s genetic distance: QM = 12.5, df = 7, p = 0.086; FST: QM = 7.50, df = 6, p = 0.28).
Discussion
Our global meta-analysis showed a significant correlation between geographic distance and genetic distance in mangrove plant communities. This isolation-by-distance effect (Wright, Reference Wright1943) suggests that mangrove plants are limited in their capacity to disperse across habitat patches. This is consistent with the conclusions made by Binks et al. (Reference Binks, Byrne, McMahon, Pitt, Murray and Evans2019) that habitat discontinuities lead to reduced gene flow between patches because mangrove propagules tend not to disperse far from their release point, likely due to a combination of abiotic factors, viviparity and short obligate dispersal periods (Binks et al. Reference Binks, Byrne, McMahon, Pitt, Murray and Evans2019, Clarke, Reference Clarke1993). Maintaining gene flow, which is critical for long-term population persistence (Salm et al. Reference Salm, Clark and Siirila2000, Wright et al. Reference Wright, Bishop, Matthee and Von Der Heyden2015), will depend on maintaining proximity among habitat patches, especially under conditions of habitat transformation, which threaten mangrove biodiversity.
Isolation-by-distance indicates that spatial structure and genetic structure are highly correlated and suggests that dispersal limitation may be important in mangrove communities. Dispersal is essential for enabling sessile organisms, such as plants, to move away from unfavourable conditions if they are unable to adapt to such conditions (Kinlan & Gaines, Reference Kinlan and Gaines2003). Isolation-by-distance suggests that these important adaptive responses are constrained by natural dispersal mechanisms (Sexton et al. Reference Sexton, Hangartner and Hoffmann2014). Though not explicitly considered in this study, isolation-by-environment and isolation-by-resistance are relevant to understanding the factors underpinning the genetic structure of mangrove populations. Isolation-by-resistance includes environmental factors, such as land-use changes and biogeographic barriers, that affect the ability of propagules to disperse between patches of suitable habitat. This can affect the genetic structure of populations by modulating the impact of geographic distance on genetic distance (Wang & Bradburd, Reference Wang and Bradburd2014). Moreover, environmental factors such as habitat heterogeneity can affect the likelihood of gene flow among populations, and these isolation-by-environment factors can act in combination with geographic distance to drive the genetic structure of mangrove populations (Da Silva et al. Reference Da Silva, Cruz, Vidal Júnior, Zucchi, Mori and De Souza2021, McRae Reference McRae2006).
If mangrove propagules are limited in their dispersal capabilities, populations in habitat patches are more likely to become isolated from each other. This could result in a meta-population structure with smaller populations that are more vulnerable to demographic and environmental stochasticity (Lande, Reference Lande1993). Furthermore, the apparent dispersal limitation of mangrove propagules could limit the potential for mangroves to shift their distributional ranges to track changing climatic conditions (Van der Stocken et al. Reference Van Der Stocken, Vanschoenwinkel, Carroll, Cavanaugh and Koedam2022). While we recognise that dispersal depends on several biotic and abiotic factors that affect the release, transport and establishment of propagules (Van der Stocken et al. Reference Van Der Stocken, Wee, De Ryck, Vanschoenwinkel, Friess, Dahdouh-Guebas, Simard, Koedam and Webb2019b), the isolation-by-distance effect shown here highlights the importance of geographic distance in constraining gene flow and suggests that mangrove propagules are limited in their tendency to disperse across long distances. This may be exacerbated by future climatic warming and rising sea levels. Recent analysis by Van der Stocken et al. (Reference Van Der Stocken, Vanschoenwinkel, Carroll, Cavanaugh and Koedam2022) indicates that mangrove propagules in fresher and warmer oceans are likely to have increased rates of sinking, which reduces the likelihood of long-distance dispersal, especially for widespread mangrove species with dense propagules such as Avicennia marina (Van der Stocken et al. Reference Van Der Stocken, Vanschoenwinkel, Carroll, Cavanaugh and Koedam2022). Therefore, when conserving and managing mangroves, the importance of maintaining close proximity between habitat fragments should be considered.
Our results indicate that the genetic structure of mangrove communities is dependent on spatial structure. Existing efforts to restore mangrove forests often involve artificial movement of propagules (Vanderklift et al. Reference Vanderklift, Doropoulos, Gorman, Leal, Minne, Statton, Steven and Wernberg2020), which might be relevant for assisting dispersal, if this is needed to maintain connectivity. Furthermore, for protected area networks to successfully maintain landscape connectivity, the size and arrangement of these networks should reflect the dispersal capabilities of the inhabiting species (Durrant et al. Reference Durrant, Burridge, Kelaher, Barrett, Edgar and Coleman2014, Shanks et al. Reference Shanks, Grantham and Carr2003). Therefore, optimal design of protected area networks requires knowledge of effective dispersal distances. While the present study does not address exact distances, our results suggest that the realised dispersal capabilities of mangrove propagules depend heavily on the geographic distances across which they are dispersing. This emphasises the need for future studies to quantify effective dispersal distances in mangroves and consider how mangrove dispersal could be affected by habitat change.
Supplementary material
The supplementary material for this article can be found at https://doi.org/10.1017/S0266467423000147
Data availability
The data files and R scripts used in this study are openly available on GitHub at: https://github.com/natashagranville/meta-analysis_mangroves
A pre-print of this manuscript was uploaded to BioRxiv:
Natasha R. Granville and Cristina Banks-Leite. 2023. Mangrove propagules are limited in their capacity to disperse across long distances. BioRxiv (published in Journal of Tropical Ecology). https://doi.org/10.1101/2023.01.30.526169
Acknowledgements
We thank two anonymous reviewers for helpful comments on an earlier version of the manuscript.
Financial support
This research received no specific grant from any funding agency, commercial or not-for-profit sectors.
Competing interests
We declare no competing interests.