


Introduction
The thermal status within permafrost at high altitudes and latitudes is closely related to changes in atmospheric and surface conditions. Changes in surface temperature, the upper boundary for the thermal regime of the subsurface, provide an early warning of regional permafrost degradation. Observation of the active-layer thickness is therefore crucial.
In the past few years there has been an increased activity in permafrost research, primarily directed toward climate change (e.g. Reference HaeberliHaeberli, 1990; Reference Burn, Dixon and AbrahamsBurn, 1992; Reference Haeberli, Cheng, Gorbunov and HarrisHaeberli and others, 1993; Reference Nelson and GuodongNelson and others, 1993; Reference Smith and RiseboroughSmith and Riseborough, 1996; Reference Vonder Muhll, Stucki and HaeberliVonder Mühll and others, 1998). Analysis of the geothermal gradient in selected permafrost areas is particularly well suited to reconstructing past surface-temperature changes, because thermal disturbance from undesirable and non-climate sources is kept to a minimum.
In Svalbard, permafrost covers the entire land area, with depths of 200–450 m in the interior and mountains (Reference LiestolLiestol, 1980). Few direct measurements exist of permafrost temperatures in deep boreholes and there is a lack of long-term ground-temperature data in Svalbard. Reference LiestolLiestøl (1980) has measured ground temperatures close to Longyearbyen, and at a permafrost research station in Sveagruva (Fig. 1) ground temperatures down to 8 m were collected (Reference BakkehøiBakkehoi, 1982).
Map of the Svalbard archipelago, showing the location of Janssonhaugen (J), Longyearbyen (1) and Sveagruva (2).
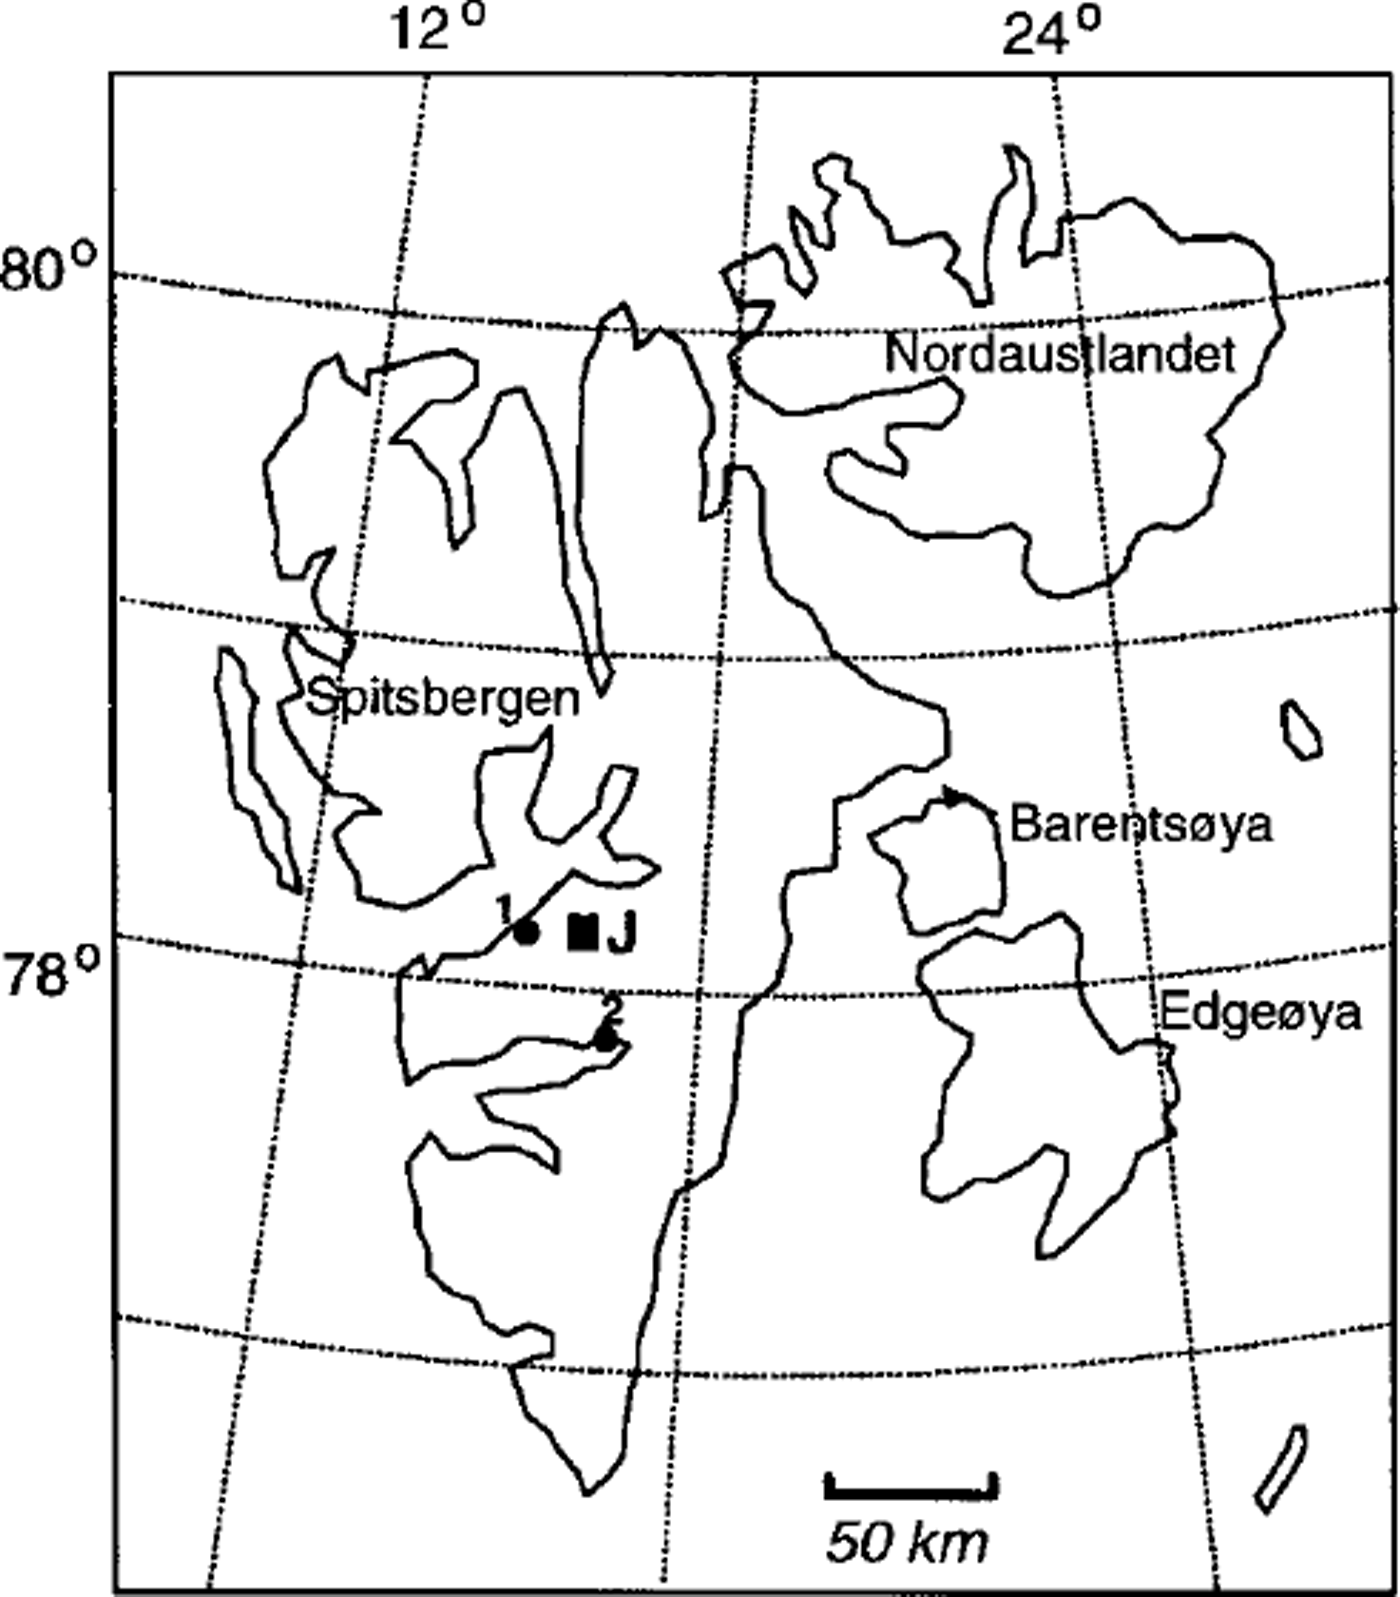
The present paper describes the temperature series from a 102m deep instrumented borehole on Janssonhaugen, Svalbard (Fig. 1). Ground thermal properties are calculated and a palaeoclimatic reconstruction is presented based on a one-dimensional heat-conduction inversion model.
Drill Site
The drill site (78° 10’45" N, 16°28’15" E; 275 m a.s.l.) is situated on Spitsbergen in the Svalbard archipelago (Fig. 1). The closest meteorological station to the study area is 23 km away, at Svalbard airport (28 m a.sl), Longyearbyen. The mean annual air temperature (MAAT) was –6.1 °C during the period 1976–98 (data obtained from the Norwegian Meteorological Institute). Only the months of June, July and August have average air temperatures above zero. In 1 or 2 years the MAATcan differ by 5–6°C, which is a great interannual fluctuation (Reference Hanssen-Bauer, Solås and SteffensenHanssen-Bauer and others, 1990). The MAAT gradient in the area fluctuates between 0.71° and 0.74°C (100 m)–1 (personal communication from N. I. Nilsen, 1997). Thus, Janssonhaugen has a MAATof about –8.0°C. The average precipitation in the area is assumed to be 300–500 mm a"1 (data obtained from the Norwegian Meteorological Institute). Snow thickness is very low (usually no snow cover at all) due to the exposed setting (Fig. 2) which causes strong redistribution of the snow by wind. The Janssonhaugen site is morphologically a bedrock remnant situated in the middle and bottom of the presently ice-free Adventdalen valley, which is one of the major valleys of central Spitsbergen. Geologically the borehole is in Lower Cretaceous bedrock (lithostrati-graphic unit: Rurikfjellet Formation, Ullaberget Member), dominated by a fine-grained porous sandstone with a high silt content and some thin interbeds of shale (Reference Dypvik, Nagy, Eikeland, Backer-Owe and JohansenDypvik and others, 1991) At the top of the borehole, the vegetation cover is sparse. The sediment cover is thin and is dominated by a patchy pattern of morainic material and in situ weathered bedrock.
View towards east over Janssonhaugen drill site (circled). Note the absence of snow. Picture taken first day of drilling 30 April 1998.

To avoid geothermal disturbance from undesirable elements and non-climate sources, some consideration was given to finding the best location for drilling. After careful investigation, Janssonhaugen was chosen. In Svalbard, the most important disturbing factors would be:
-
(1) variations of thermal conductivity within the ground (bedrock, surface material, ice content, etc.)
-
(2) topographical effects and surface orientation (e.g. steep mountainsides)
-
(3) variable snow cover
-
(4) boreholes close to glaciers, rivers and ocean
-
(5) human encroachments, especially coal mines
-
(6) emergence of the archipelago in the last 10 kyr
All these disturbing factors are minimized on janssonhaugen: (1) Geological investigations in the area (Reference Major and NagyMajor and Nagy, 1972; Reference Dypvik, Nagy, Eikeland, Backer-Owe and JohansenDypvik and others, 1991) indicate fairly homogeneous bedrock. This was confirmed by the X-ray diffraction (XRD) analyses and by the visual description from the borehole video camera. (2) The drill site was located on a wide plateau with gentle slopes down to the valley bottom. (3) The snow cover is thin or absent because of low precipitation and strong redistribution by wind. The seasonal ground temperatures show high-frequency variations above the permafrost table. (4) The nearest river (’Adventelva") is located 100ma.s.l. and 600 m from the drill site, which is too far away to affect the geothermal regime in the borehole. It is ≥ 1 km to the nearest glacier and ≥ 15 km to the ocean. (5) Janssonhaugen is totally free of coal mines and other human encroachments, which are common in other areas close to Longyearbyen. (6) The Janssonhaugen borehole is situated >200m above the late-Weichselian marine limit, which was formed at the beginning of the deglaciation at about 10 kyrBP. In lower areas that have risen above sea level, the relatively short time of subaerial exposure is a disturbing factor for the permafrost regime.
Borehole Installations and Monitoring Procedures
The depth of the drilling reached 102 m (completed 3 May 1998). The drill-bit diameter was 4 in (100 mm). During the drilling, well cuttings from the borehole were collected at intervals of 3–7 m. After drilling, a video camera was lowered to the bottom of the borehole, giving a visual description. The wall inside the borehole showed small caliper variations. The lining was a 103 m plastic tube (PE 75) which was installed using a helicopter. To protect the borehole and installations against polar bears and polar foxes, an 800 kg concrete lid was placed over the top of the borehole. To control the thermal influence of the lid, a 15 m deep borehole was drilled 13 m away.
Borehole temperatures were measured with negative-temperature-coefficient (NTC) thermistors: Yellow Spring Instruments YSI 44006 with a resistance of about 2.95 xl04Ω at0°C, and a temperature coefficient of about 5% °CT\ The calibration was done at Versuchsanstalt für Wasserbau, Hydrologie und Glaziologie, ETH-Zürich. The thermistors were also checked in an ice-water bath in a cooling room at the University Courses on Svalbard (UNIS), just prior to installation. The absolute accuracy is estimated at ±0.05°C and the relative accuracy at ±0.02°C (Reference Vonder Muhll and HolubVonder Muhll and Holub, 1992).
The thermistors were coupled to a Colorflex CY thermistor string. A weight was placed at the lower end of the string to ensure that the thermistors’position remained constant and that the string reached the bottom of the hole. Depths of the thermistors followed the general instructions for the Permafrost and Climate in Europe (PACE) boreholes, with 30 thermistors from 0.2 to 100 m. A Campbell CR21X (Campbell Scientific Ltd, Shepshed, Leicestershire, U.K.) including a multiplexer (AM416) and storage module card was used for data logging.
After instrumentation was completed on 8 May 1998, measurements of the 11 thermistors in the upper 5 m of the borehole were made every 6 hours. Temperatures of the 19 thermistors below 5 m were taken every 24 hours.
To get an indication of the ground surface temperature, three UTL-1 miniature temperature loggers (Geographical Institute, University of Bern, Switzerland), each approximately 15 m from the deep borehole, were buried at the surface (about 0.05 m depth) to the north, west and south, reading the temperature every 72 mm. One miniature temperature logger was also placed at the top of the borehole. The thermistors in the miniature loggers are of type TMG-1T, with accuracy better than 0.25°C given by the manufacturer (Hoelzle and others, in press).
Results
Seasonal characteristics
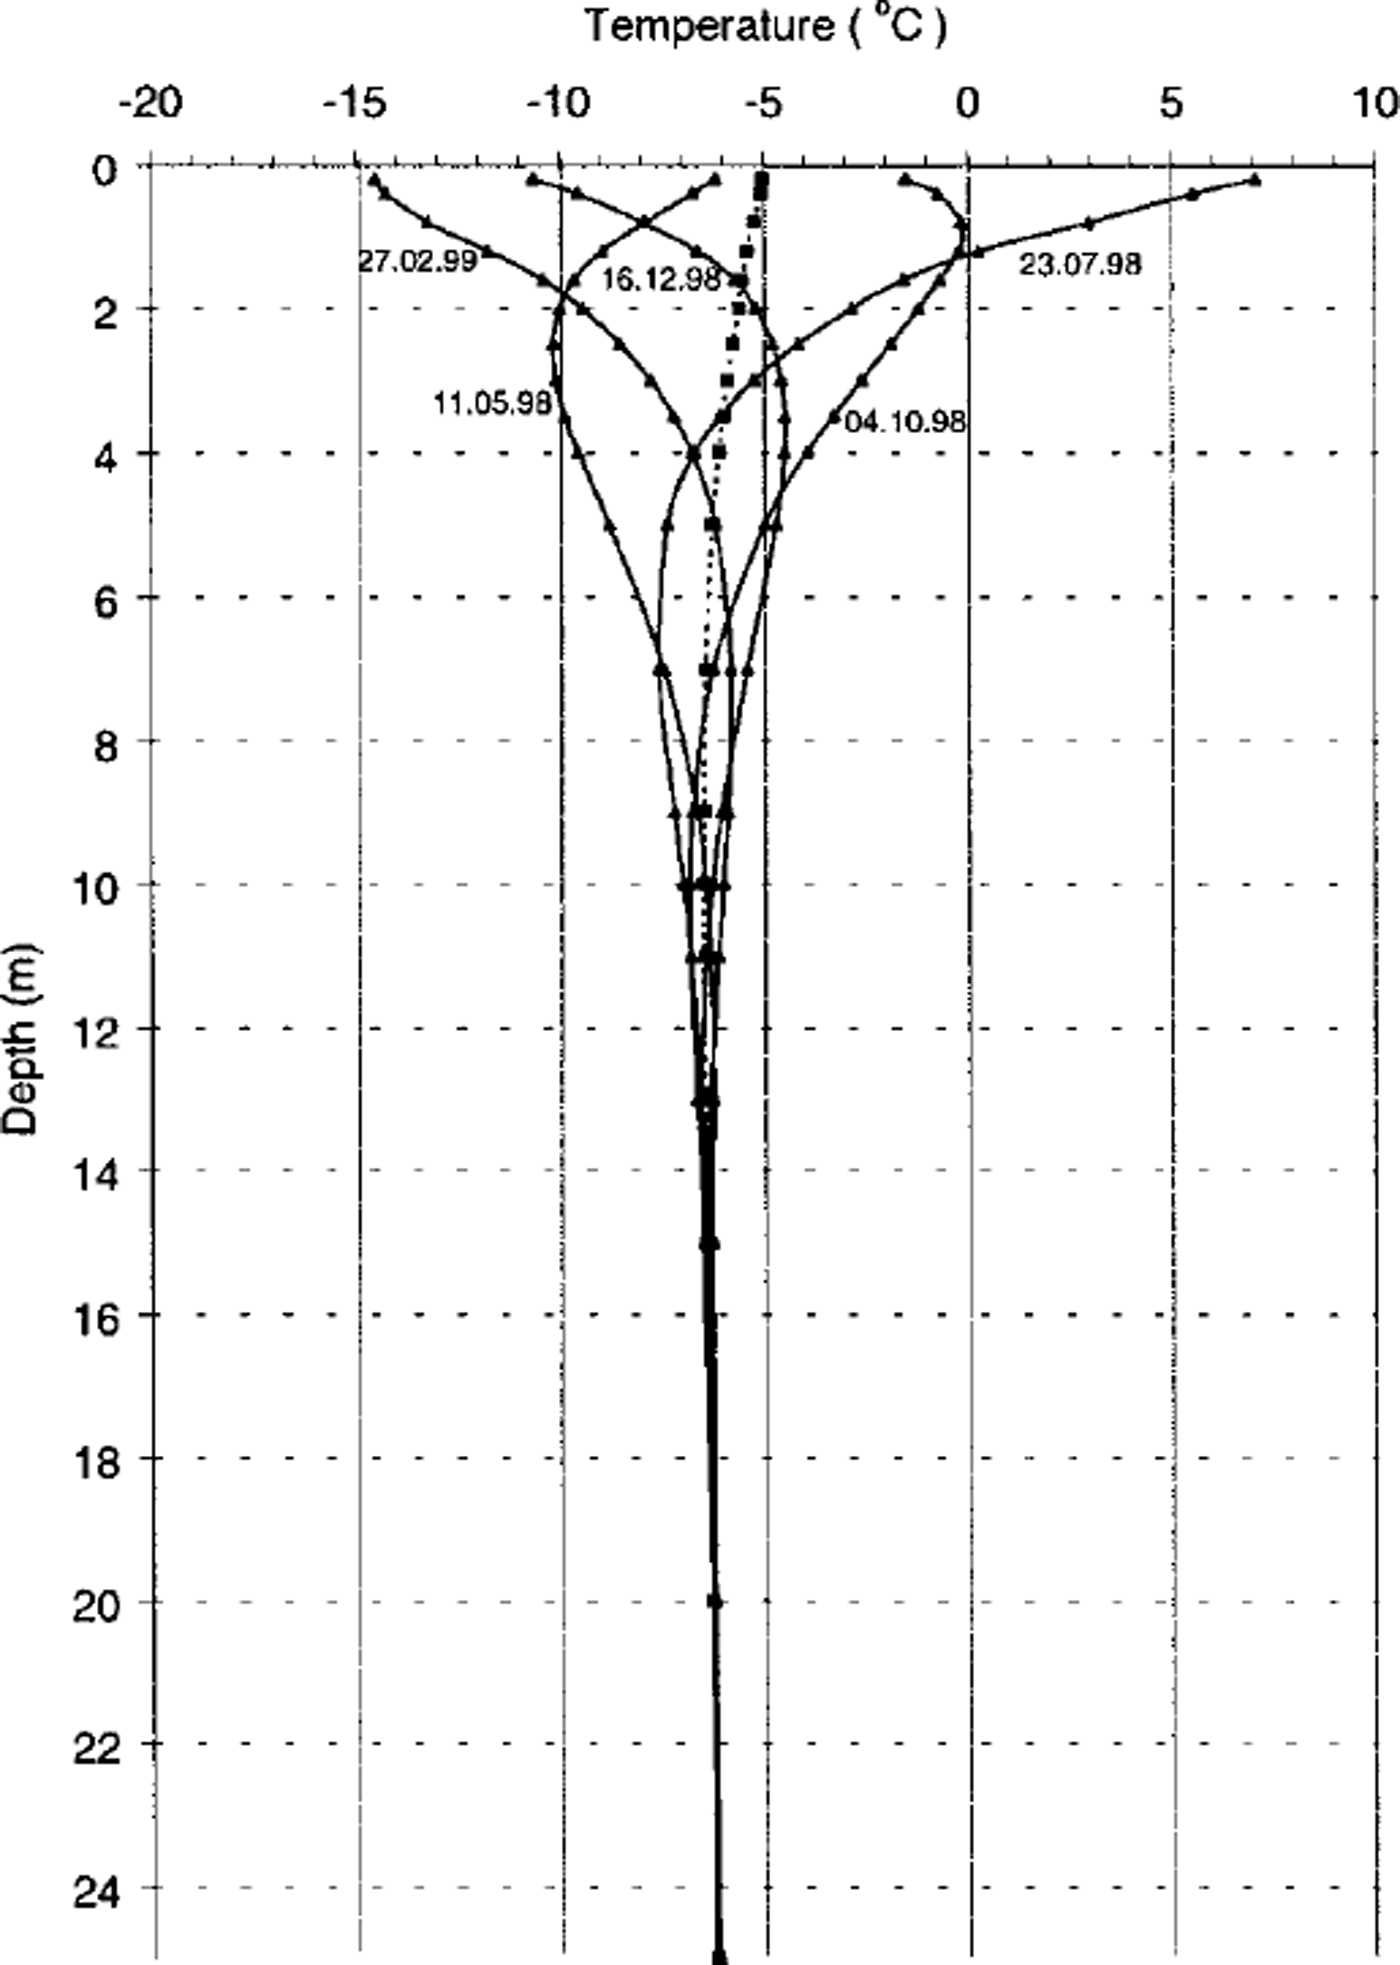
Data collected fromjanssonhaugen in the uppermost 10–20 m are presented in Figures 3 and 4. Temperature varies seasonally down to 18 m depth (amplitude of temperature wave (Az) ω0.1 °C), equivalent to the depth of zero annual amplitude (ZAA). The depth of the active layer in summer 1998 was 1.55 m, with a maximum depth on 4 September. The active-layer temperatures reached the freezing point on 22 September 1998. During freezing, the ground temperatures in the middle and lower part of the active layer remained at 0°C for 2 weeks (Fig. 4). During this period the mean surface temperature was –3.3°C, with minimum temperatures (daily mean) down to –9.3°C. This ˚zero curtain effect" indicates high water content in the bedrock in the active layer. On the other hand, in spring no ˚zero curtain effect" was observed. This is explained by the absence of a snow cover, due to strong snowdrift and long periods of high sublimation in spring, which dries out the upper ground before surface temperatures reach 0°C.
Seasonal temperature profiles for the uppermost 20 m of the Janssonhaugen borehole during the first year after drilling The year is divided into five readings with equal intervals (73days). Dates are in dd.mm.yy. The dotted line represents the mean annual temperatures.
Seasonal surface temperature (a) and temperature fluctuations at various depths (b). Note the ˚zero curtain-effect in autumn, but not in spring, at 0.8 m depth.

At both 0.2 and 0.8 m depth we found high-frequency variations throughout the entire year. Below the permafrost table, high-frequency temperature variations diminish rapidly, as revealed from theory (e.g. Reference Williams and SmithWilliams and Smith, 1989), and closely follow a sinusoidal curve at 5.0 m depth. Measurable effects from the drilling disturbance lasted 15–20 days. A week after the drilling the thermal disturbance was reduced to a few hundredths of a °C.
Thermal conditions
While ground thermal conditions are linked to the atmospheric climate, processes occurring in the boundary layer of snow, vegetation, surface organic material and mineral soil moderate this influence (Reference Williams and SmithWilliams and Smith, 1989). Interpretation of this effect is often confused by the interdependence among the different processes. The virtual absence of this buffer layer on Janssonhaugen, with bedrock exposed at the surface, results in a very direct linkage between the atmosphere and the geothermal regime.
In permafrost, heat transfer occurs largely through conduction. Advection is minimized due to the frozen state of water, and radiation is not significant in the subsurface. Therefore, the temperature regime in permafrost can be treated by applying the Fourier equation (Reference Carslaw and JaegerCarslaw and Jaeger, 1959), and, due to the relatively flat topography (plateau with gentle slopes down to valley bottom) at the Janssonhaugen site, it can be treated in one dimension only.
Given the parameters for the mean annual surface temperature T0 (°C), the annual amplitude of the surface temperature A0 (°C) and the depth in the ground z (m), the solution for the annual cycle based on thermal diffusivity is given by:

where K IS the thermal diffusivity (m2 s–1) and P is the period of the annual signal (s).
The thermal diffusivity K in the zone of seasonal temperature variations was calculated in two ways:
-
(1) In terms of the amplitude decrease with depth using the term A 0 exp[–z(π/κP)]1/2
(2)
-
where ω is the frequency of the annual signal (ω = 2π/P), h is the distance between the two temperature sensors (m), A, is the amplitude of the upper temperature sensor (°C) and A2 is the amplitude of the lower temperature sensor (°C).
-
(2) In terms of the phase lag with depth using the term
(3)where δ is the phase lag between the upper and the lower temperature sensor.


Table 1 shows a matrix with the calculated values for the thermal diffusivity in the uppermost 15 m of the Janssonhaugen drilling based on lyear of data. The results for Ka generally are higher than those for Kp.
Calculated values for the thermal diffusivity in the uppermost 15 m
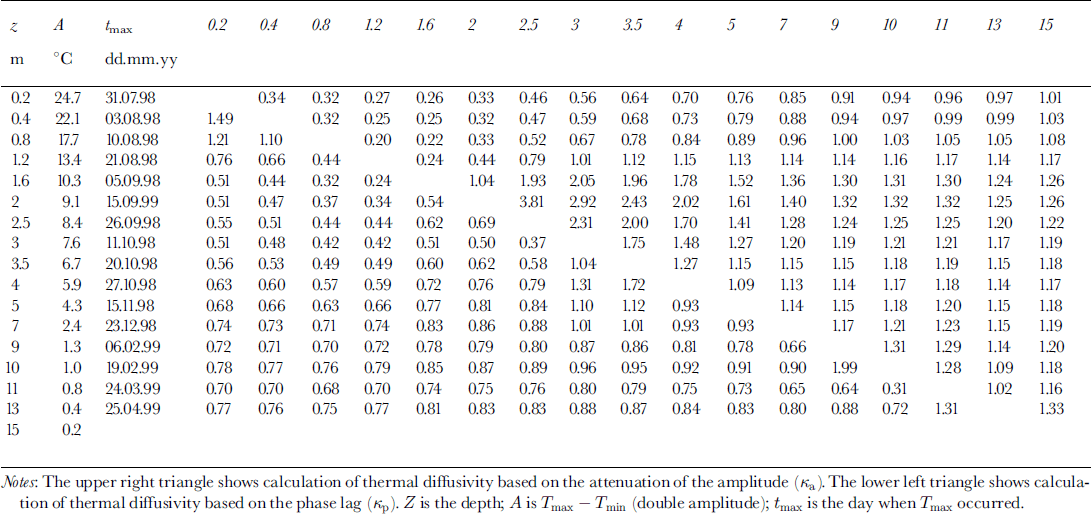
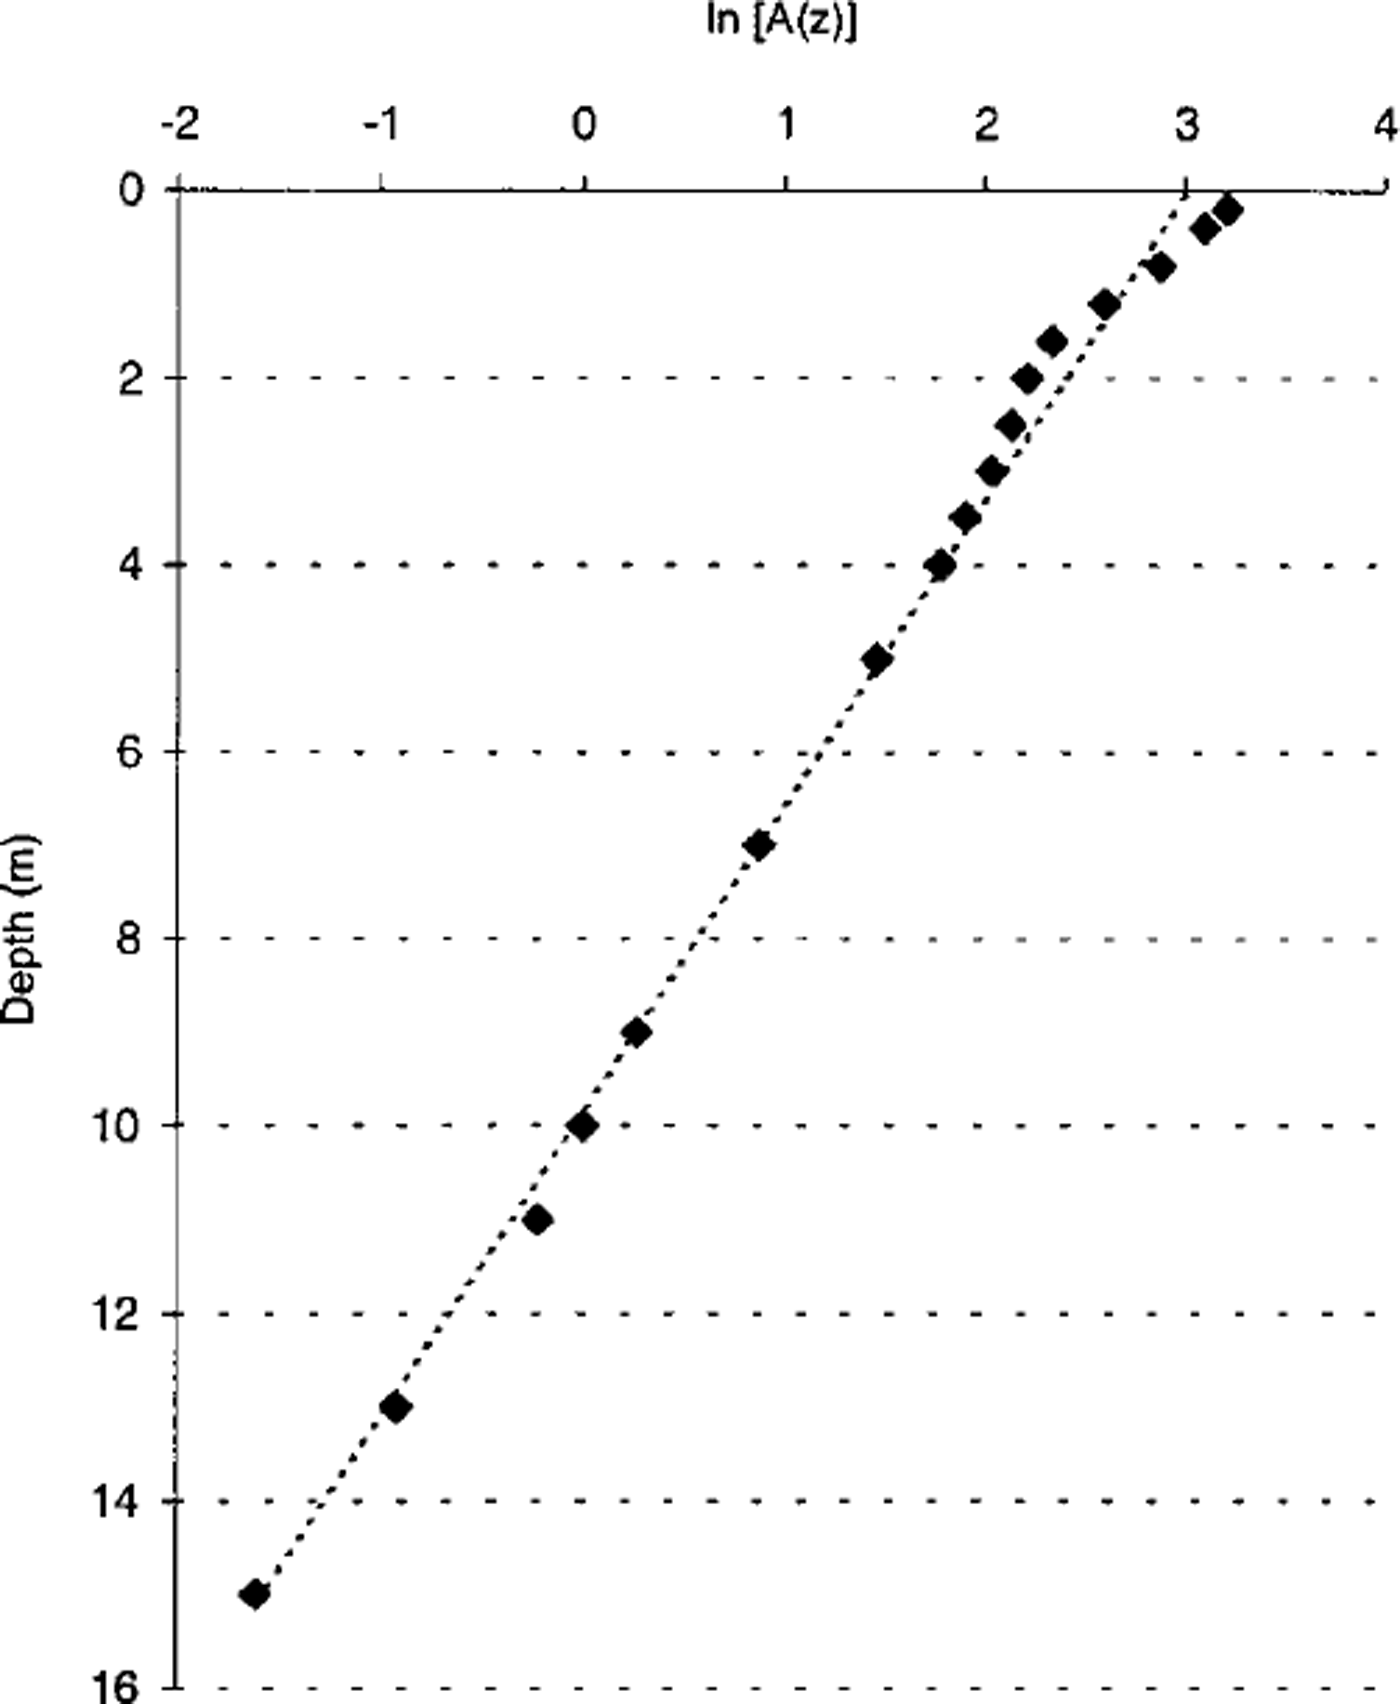
In Ka, there are three distinct layers which appear in plotting ln[A(z)] against z (Fig. 5):
-
(1) 0.2–1.6 m: high variability of the values 0.2–0.3 × 10⁻⁶ m2 S–1. This is the range of the extended active layer, where high-frequency signals are predominant.
-
(2) 1.6–4.0 m: thermal diffusivity is enhanced in this layer with values of 1.5–3.0 × 10⁻⁶ m2 s–1.
-
(3) 4.0–15 m: the values fall in a narrow range of 1.1–1. 36 × 10–6 m2 S–1 .
Maximum amplitude A (z) of annual fluctuation vs depth. The mean thermal diffusivity K IS determined to 1.1 × 10⁻⁶ m2 s–1from the slope m of the dotted line.
Using the phase lag, Kp is similar to Ka in the uppermost part (0.2–1.6 m depth). The middle depth range suggests higher values of Kp than Ka, and at depth, Kp shows variable values of 0.7–1.1 × 10⁻⁶ m2 s–1 .
For the uppermost 15 m, the mean thermal diffusivity K can be determined from the slope m of a linear fit to the natural logarithm of the maximum amplitude A(z), plotted vs depth (Fig. 5), assuming that the period p is 1 year (e.g. Reference Vonder Muhll and HaeberliVonder Muhll and Haeberli, 1990):

which gives a mean thermal diffusivity of 1.1 × 10⁻⁶ m2 s–1. For each of the distinct layers mentioned above, the average thermal diffusivity is 0.3 × l0–6 m2 s–1 for the uppermost active layer, 2.0 × l0–6 m2 s–1 for the middle and 1.1 × l0–6 m2 s–1 for the deeper part down to 15 m. Based on the last value, this gives a phase speed of the annual wave of 6.5 × 10⁻⁷ m s-1 , equal to 5.65 × 10⁻² m d–1.
Thermal conductivity K, thermal diffusivity K, density p and mass specific heat capacity c are related by (Reference Gold and LachenbruchGold and Lachenbruch, 1973):

The density, p, of the bedrock was 2280 kg m–3 and was measured in the laboratory by conventional methods on rock samples fromjanssonhaugen. The porosity was estimated as 20–25%. Considering that the mass specific heat capacity c for the sandstone on Janssonhaugen is 800J kg K–1 (e.g. Reference Carslaw and JaegerCarslaw and Jaeger, 1959; Reference Williams and SmithWilliams and Smith, 1989), thermal conductivity K can be calculated as 1.8–1.9 Wm–1K–11 . The low conductivity value is likely related to a considerable amount of air in the porous sandstone.
Mineralogical studies provided an indication of geological variations that might cause thermal disturbance. The borehole cuttings were analyzed using XRD in a digital diffractometer, and the semi-quantitative analyses followed the weight-factor method described by Ramm (unpublished). The results of the mineral quantification are shown in Table 2. Except for the two samples at 40 and 92 m, they indicate fairly homogeneous bedrock in the Janssonhaugen borehole, with a high and stable quartz concentration interpreted as sandstone. The high clay mineral concentrations in the two mentioned samples indicate thin interbeds of shale 1–3 m thick (Reference Dypvik, Nagy, Eikeland, Backer-Owe and JohansenDypvik and others, 1991). However, these thin shale
XRD ofmineral sample results from Janssonhaugen borehole
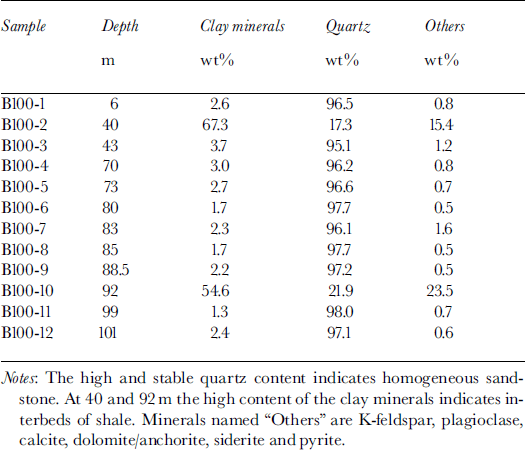
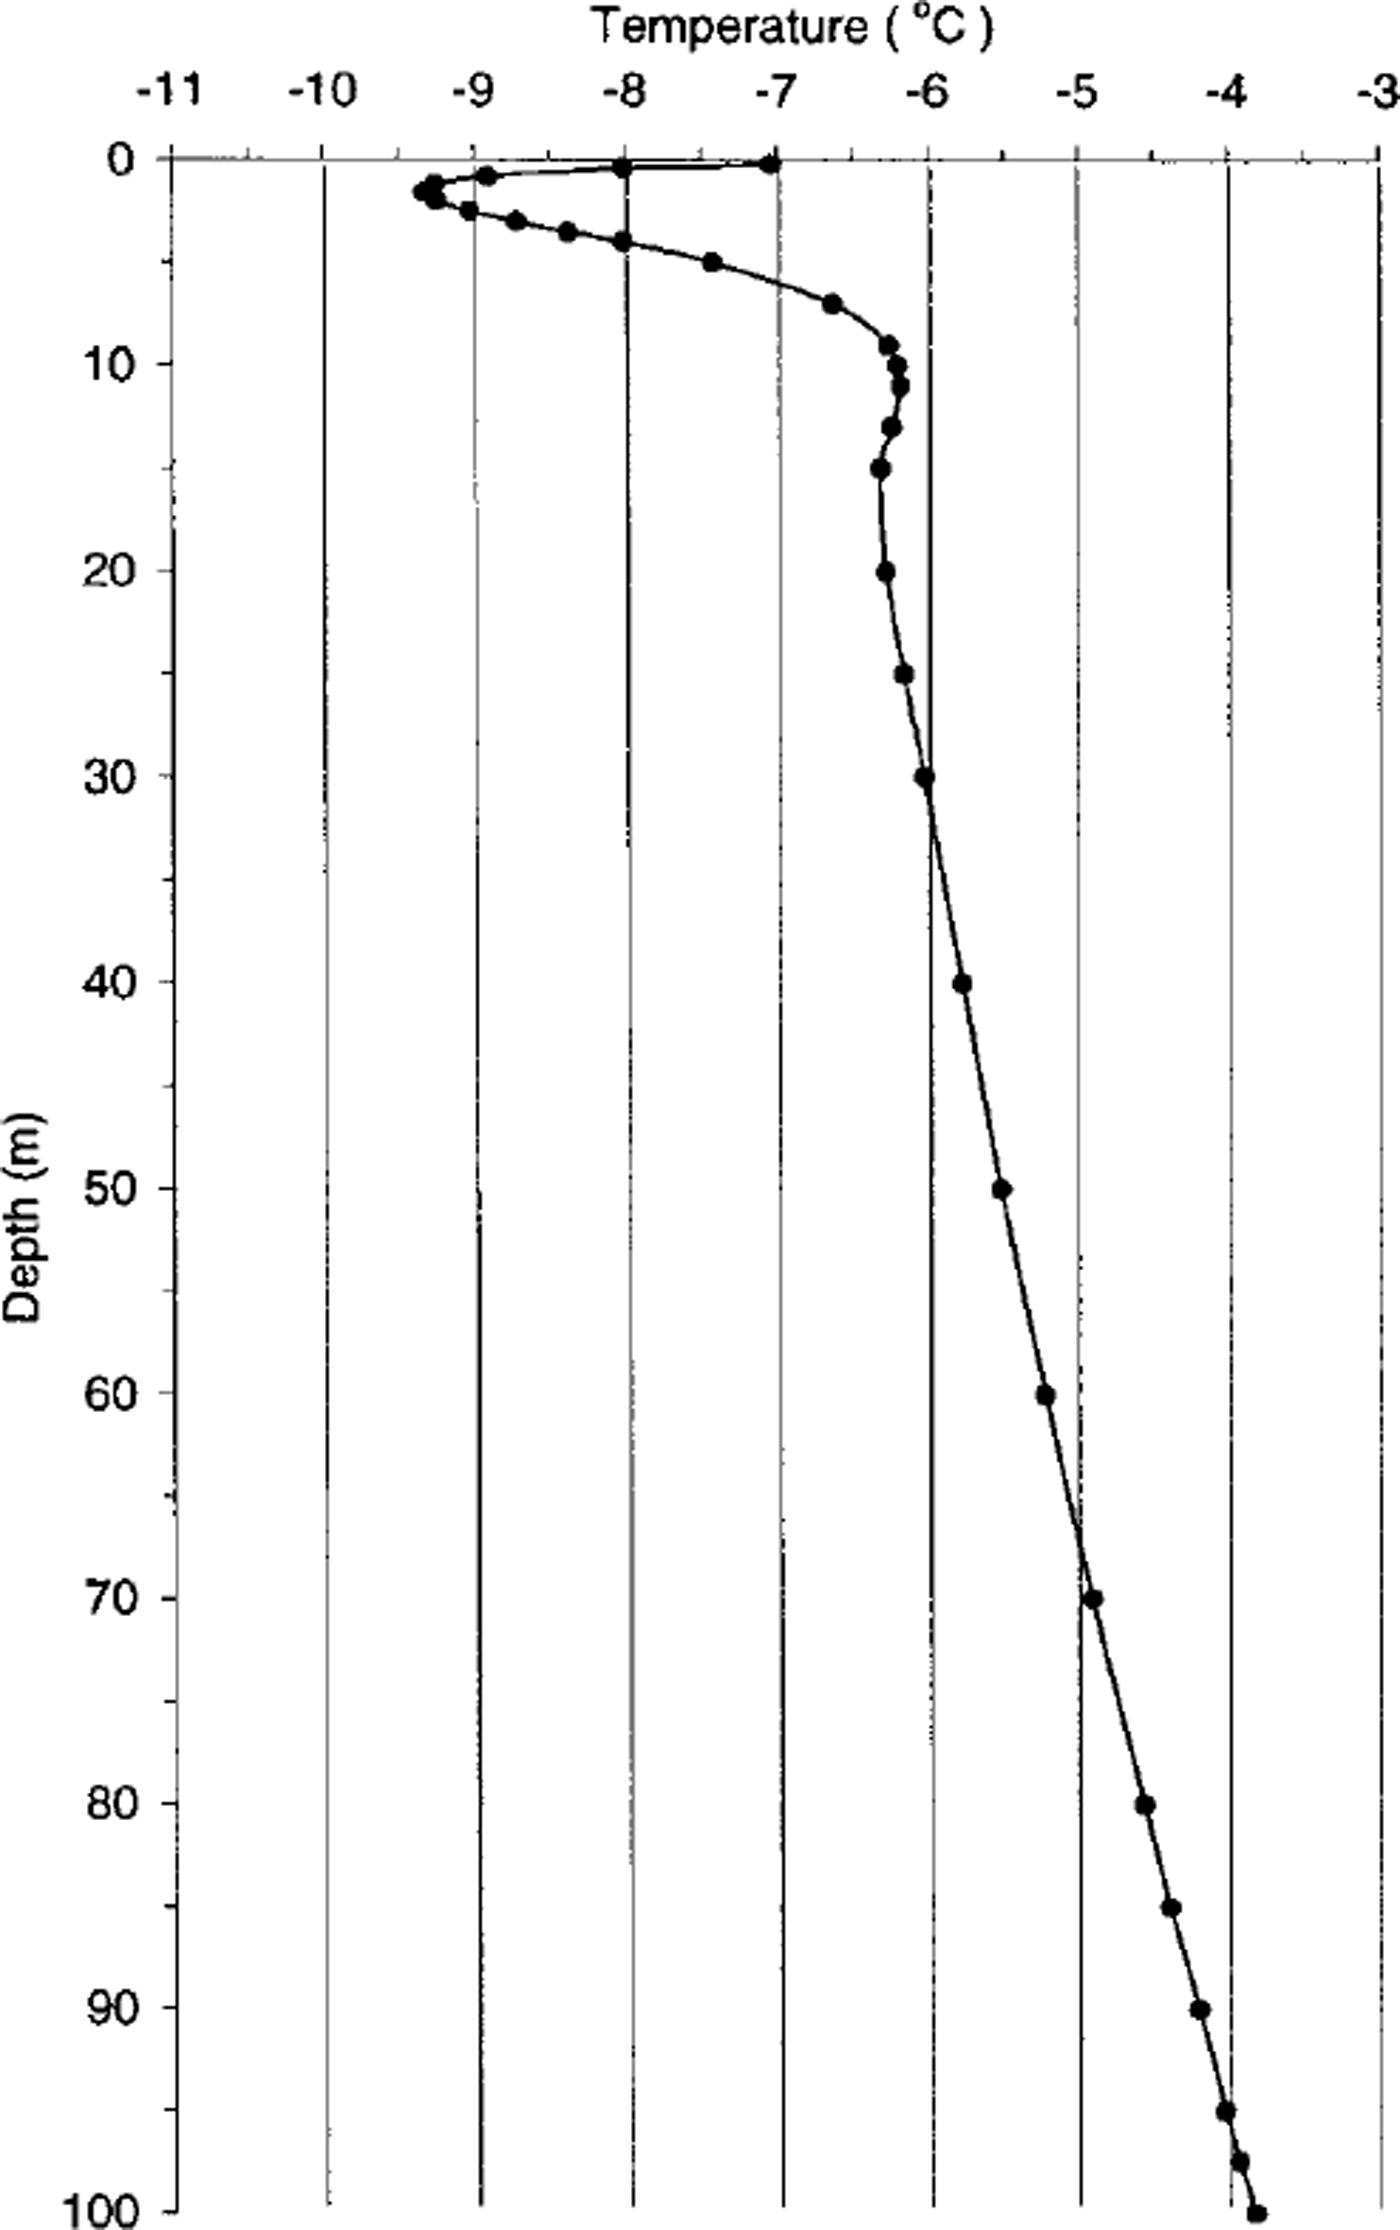
Figure 6 shows the temperature profile from Janssonhaugen recorded 1 year after drilling. The smooth profile supports a very low geothermal disturbance from undesirable elements and non-climate sources. By using a simple linear extrapolation and a mean gradient derived from the borehole, the permafrost thickness is estimated as 220 ± 10 m. This is in good agreement with observations in other boreholes in the area (Reference LiestolLiestol, 1980).
The temperature profile from Janssonhaugen borehole, 9 May 1999.
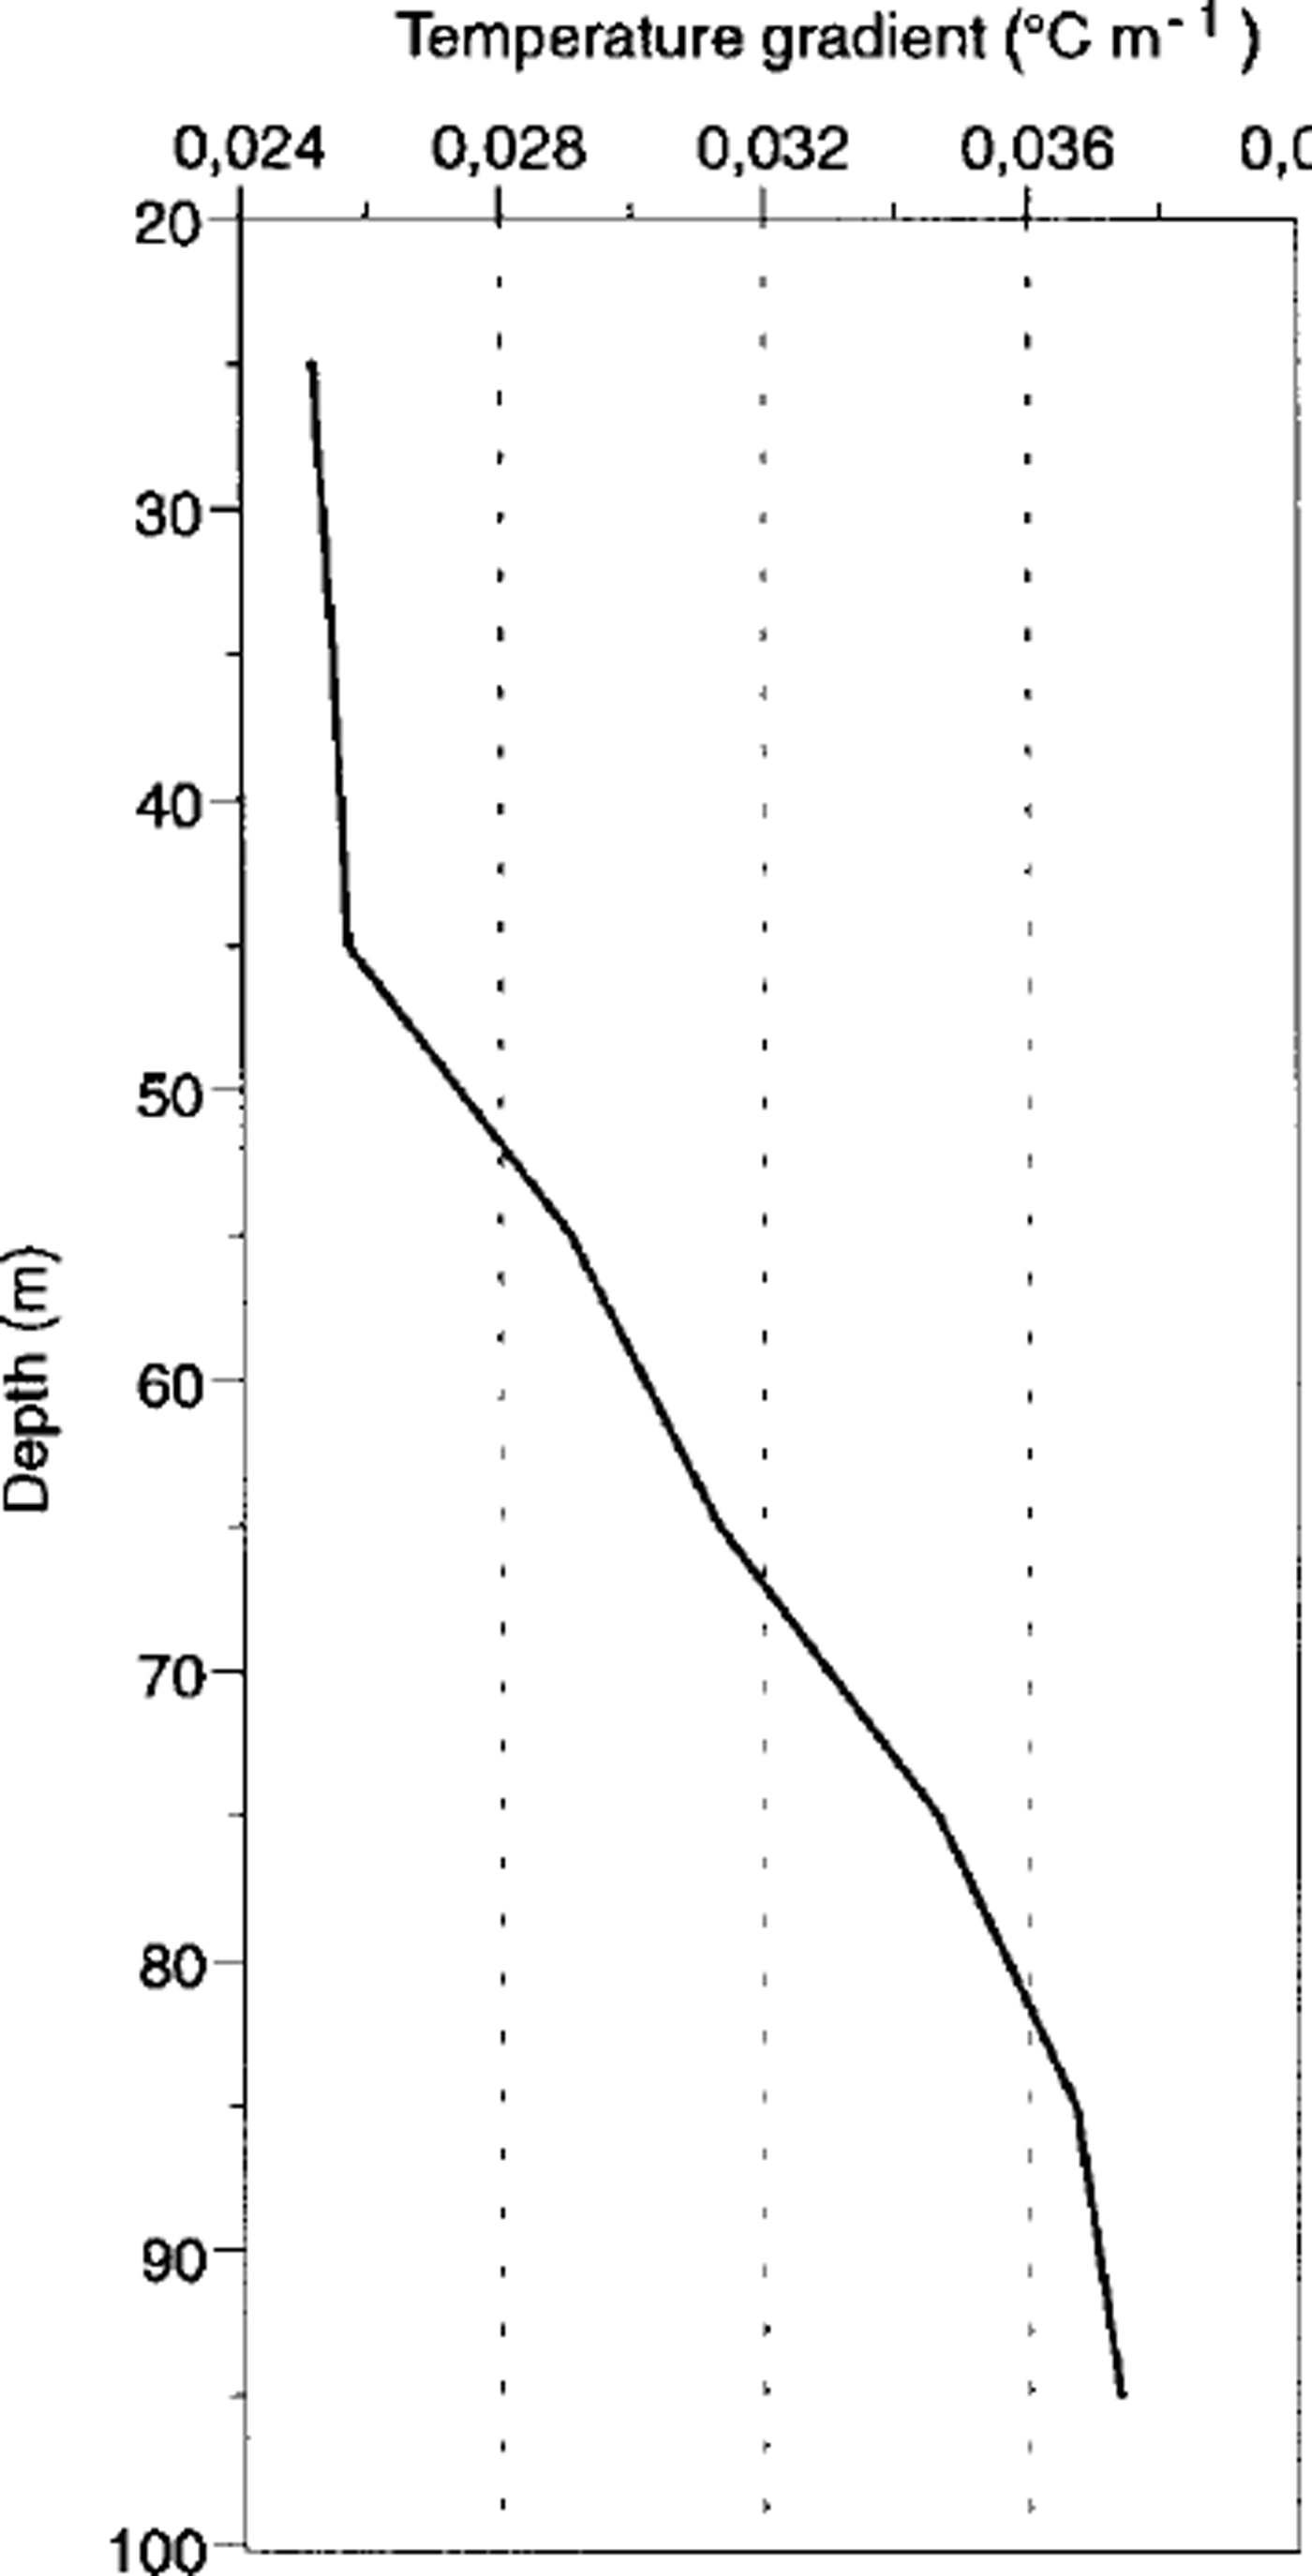
Below 45 m there is a distinct change in the thermal gradient, giving a deflected thermal profile at depth. The gradient changes gradually downwards from ∼0.025˚Cm–1 at 45 m to ∼0.038°C m–1 at 95 m (Fig. 7), resulting in a departure of the upper part of the profile from a ˚steady-state linear profile". This suggests a general warming which is in accordance with similar permafrost temperature observations in large areas of the Alaskan and Russian Arctic (Reference Lachenbruch and MarshallLachenbruch and Marshall, 1986; Reference Lachenbruch, Cladouhos, Saltus and SennesetLachenbruch and others, 1988; Reference ParlovPavlov, 1994; Reference Osterkamp and RomanovskyOsterkamp and Romanovsky, 1999).
The temperature gradient in the borehole below ZAA, 9 May 1999. layers are not detectable on the temperature curve and are of minor significance in the geothermal regime on Janssonhaugen.
Surface-Temperature Reconstruction
The inversion procedure was performed with a code based on the Bayesian inverse technique which estimates the ground surface-temperature (GST) history in the Fourier frequency domain (for a detailed description see Reference WangWang, 1992). The accuracy of the thermistor data allows the attribution of only small error bars to the T-z data (standard deviation 0.04°C). The subsurface was assumed to be homogeneous, with a thermal conductivity of –1.8 Wm–K–1 and a basal heat flow of 67mW m–2. A slight variation was given the thermal diffusivity value K. The subsurface material values represent a priori information, which was altered during the inversion procedure. Since they were estimated, a rather large standard deviation was needed (approximately 20%). The mean ground-surface temperature was set to –75°C. The treatment of inversion procedures is strongly dependent on the choice of the fundamental period. To obtain a good resolution for the ground surface-temperature history, especially the last 20 years, a cut-off period of 6 years and a fundamental period of 200 years was used. The data have been analyzed in a time-domain window of 20 years.
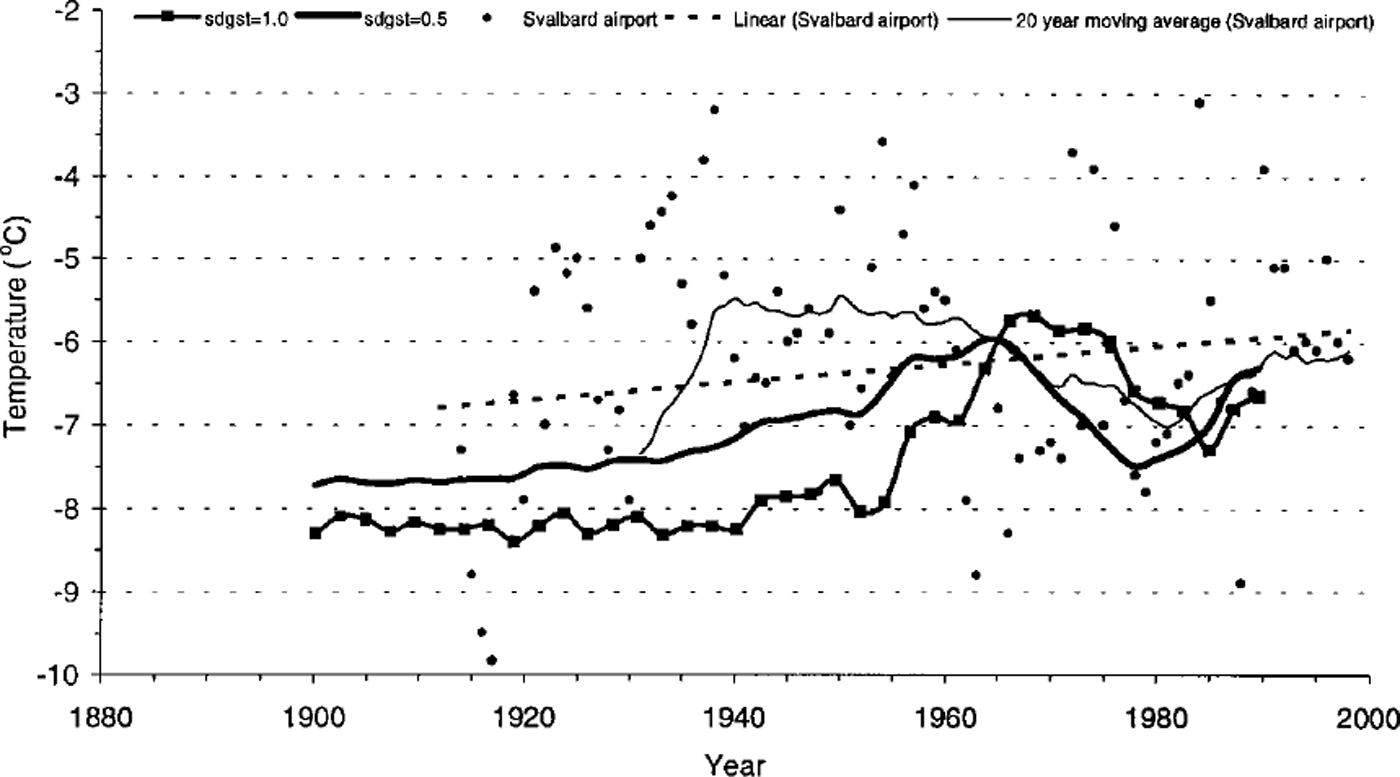
Figure 8 illustrates the inversion results for two different cases: sdgst = 1, which assumes a normal variation of the standard deviation of the T-z data and K of 0.9 × l0–6 m2 S–1, and sdgst = 0.5, which assumes a narrow variation of the T-z data and K of 0.5× 10⁻⁶m2s–1. The inversion results are compared to a linear regression and a moving 20 year window of air-temperature data from the meteorological station Svalbard airport, which was established in 1975. For Svalbard airport an air-temperature record has been reconstructed back to 1912 (Reference Hanssen-Bauer, Solås and SteffensenHanssen-Bauer and others, 1990). The reconstruction is based on meteorological data from different Svalbard stations (Longyearbyen, Isfjord Radio and Green Harbour), each of which has different periods and duration of observations.
The inversion results for two different cases: sdgst = 1 (line with markers), which assumes a normal variation of the standard deviation of the T-z data and K of 0.9 × 10⁻⁶ m2 S–1 , and sdgst = 0.5 (thick line), which assumes a narrow variation of the T-z data and K of 0.5 × 10⁻⁶ m2 S–1 . MAATrecord at Svalbard airport, 1912–98, shown as yearly values (dots), linear trend (dotted line) and 20year moving average (thin line). The Svalbard airport station was established in 1975 In order to extend the Svalbard airport series back to 1912, observations from Longyearbyen and other stations on Spitsbergen were used. Meteorological analyses after Reference Hanssen-Bauer, Solås and SteffensenHanssen-Bauer and others (1990) and data obtained from the Norwegian Meteorological Institute.
Discussion
1 year series
Above the ZAA and up to the surface, mean annual temperatures (Fig. 3) are displaced toward warmer temperatures with an inverted temperature gradient above 10 m. The mean annual surface temperature calculated from the borehole measurements is close to –5.0°C. Surface temperatures and extrapolated air temperatures show a good similarity. The extrapolated mean air temperature at Janssonhaugen for the same time period is –5.8°C. The difference of ∼0.8°C between mean surface and extrapolated air temperatures can be explained by the seasonal variations and the energy balance at the surface. The late-spring and summer surface temperatures are generally 3–5°C warmer than the extrapolated air temperatures. This is not surprising, given that the quite dark surface material absorbs much radiation during the 4 month long midnight sun season. In winter there is only a small divergence between air and ground-surface temperatures, indicating that heat exchange takes place at the ground surface due to absence of snow. In addition, the concrete lid at the top of the borehole will prevent a snow cover from forming at the borehole, and modify the energy regime during the different seasons. The 15 m deep control borehole, with no protection cover at the surface, will correct for this disturbance in the future and show how far the thermal conditions in the ground are modified.
When the temperature profile is extrapolated from just below ZAA (temperature gradient 0.025°C m–1), the ˚equilibrium surface temperature" is –6.8°C. The extrapolated last 5 year mean air temperature is –7.8°C. Such similar values are unusual in cold regions (Reference Williams and SmithWilliams and Smith, 1989). On Janssonhaugen, the virtual absence, primarily of snow, but also of mineral soil and vegetation, constitutes a boundary condition with a very direct linkage between the atmosphere and the geothermal regime.
Surface-temperature reconstruction
The ground filters the higher-frequency signal of the atmosphere and, unlike the air-temperature record, preserves only the low-frequency signals. During the last 60–80 years a significant increase is visible in the surface-temperature reconstruction from Janssonhaugen, with a maximum warming in the late 1960s (Fig. 8). The magnitude of the surface warming in this period was 1.5–2.5°C. This change is in good agreement with glacier-history studies on Spitsbergen (eg. Reference LiestolLiestol, 1988; Reference Lefauconnier and HagenLefauconnier and Hagen, 1990), which show that cirque glaciers on the west coast of Spitsbergen had a maximum extent between 1907 and 1918.
For the period since the 1960s, the surface-temperature reconstruction shows a cooling trend, resulting in a ground-surface minimum around 1980, with temperatures about 1.5°C colder than the maximum in the late 1960s. In the 1980s, another warming trend began and totalled about 0.5–1.0°C up to the ˚equilibrium surface temperature" of-6.8°C today.
The Svalbard airport air-temperature record (Fig. 8) shows great fluctuations in MAAT which make the general picture quite complicated. The 20 year averaged data show a general warming trend during the period 1912–40. The period 1940–60 shows MAAT fluctuations about a rather constant level. During the period 1960–80, however, the MAAT fell. During the most recent decades the MAAT shows a slight shift to warmer temperatures.
The major features in the temperature variation at Svalbard airport agree well with the surface-temperature reconstruction from Janssonhaugen, especially in the last 35 years. The inversion data can reproduce the temperature minimum around 1980, and the temperature increase starting in the early 1980s highlighted by the 20 year averaged data.
As would be expected, the inversion procedure shows a dependency of the thermal diffusivity: higher diffusivity accelerates the temperature signals. Obviously because of the relatively small borehole length and the fact that the earth preserves only the long trend signals, the temperature data cannot accurately reconstruct the temperature increase in the early part of the 20th century.
Conclusions
The smooth temperature profile fromjanssonhaugen supports a very low geothermal disturbance from undesirable elements and non-climate sources, and contains a preserved climate signal particularly suited for reconstructing the ground surface-temperature history.
Analysis of the borehole temperatures on Janssonhaugen reveals an increasing temperature gradient with depth. Using a one-dimensional heat-conduction inversion model, the palaeoclimatic reconstruction shows a warming of the surface temperature during the last 60–80 years.
The temperature profile represents a regional signal on Svalbard, which shows an inflection associated with near-surface warming of 1.5±0.5°C during the 20th century. This is in accordance with similar permafrost temperature observations in large areas of the Arctic.
Acknowledgements
The drilling operation on Janssonhaugen was funded by the PAGE project (contract DG-XII ENV4–GT97–0492). The project is co-ordinated by G. Harris of Cardiff University, U. K. Within the framework of PAGE, a transect comprising a series of seven 100 m deep permafrost boreholes from Svalbard to Spain is being established. The boreholes are instrumented and allow the present thermal status and properties of permafrost in Europe to be investigated and also provide an early warning of a possible ongoing climate change.
J. Utsi of Store Norske Spitsbergen Kulkompani (SNSK) was responsible for the technical drilling operation on Janssonhaugen. The environmental department of the Governor of Svalbard (Sysselmannen pa Svalbard) kindly gave permission for the drilling operation. J. Dybdahl, K. Sandaker and J. Dormenen from UNIS helped with the logistics and the collection of the last data from the borehole, in May 1999. The Norwegian Meteorological Institute obtained air-temperature data from Longyearbyen and other stations on Spitsbergen. V. Storvoll of the Department of Geology, University of Oslo, helped with the XRD analysis. Two anonymous reviewers made valuable comments.



