INTRODUCTION
The relationship between species diversity and habitat heterogeneity is fundamental to understanding spatial ecology. Habitat heterogeneity affects key ecological processes in various ways (Fahrig & Nuttle Reference FAHRIG, NUTTLE, Lovett, Turner, Jones and Weathers2005, Pickett & Cadenasso Reference PICKETT and CADENASSO1995). These include increasing or decreasing species population size (Cramer & Willig Reference CRAMER and WILLIG2005, Tews et al. Reference TEWS, BROSE, GRIMM, TIELBÖRGER, WICHMANN, SCHWAGER and JELTSCH2004) and altering the structure and composition of feeding guilds (Sekercioglu et al. Reference SEKERCIOGLU, DAILY and EHRLICH2004), which determine the dynamics of pollination, seed dispersion and predation (Bailey et al. Reference BAILEY, HORNER-DEVINE, LUCK, MOORE, CARMEY, ANDERSON, BETRUS and FLEISHMAN2004, Ferrer & Donazar Reference FERRER and DONAZAR1996, Sekercioglu et al. Reference SEKERCIOGLU, DAILY and EHRLICH2004).
Previous findings demonstrate that habitat heterogeneity is an important determinant of species richness. In tropical environments, habitat heterogeneity might stimulate certain habitat resources (Anderson Reference ANDERSON2001, Koh et al. Reference KOH, LEE and LIN2006), producing positive correlations with species diversity, such as when forest cover (Bascompte & Rodríguez Reference BASCOMPTE and RODRÍGUEZ2001) or key resource conditions are sufficient (Tews et al. Reference TEWS, BROSE, GRIMM, TIELBÖRGER, WICHMANN, SCHWAGER and JELTSCH2004, Tscharntke et al. Reference TSCHARNTKE, SEKERCIOGLU, DIETSCH, SODHI, HOEHNAND and TYLIANAKIS2008, Tylianakis et al. Reference TYLIANAKIS, RAND, KAHMEN, KLEIN, BUCHMANN, PERNER and TSCHARNTKE2008). In addition, previous studies have generally shown that birds respond variously to habitat heterogeneity in disturbed forests of Central America (Estrada et al. Reference ESTRADA, CAMMARANO and COATES-ESTRADA2000, Graham & Blake Reference GRAHAM and BLAKE2001, Luck & Daily Reference LUCK and DAILY2003; see also recent reviews by Gardner et al. Reference GARDNER, BARLOW, CHAZDON, EWERS, HARVEY, PERES and SODHI2009, Scales & Marsden Reference SCALES and MARSDEN2008).
Our objective was to evaluate the predictability of bird diversity based on habitat heterogeneity data from a human-modified landscape in southern Mexico, where heterogeneity was determined by land-use cover classifications. We also considered the avian feeding guild concept in evaluating the organization of functional communities, identifying the resources affecting community structure. Bird assemblage included the entire bird community and its feeding guilds, which might constitute a range of mobilities, spatial dynamics and habitat associations.
In this paper, we test the hypothesis that habitat heterogeneity significantly explains the variation in species abundance and numbers of a bird community (Sekercioglu et al. Reference SEKERCIOGLU, DAILY and EHRLICH2004). In particular, we predict that feeding guilds that are able to utilize diverse resources or that possess wide ecological tolerance respond positively to increases in habitat heterogeneity (e.g. presence of omnivores, nectarivores); whereas more specialized guilds (e.g. frugivores, insectivores and granivores) may be negatively affected by heterogeneous habitats, instead preferring specific habitats with more uniform conditions.
METHODS
Study area
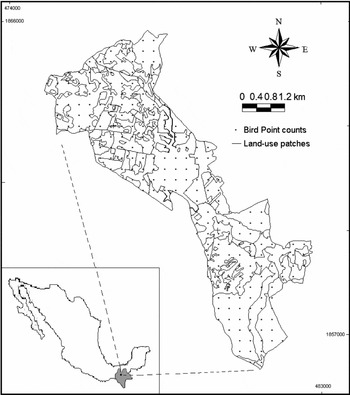
The study landscape comprises 22.5 km2 of tropical dry forest in the municipality of San Fernando, Chiapas, Mexico (hereafter San Fernando landscape; 16°52′18″N, 93°12′21″W, Figure 1). The altitude of the terrain ranges from 700 to 1000 m asl. Although the original tropical dry forest (TDF) vegetation persists, it has been fragmented into remnants accounting for less than 20% of the San Fernando landscape area, accompanied by a mixture of diverse vegetation types (León-Cortés et al. Reference LEÓN-CORTÉS, PÉREZ-ESPINOZA, MARÍN and MOLINA-MARTÍNEZ2004), thus constituting a gradient of ecological succession with agricultural management. Native forest fragments of varying composition and structure occur, as well as open areas that are dominated by pasture lands for cattle ranching and maize production, and human settlements (Arellano et al. Reference ARELLANO, LEÓN–CORTÉS and HALFFTER2008, León-Cortés et al. Reference LEÓN-CORTÉS, PÉREZ-ESPINOZA, MARÍN and MOLINA-MARTÍNEZ2004, Pinkus-Rendón et al. Reference PINKUS-RENDÓN, LEÓN-CORTÉS and IBARRA-NÚÑEZ2006). Despite negative effects from human disturbance on bird diversity in this area, it remains rich in endemism (Gordon & Ornelas Reference GORDON and ORNELAS2000, Rangel-Salazar et al. Reference RANGEL-SALAZAR, ENRÍQUEZ, WILL, González-Espinosa, Ramírez-Marcial and Ruiz-Montoya2005).
The San Fernando landscape in Chiapas, Southern Mexico, showing the distribution, contour of land-use patches and bird survey points (black dots).

Estimates of land-use covers and habitat heterogeneity
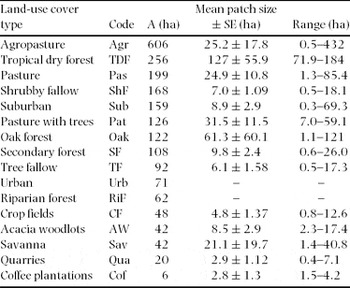
Previous comprehensive vegetation assessments from Chiapas (Breedlove Reference BREEDLOVE1981) along with field surveys (León-Cortés et al. Reference LEÓN-CORTÉS, PÉREZ-ESPINOZA, MARÍN and MOLINA-MARTÍNEZ2004) were used to identify and divide the San Fernando landscape into major land-use cover types. Land-use cover types were drawn onto a 1 : 75 000 spatial orthophoto (INEGI 2001) and vectorized into a Geographical Information System (Arc View version 3.1®;Figure 1). Major land-use types that could be identified from spatial orthophotos included tropical deciduous forest, secondary forest, abandoned tropical forest with distinct successional stages (5–8-y-old abandoned fragments), and Acacia woodlots consisting of single-species stands of Acacia pennatula (Schltdl. & Cham.) Benth. Also included were other land-use cover types that could be identified from spatial orthophotos, for example riparian forests and ravines, agricultural fields (Zea mays and/or Phaseolus spp. crops), hedgerows, pasture lands and abandoned quarries (León-Cortés et al. Reference LEÓN-CORTÉS, PÉREZ-ESPINOZA, MARÍN and MOLINA-MARTÍNEZ2004). In addition, the land-use cover classification was confirmed by line-transects surveys (McIntyre Reference MCINTYRE1953), that were set up in a stratified design to obtain estimates of plant species density and composition in each land-use cover type. In most cases two to five 100-m line-transects were established in each land-use cover type, giving a total of 63 transect locations. All plant species along line transects with a diameter at breast height (dbh) above 2.5 cm were recorded and identified. Line-transect data enabled us to characterize and confirm the identity of a total of 16 land-use cover types in the San Fernando landscape (Table 1; León-Cortés et al. Reference LEÓN-CORTÉS, PÉREZ-ESPINOZA, MARÍN and MOLINA-MARTÍNEZ2004, Pinkus-Rendón et al. Reference PINKUS-RENDÓN, LEÓN-CORTÉS and IBARRA-NÚÑEZ2006).
Habitat heterogeneity measured by land-use cover classification, and the total area A (ha), mean patch size ± SE, and range of each vegetation/land-use cover type in the San Fernando landscape, Chiapas, Southern Mexico. Urban and riparian forest were represented by a single patch each.

The San Fernando landscape was then divided using a 300-m grid cell. The extent of each vegetation or land-use cover was estimated from the vectorized maps at each 300 × 300-m grid cell and used to calculate a habitat heterogeneity index using Shannon's diversity index (O'Neill et al. Reference O'NEILL, KRUMMEL, GARDNER, SUGIHARA, JACKSON, DEANGELIS, MILNE, TURNER, ZYGMUNT, CHRISTENSEN, DALE and GRAHAM1988):

where pi is the proportional cover of each cover type within a concentric area (7.0 ha) of 150-m radius. This area was chosen to maximize the sample size across the San Fernando landscape without compromising potential relationships between bird populations and habitat structure (Sirami et al. Reference SIRAMI, BROTONS and MARTIN2008).
Bird surveys and diversity
Before counting birds, intensive 8-wk field surveys were conducted to sight and record birds present at the study site. These surveys and previous experience in comparable sites in Chiapas (Rangel-Salazar et al. Reference RANGEL-SALAZAR, ENRÍQUEZ, WILL, González-Espinosa, Ramírez-Marcial and Ruiz-Montoya2005) provided familiarity with the existing species and their accurate identification. Our surveys included resident, terrestrial birds and excluded vagile species (e.g. raptors, vultures, swallows, waterfowl, migratory and flying birds).
We used a point-count sampling method with a 300-m minimum distance between each point. Previous surveys suggested that this minimum distance provides a good balance between independence and sample size (Buckland Reference BUCKLAND2006, Hutto et al. Reference HUTTO, PLETSCHET and HENDRICKS1986). Each of the resulting 239 grid cells (each one represented a single point-count) was observed five times during the breeding season of April–December 2007 yielding a total of 1195 point-counts. Residents were recorded by sight or sound at each point-count for 10-min with a fixed 50-m radius (Hutto et al. Reference HUTTO, PLETSCHET and HENDRICKS1986). Bird counts were conducted daily from 05h45 to 10h30. To prevent detection bias, the same person (EP-DB) carried out all counts. Point-counts were randomly selected to reduce effects of daytime variation on species recordings.
For each grid cell we recorded the following bird diversity variables (based on the means from five visits): species richness (s), the Shannon species diversity index value (D). Each species recorded in each cell was assigned to a feeding guild (insectivores, frugivores, granivores, nectarivores and omnivores) (see Gray et al. Reference GRAY, BALDAUF, MAYHEW and HILL2006 and Ornelas et al. Reference ORNELAS, ARIZMENDI, NAVARIJO and BERLANGA1993 for guild descriptions). This feeding-guild classification reflects important ecological processes in diverse natural and semi-natural ecosystems (Sekercioglu Reference SEKERCIOGLU, Del Hoyo, Elliott and Christie2006). The accuracy of bird sampling over the entire bird fauna in San Fernando landscape was evaluated using Clench's function (Soberón & Llorente Reference SOBERÓN and LLORENTE1993).
Bird diversity and habitat heterogeneity
Product-moment correlations (Zar Reference ZAR2010) were calculated between bird species richness and Shannon diversity index values for the entire community and for bird feeding guilds and our estimates of habitat heterogeneity. Bird diversity measures and habitat-cover relationships (i.e. the amount of a single land-use cover) were examined using multiple regression models in a stepwise procedure (McDonald Reference MCDONALD2009, Whittingham et al. Reference WHITTINGHAM, STEPHENS, BRADBURY and FRECKLETON2006). All variables were checked for normality using Shapiro–Wilks W test and for homogeneity of variance using Bartlett's test (Zar Reference ZAR2010). The data were normalized for the proportions of the 16 land-use cover types using an arcsine transformation. Regression models were performed using generalized least-squares (GLS) procedures (Faraway Reference FARAWAY2004). Moran's I index was calculated from the raw data of the response variable (based on Geoda 0.9.5-I, Anselin et al. Reference ANSELIN, SYABRI and KHO2005) to reduce potential bias from spatial autocorrelations (Keitt et al. Reference KEITT, BJØRNSTAD, DIXON and CITRON-POUSTY2002), especially in the predictors because several cells are contained within the same cover type. This procedure weights from 1 to −1 the relative connectivity of neighbouring cells for any single plot and for any shape of the landscape. Values near zero signify little or no spatial autocorrelation. Model results were compared using the Akaike information criterion (AIC) because the calculated coefficient of determination is inappropriate as a measure of goodness of fit (Faraway Reference FARAWAY2004). All regression analyses were conducted using S-plus 2000©.
RESULTS
Community richness and composition
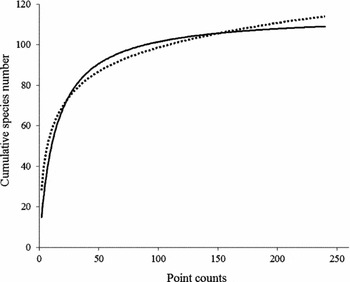
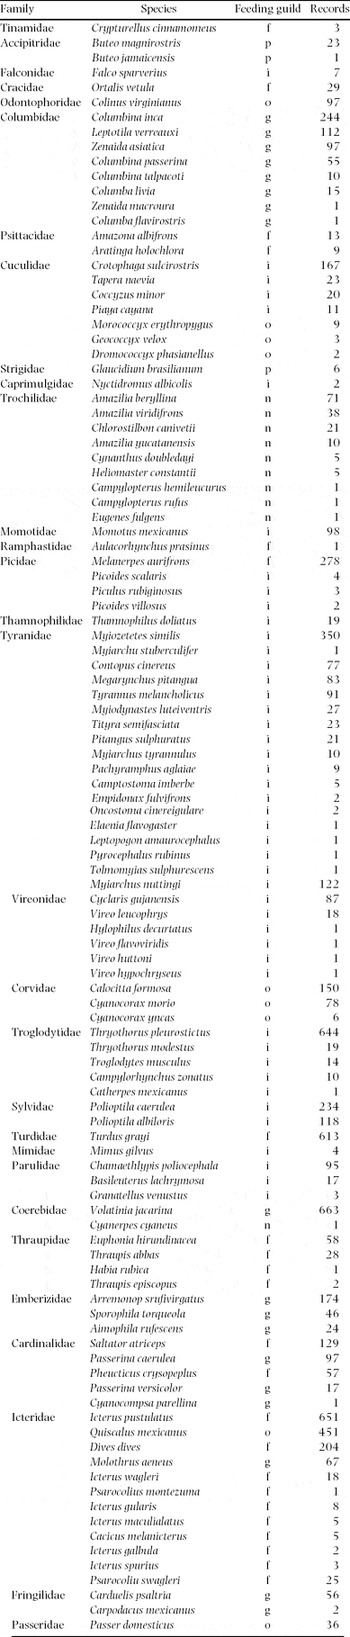
A total of 109 resident bird species were recorded in six feeding guilds (Appendix 1). Insectivores (46 species, 42%) were the most abundant, followed by frugivores (23 species, 21%), granivores (18 species, 17%), nectarivores (10 species, 9%), omnivores (9 species, 8%) and carnivores (3 species, 3%). Because carnivores were few, this guild was excluded from consideration. The estimated richness obtained with Clench's function indicated a rich landscape bird diversity with 98% of the expected species number (Figure 2).
Species accumulation curves for the bird community in the San Fernando landscape. The dotted line represents the observed accumulated number of species, and the solid line corresponds to the expected number of species after fitting Clench's non-linear function. Plots are based on fitted curves by random sampling of 293 point counts.

Bird diversity parameters and habitat heterogeneity
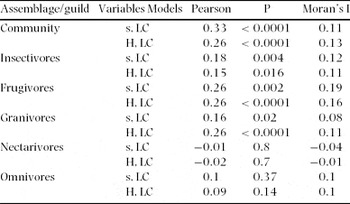
Species richness and Shannon's diversity index values for the bird community were significantly correlated with the habitat heterogeneity index (Table 2). We detected contrasting responses among bird feeding guilds. Measures of richness and diversity among insectivores, frugivores and granivores were positively correlated with the index. In contrast, we failed to detect significant correlations for nectarivores and omnivores. Values of Moran's I for spatial autocorrelation were low, indicating little potential bias in the partial correlation coefficients between bird community and the index of habitat heterogeneity (Table 2).
Pearson product-moment correlation values (Pearson) of species richness (s) and Shannon's diversity index (H) for the entire bird community, and for insectivores, frugivores, granivores, nectarivores and omnivores, with habitat heterogeneity index of land-use cover (LC), Moran's I denotes the level of spatial autocorrelation.

Bird response to the amount of land-use cover
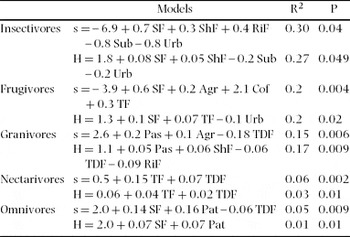
Land-use cover significantly affected bird feeding guilds in various ways (Table 3). Land area in secondary forest was especially important for insectivores and frugivores, accounting for 5% of the variance. The area in pastures was important to the changes in species richness and diversity for granivores. For nectarivores tree fallow and tropical dry forest were the main related habitat factors.
Best-fit multiple linear regression models, coefficient of determination (R2) and significance (P) for species richness (s), and Shannon's diversity index (H) for the entire bird community, and for insectivores, frugivores, granivores, nectarivores and omnivores. Land-use codes as in Table 1.

DISCUSSION
Bird diversity
Our results in a highly fragmented tropical landscape of 22.5 km2 showed substantial bird diversity in six feeding guilds comprising 7292 individual records from 109 resident species. These species constitute about 10% of Mexico's bird species and about 3% of those in the Neotropics (Rangel-Salazar et al. Reference RANGEL-SALAZAR, ENRÍQUEZ, WILL, González-Espinosa, Ramírez-Marcial and Ruiz-Montoya2005). A cumulative curve of observed species indicates that most of the resident and common species in San Fernando landscape were recorded. These constitute six feeding guilds: insectivores (42%), frugivores (21%), granivores (17%), nectarivores (9%), omnivores (8%) and carnivores (3%). The most common insectivore species were Thryothorus pleurostictus, Myiozetetes similis and Polioptila caerulea. Members of the Troglodytidae, Tyranidae and Sylvidae families, these birds are frequently associated with sylvopastoral systems. Frugivores and granivores also were common. Many frugivores and granivores nest in Bursera simaruba, Jatropha gaumeri and Ficus spp. trees and feed in open areas. Some have expanded their range with the growth in sylvopastoral land-use in San Fernando landscape. Therefore sylvopastoral land-use appears to provide a high-quality habitat for these species and guilds.
Bird diversity and habitat heterogeneity
Our findings indicate a significant positive relationship in San Fernando for species richness (diversity) and habitat heterogeneity for the entire bird community and for most of the trophic guilds we studied (Anderson Reference ANDERSON2001, Gray et al. Reference GRAY, BALDAUF, MAYHEW and HILL2006). However nectarivores showed a negative correlation with habitat heterogeneity, which may be due to the distribution of food resources (nectar) from specific plant composition and flower abundance across the landscape (Blake & Loiselle Reference BLAKE and LOISELLE2001). Omnivores appeared unaffected by habitat heterogeneity at our study site, perhaps because their feeding strategies spatially exceeded the boundaries of our area (Anderson Reference ANDERSON2001, Graham & Blake Reference GRAHAM and BLAKE2001). In our case, heterogeneous landscapes are beneficial for birds. Examples include crops intermingled with hedgerows or field margins, or where different crops are juxtaposed (Krebs et al. Reference KREBS, WILSON, BRADBURY and SIRIWARDENA1999). In dynamic fragmented landscapes like ours relatively small changes in land-use could contribute substantially to the maintenance of key ecosystem processes. The capacity of a fragmented landscape to support a diverse avifauna could be enhanced by increasing the density of fruiting trees, with live fences, and by protecting forest remnants. Hence, it is important to determine the components of habitat heterogeneity in alternative land-use covers affecting specific bird guilds and their impacts on ecosystem services and conservation on fragmented landscapes.
Feeding guilds and types of land-use cover
Bird populations in fragmented landscapes apparently respond resiliently to complex environmental combinations. Several distinct groups were formed based on their habitat relationships. The land-use cover associations of native species indicate that resource conditions are effectively met in natural as well as in human-modified environments. For example, secondary forests (representing 5% of the study area) explained changes in species numbers (63% of the variance) for the entire bird community and for key feeding guilds of insectivores, frugivores and nectarivores. High diversity in secondary forests results from their mixed composition, where ‘weedy’ plant species provide conditions for generalists and forest edge species, such as Turdus grayi. As expected, urban and suburban environments negatively affected species richness for insectivores and frugivores. This finding is consistent with previous evidence suggesting a reduction in native species and an increase in non-native or invasive species (Clergeau et al. Reference CLERGEAU, JOKIMÄKI and SAVARD2001, Koh et al. Reference KOH, LEE and LIN2006). Other San Fernando landscape elements such as quarries, fields, oak forests and savannas did not appear to be associated with changes in bird diversity, probably due to their small areas or because they represent low-quality habitat for most birds and other taxa (Caballero & León-Cortés Reference CABALLERO and LEÓN-CORTÉS2012, Pinkus-Rendón et al. Reference PINKUS-RENDÓN, LEÓN-CORTÉS and IBARRA-NÚÑEZ2006). More information about bird abundance and suitability of specific habitats is needed to better understand these functional relationships. An important implication of these findings is that certain cover types represent key landscape elements for increases in local bird diversity and for maintaining ecological guilds (Sekercioglu Reference SEKERCIOGLU, Del Hoyo, Elliott and Christie2006).
Throughout the Neotropics deforestation has yielded numerous small tropical forest fragments; the possible biodiversity impacts of such disturbances have been highlighted with respect to species losses and unfavourable ecological consequences, i.e. decrease of pollinator diversity, reduced seed dispersal distance, and within-species losses in genetic diversity (Sekercioglu Reference SEKERCIOGLU, Del Hoyo, Elliott and Christie2006, Tscharntke et al. Reference TSCHARNTKE, SEKERCIOGLU, DIETSCH, SODHI, HOEHNAND and TYLIANAKIS2008). Neotropical dry-forest landscapes possess high diversity and endemism, yet information is scarce about their conservation and management. Clearly, preservation of endangered species and their high-diversity habitats merit priority consideration in complex landscapes. Hence, independent conservation (preservation of high diversity, not used habitats) and land-use approaches may be appropriate in complex landscapes, while integrated conservation (creation of habitat, reducing agricultural intensity) and land-use methods may be best in relatively less complex landscapes (Tscharntke et al. Reference TSCHARNTKE, KLEIN, KRUESS, STEFFAN-DEWENTER and THIES2005). In this regard, traditional land-use practices in Mexico and elsewhere in Mesoamerica provide a valuable template for biodiversity conservation and provision of ecosystem services, where contemporary elements – management of sylvopastoral systems, for example – likely counteract the adverse effects of habitat loss from fragmentation. Small habitat fragments within landscapes constitute the final refuges for many species, and they may also represent safe refuge for sustaining functional guilds.
ACKNOWLEDGEMENTS
We thank the landowners of San Fernando for allowing access to their land and to G. Domínguez-Vázquez, H. Chacon-Sol and A. Molina-Martínez for helping with habitat classification surveys. This study was supported by El Colegio de la Frontera Sur through the research line: ‘Dinámica de Poblaciones y Comunidades de Insectos’, by a SEP-CONACYT doctoral grant to EPDB (Grant Number: 137599), and by CONACYT grant (J35230-V) to JLL-C. The ERMEXS program of the Mexican Ministry of Navy (SEMAR) facilitated SPOTS images to ECOSUR-LAIGE. We also thank T. Wiegand, R. Blake, M. A. Martínez, S. Calmé, M. Hiron, K. Cockle, G. Castillo and two anonymous reviewers for important comments and suggestions on early drafts of the manuscript.
Check-list of 109 bird species and total number of records in the San Fernando landscape, Chiapas. Bird feeding guilds: f = frugivores, g = granivores, i = insectivores, n = nectarivores and o = omnivores (sensu Gray et al. Reference GRAY, BALDAUF, MAYHEW and HILL2006, Ornelas et al. Reference ORNELAS, ARIZMENDI, NAVARIJO and BERLANGA1993). Species names and taxonomic order followed Howell & Webb (Reference HOWELL and WEBB1995).