INTRODUCTION
A key question in research concerned with relations between adult age and neurocognitive functioning is how many separate age-related influences are operating across a broad range of neuropsychological and cognitive variables. The question is important because the answer is relevant to the number, and possibly the nature, of explanations that will eventually be required to account for cross-sectional age differences in neuropsychological and cognitive performance.
The current project addresses this question from the perspective of two well-established results. First, a very large number of neuropsychological and cognitive variables are negatively related to increased age (for reviews, see Craik & Salthouse, Reference Craik and Salthouse2008; Salthouse, Reference Salthouse1991). Not all variables have negative age relations, because variables which emphasize knowledge acquired from processing carried out earlier in life tend to have higher scores at older ages. Nevertheless, a great many variables that assess efficiency of processing at the time of assessment have been found to have lower levels at more advanced ages. And second, what has been asserted to be “arguably the most replicated result in all psychology” is that cognitive variables tend to be positively correlated with one another (Deary, Reference Deary2000, p. 6), which implies the variables can be organized into a structure based on their patterns of correlations with each other. Furthermore, there is currently a consensus that a well-fitting structure involves a hierarchy, with progressively fewer constructs at successively higher levels in the hierarchy (e.g., Carroll, Reference Carroll1993; Deary, Reference Deary2000; Gustaffson, Reference Gustafsson and Sternberg1988, Reference Gustafsson, Braun, Jackson and Wiley2002; Jensen, Reference Jensen1998).
An advantage of the hierarchical structure of neuropsychological and cognitive abilities is that it allows a researcher to investigate where cross-sectional age relations operate on the structure (Salthouse, Reference Salthouse1998, Reference Salthouse2004; Salthouse & Czaja, Reference Salthouse and Czaja2000; Salthouse & Ferrer-Caja, Reference Salthouse and Ferrer-Caja2003), which in turn could have implications for the nature of those influences. For example, if age-related influences were found to operate only at the bottom of the structure, it would suggest that cross-sectional age differences are primarily evident at the level of individual neuropsychological or cognitive variables. However, if age relations were found at higher levels, it would suggest the existence of broader influences that are shared across different types of variables.
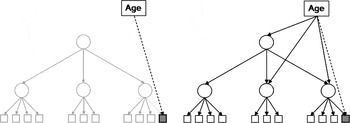
Another advantage of this kind of organizational structure is that it can be used to estimate the relative contributions of different types of influences on a given target variable. This point can be elaborated by considering Figure 1, which portrays a hierarchical structure in which the primary interest is in the relation of age to a single target variable. The left panel indicates that age relations can be examined while ignoring the structure among the variables and the relations of age on the structure. However, even though the other influences are not assessed in this model, they can still affect the target variable, and thus the simple relation of age can be postulated to represent an undifferentiated mixture of influences that are unique to the variable, and influences that are shared with other abilities and variables. The right panel in Figure 1 portrays a model in which the age-related influences on the target variable are examined after controlling age-related influences on other variables or ability constructs in the structure. The standardized coefficient for age in this model therefore represents the influence of age on the target variable that is independent of influences operating at higher, or more abstract, levels. Because these direct relations represent what is not shared with influences on other variables, they can be interpreted as what needs to be explained in terms of specific age relations on the variable.
Schematic illustration of two approaches to examining the relation between age and a target variable. In the left panel, the variable is considered in isolation, and in the right panel, it is considered in the context of other variables to which it is related.

Although the primary individual difference variable of interest in the current project is adult age, the same types of analytical procedures can be used to investigate the nature, and breadth, of neurocognitive differences associated with virtually any individual difference characteristic. For example, similar types of hierarchical analyses have been used in a study of AIDS patients (Becker & Salthouse, Reference Becker and Salthouse1999), and in a study of individuals with Alzheimer’s disease (Salthouse & Becker, Reference Salthouse and Becker1998).
There were two goals of the current project. The first goal was to examine the level at which cross-sectional age relations operate in a hierarchical structure to determine the breadth of age-related influences on neuropsychological and cognitive functioning. The second goal was to decompose the simple age correlations on a variety of neuropsychological and cognitive variables into total and unique age-related influences. The initial data set, based on the normative data from the WAIS-IV and WMS-IV test batteries, was nearly ideal for addressing these goals as it is based on a broad and representative sample of the population, with each participant providing data on a large variety of reliable variables. To examine the generalizability of the results, parallel analyses were also conducted on aggregate data from the authors’ laboratory (the Virginia Cognitive Aging Project), which involved different combinations of variables and an independent sample of participants.
DATA SET 1
Method
The data reported in this manuscript were acquired in compliance with the regulations of our local institutions and with the review and approval of the Institutional Review Board.
Participants
The data in the first data set were obtained from the samples used to establish norms for the WAIS-IV (Wechsler, Reference Wechsler2008) and WMS-IV (Wechsler, Reference Wechsler2009) test batteries. The participants in these samples were selected to match demographic proportions in the U.S. population, and they ranged from 16 to 90 years of age. The sample sizes differed across variables, because some of the tests were not administered to adults over age 69, and there was only partial overlap of the individuals in the samples used to establish the WAIS-IV norms and the WMS-IV norms. Further details on the sampling methods, and the representativeness of the samples, can be found in the Technical and Interpretive Manuals (i.e., Wechsler, Coalson & Raiford, Reference Wechsler, Coalson and Raiford2008; Wechsler, Holdnack & Drozdick, Reference Wechsler, Holdnack and Drozdick2009). Brief descriptions of the variables included in the analyses are contained in the Appendix, and more details are available in the manuals (i.e., Wechsler, Reference Wechsler2008, Reference Wechsler2009; Wechsler et al., Reference Wechsler, Coalson and Raiford2008; Reference Wechsler2009).
RESULTS AND DISCUSSION
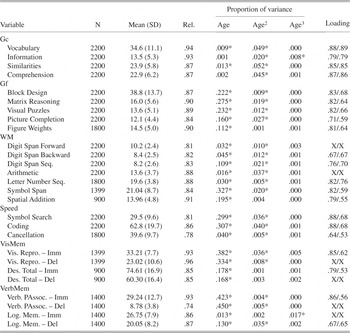
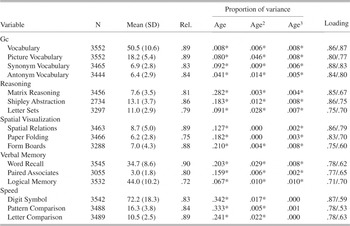
Table 1 contains descriptive statistics for all variables, including means, standard deviations, reliabilities, proportions of variance associated with linear, quadratic, and cubic age relations, and factor loadings before and after partialling age.
WAIS/WMS-IV Data

* p < .01.
Note. The first value in the Loading column is the loading when age was ignored, and the second was the loading when age was partialled from all variables. X indicates that the variable was not included in the factor analysis and therefore does not have a loading. Fit Statistics for the Correlated Factors Model in Figure 2. Ignoring age: Chi-Squared = 1467.44/df = 174, CFI = .950, RMSEA = .054, 90% CI = .051 − .056. Age-partialled: Chi-Squared = 1038.86/df = 174, CFI = .969, RMSEA = .044, 90% CI = .042 − .047.
Internal consistency estimates of the reliabilities of the variables were obtained from Table 4.1 of the WAIS-IV manual (Wechsler et al., Reference Wechsler, Coalson and Raiford2008) and from Table 3.1 of the WMS-IV manual (Wechsler et al., Reference Wechsler, Holdnack and Drozdick2009). It can be seen that the reliabilities for most of the variables were above .80. Although not reported here, test–retest reliabilities for the reliabilities were also relatively high. For example, the values in Table 4.5 in the WAIS-IV manual ranged from .69 to .91, and those in Table 3.4 of the WMS-IV manual ranged from .62 to .81.
To minimize collinearity among the linear, quadratic, and cubic age relations, the age variable was first centered by subtracting each value from the mean, and then the age-centered values were squared to create a quadratic age term and cubed to create a cubic age term (cf. Cohen & Cohen, Reference Cohen and Cohen1983, p. 238). These three variables were then entered in successive steps in multiple regression equations predicting each WAIS-IV or WMS-IV variable to determine the proportions of variance associated with linear, quadratic, and cubic age trends. The linear age relations were positive for the vocabulary and information variables, but were negative for the other variables. Most of the variables also had significant quadratic age relations, in the direction of accelerated decline at older ages, but with only a few exceptions, the quadratic relations were much smaller than the linear relations. The cubic age trends were significant only for the Information and Logical Memory variables, and in both cases reflected an initial dip followed by a rise and later decline.
Separate location and content scores were available from the Designs subtest, but because they were highly correlated with one another, and had similar correlations with age, only the total score was used in the analyses. Correlations between scores in the immediate and delayed versions of the memory tests were also quite strong (i.e., range from .72 to .93), and thus only one score was included in subsequent analyses to avoid redundancy. Unique relations with age on the delayed variable after controlling the variance in the immediate variable were examined to determine which of the two versions to include. The unique age-related variance (i.e., R2) in the delayed version after controlling the variance in the immediate version was only .007 in the Designs test, .008 in the Verbal Paired Associates test, and .017 in the Visual Reproduction test. At least with these variables, therefore, the delayed versions of the tests do not add appreciable information over the immediate versions with respect to their relations with age. However, the unique age-related variance in the Delayed Logical Memory test was .198, which was actually larger than the age-related variance in the Immediate Logical Memory test. This pattern of results led to the decision to use only the immediate variable of each test in the analyses, except for the Logical Memory test in which only the delayed version was used. Finally, to focus on the simplest representation of the ability factors, two variables with weak or split loadings on the primary factors, Digit Span Forward and Arithmetic, were also deleted from subsequent analyses.
Factor analyses and structural equation models were conducted with the AMOS statistical package (Arbuckle, Reference Arbuckle2007), using the Full Information Maximum Likelihood algorithm to deal with missing data. Based on factor analysis results reported in the manuals, a confirmatory factor analysis with six factors was conducted. Four of the factors were similar to those identified in the WAIS-IV manual, namely, Gc (termed Verbal Comprehension in the WAIS-IV), Gf (termed Perceptual Reasoning in the WAIS-IV), and Working Memory (WM) and Speed (Spd). The other two factors were based on tests from the WMS-IV and were labeled verbal memory (VbM) and visual memory (ViM), respectively.
Two separate analyses were conducted, with the age-related variation on the variables ignored in the first analysis, and the age-related variation partialled from all scores in the second analysis. The purpose of the second analysis was to examine the extent to which the structure among the variables might have been influenced by the relations of the variables to age. That is, when several variables are all related to age, some of the relations among them could be spurious and merely reflect the relations of each variable with age. By removing the relations of age from all variables, the second analysis eliminates the possibility that the relations among the variables are influenced by the relations of each to age.
Inspection of the entries in Table 1 reveals that the factor loadings were slightly weaker when the age-related variance in the variables was controlled, with the largest difference between the two sets of values for the variables which had the strongest age relations. The bottom of the table contains fit statistics for the structural models portrayed in Figure 2 when all age relations on the variables were ignored, and after partialling age from all variables. Because Kline (Reference Kline2005) notes that rules of thumb for good fits are comparative fit indices (CFI) above .90 and RMSEA values below .08, the model can be considered to provide a relatively good fit to the data.
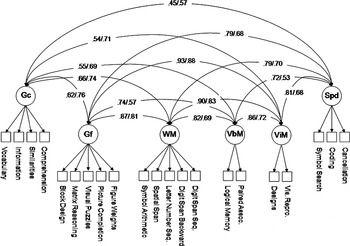
Correlations among the six ability constructs specified in the Wechsler data. The first number in each set is the correlation ignoring age, and the second is the correlation after partialling age-related variation from each variable. Gc refers to crystallized ability, Gf to fluid ability, WM to working memory, VbM to verbal memory, ViM to visual memory, and Spd to speed. All portrayed correlations are significantly different from zero (p < .01).

Figure 2 portrays the correlations among the cognitive ability factors, with the first number in each pair representing the simple correlation between the constructs, and the second number representing the correlation after age-related influences were partialled from each variable. It can be seen that some correlations, particularly those involving Gc, were larger after the age-related variation was controlled, and others, particularly those involving speed, were smaller after control of the age-related variation. The shift in the strengths of the Gc correlations likely occurs because the mean age trend for the Gc construct was in the opposite direction of that for the other constructs, and therefore the correlations were partially suppressed when the age variation was included. The shift for the speed construct was in the direction of weaker relations after controlling speed, possibly because when age was ignored the correlations were inflated by the strong relations of the constructs to age. Despite these differences, it is important to note that the organizational pattern was qualitatively very similar before and after controlling the age-related variance, and therefore it seems reasonable to conclude that the organizational structure was not seriously distorted by variation in age.
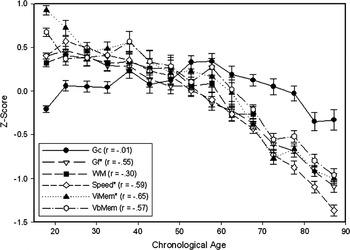
Figure 3 portrays the age relations on composite scores formed by averaging the z-scores for the variables contributing to each factor. Notice that there was very little relation of age to the Gc composite score, but that all of the other composites had similar negative age relations that were nearly continuous from the 20s and 30s.
Mean composite scores (with standard errors) as a function of age in the Wechsler data. Note that not all participants were administered some tests, and therefore the Figure Weights variable is not included in the Gf composite, the Cancellation variable is not included in the Speed composite, and only the Visual Reproduction variable is reported for visual memory.

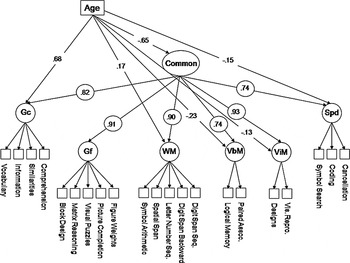
Because correlations between variables or constructs can be postulated to be caused by their shared dependence on a higher-order factor, an alternative representation of the correlations in Figure 2 is the hierarchical structure portrayed in Figure 4. Coefficients in circles in this figure represent loadings of the cognitive ability constructs on the 2nd-order common factor when age was partialled from all variables and was not included as a predictor of any of the constructs. The rationale for the age-partialling was to identify the hierarchical structure without any distortion induced by the relations of age to the variables or constructs. Notice that there were strong relations between each of the 1st-order cognitive ability constructs and the 2nd-order common factor, with three of them (i.e., Gf, WM, and visual memory) .90 or greater.
Hierarchical structure for the Wechsler variables. The numbers in circles are the standardized loadings of the cognitive ability factors on the higher-order common factor in an initial analysis in which age was partialled from each variable. The other numbers are standardized coefficients for the linear age relations on the constructs. Gc refers to crystallized ability, Gf to fluid ability, WM to working memory, VbM to verbal memory, ViM to visual memory, and Spd to speed. All coefficients are significantly different from zero (p < .01).

To determine whether the coefficients from the 2nd-order common factor were different from 1.0, a series of models was examined in which each coefficient was separately constrained to 1.0 to determine if this resulted in a significant loss of fit of the model to the data. The analyses revealed that constraining the Gf, WM, and ViM coefficients to 1.0 did not result in a significant loss of fit (i.e., ∆χ2 < 1, df = 1), but constraining the Gc, Speed, and VbM coefficients all resulted in significantly poorer fit (i.e., ∆χ2 > 48, df = 1). Based on these results it can be concluded that the Gf, WM, and ViM coefficients were not significantly different from 1.0.
The influence of individual difference variables on the hierarchical structure was examined by starting at the top, and then successively considering constructs from left to right, retaining the path if the coefficient was significantly different from zero. (See Salthouse, Reference Salthouse2004, for the rationale for starting at the top in this type of hierarchical analysis.) Although the primary interest in this report was in age as the individual difference variable, sex differences were first examined with a coding of 0 for male and 1 for female. The significant (p < .01) standardized relations for the sex influences were −.06 on Gc, −.10 on Gf, .06 on verbal memory, and .12 on Speed. This pattern reflects a slight female advantage on tests of verbal memory and speed, and a slight male advantage on tests of Gc and Gf.
Figure 4 illustrates the significant linear age relations on the constructs in the hierarchical structure. (More complex models with quadratic and cubic age terms were also examined, but these additional age terms were associated with relatively small increments in model fit and thus only the models with the linear age term are reported.) Notice that there was a large negative linear age relation on the highest-order common factor, a large positive relation on Gc, a small positive relation on WM, and small negative relations on verbal memory, visual memory, and speed.
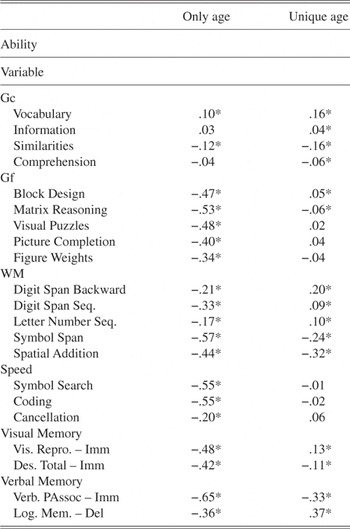
Although the model in Figure 4 may appear rather complex, it is parsimonious in the sense that it represents the age relations on 21 variables with only 6 age relations. One way to examine the accuracy of the model in reproducing the age relations is to determine the magnitude of direct relations between age and a variable in the context of the model. That is, large direct relations between age and a variable indicate that the influences in the model do not account for all of the age relations in that variable. Standardized linear age relations for the total and unique age-related influences on individual neuropsychological and cognitive variables based on the model in Figure 4 were, therefore, computed, and are presented in Table 2.
Standardized regression coefficients for linear age relations on individual cognitive variables, WAIS-IV/WMS-IV data

* p < .01.
Note. The column labeled “Only age” contains the simple correlation with age as portrayed in the left panel of Figure 1. The column labeled “Unique age” contains the standardized regression coefficient for age after considering relations on the hierarchical structure, as portrayed in the right panel of Figure 1.
Inspection of Table 2 reveals that most of the variables other than those representing Gc had much smaller age relations when the age-related differences were considered within the context of other cognitive variables. In fact, the median age coefficient for the simple relation was −.44 and it was only .02 for the unique age relation. At least for the non-Gc variables, therefore, it appears that large proportions of the cross-sectional age differences on the variables were shared, and were not unique to the variable.
The reduction in the magnitude of the age relations was smaller for the Symbol Span and Spatial Arithmetic variables, possibly because the other WM tasks involved alphanumeric verbal material and had smaller total age relations. The reduction was also small for the Verbal Paired Associates variable, and the sign of the unique age relation was reversed with the Logical Memory variable. This reversal pattern is likely a consequence of combining two variables with different age relations in a single latent construct such that when both are modeled with the same age coefficient, the age relations on one variable are underestimated, whereas those on the other variable are overestimated.
To summarize, a model in which six factors represented the 21 variables was found to provide a reasonably good fit to the combined WAIS-IV and WMS-IV data. When reconfigured as a hierarchical model, the Gf, WM, and visual memory constructs all had extremely high relations with the higher-order factor. There were large negative age-related influences at the highest level in the hierarchy, and in addition, a moderate positive relation on Gc, and additional negative relations on the speed and memory constructs. After taking the age-related influences on these constructs into consideration, most of the direct age relations on individual neuropsychological and cognitive variables were very small and many were not significantly different from zero.
DATA SET 2
To examine the generalizability of the patterns reported above, the same types of analyses were repeated with data from the Virginia Cognitive Aging Project (VCAP), based on data aggregated across studies conducted in the Salthouse Cognitive Aging Laboratory since 2001. The participants in these studies were recruited from newspaper advertisements, flyers, and referrals from other participants. As with Data Set 1, the data were acquired in compliance with the regulations of our local institutions and with the review and approval of the Institutional Review Board.
The combination of tests varied somewhat over time, and therefore not all participants were administered every test. However, the sample size was over 3,500 for some variables. The variables are briefly described in the Appendix, and more details are available in other publications (e.g., Salthouse, Reference Salthouse2004; Salthouse & Ferrer-Caja, Reference Salthouse and Ferrer-Caja2003; Salthouse, Siedlecki & Krueger, Reference Salthouse, Siedlecki and Krueger2006).
Table 3 is analogous to Table 1 in that the means, standard deviations, reliabilities, age relations, and factor loadings are presented for each variable. Notice that the reliabilities were generally high, and the median internal consistency reliability of the variables was .83. Test–retest reliabilities for the variables are reported in Table 2 of Salthouse and Tucker-Drob (Reference Salthouse and Tucker-Drob2008), where the range was from .77 to .93. Most of the age trends were linear, but they were small and positive for the Gc vocabulary variables, and larger and negative for the remaining variables. In contrast to Data Set 1 in which only 2 of 21 variables had significant cubic age trends, all but the 3 speed variables had significant cubic age trends reflecting a dip, rise, and decline. These cubic age trends may be attributable to slightly less select samples of adults in their 30s and 40s relative to other age groups in the VCAP data set.
VCAP (Virginia Cognitive Aging Project)

* p < .01.
Note. The first value in the Loading column is the loading when age was ignored, and the second was the loading when age was partialled from all variables. Fit Statistics for the Correlated Factors Model in Figure 5. Ignoring Age: Chi-Squared = 1932.53/df = 94, CFI = .946, RMSEA = .074, 90% CI = .071 − .077. Age-partialled: Chi-Squared = 1238.87/df = 94, CFI = .970, RMSEA = .058, 90% CI = .056 − .061.
Based on prior research with these variables (e.g., Salthouse, Reference Salthouse2004; Salthouse & Ferrer-Caja, Reference Salthouse and Ferrer-Caja2003), a confirmatory factor analysis was specified with 5 factors, each represented by either 3 or 4 variables. This model provided a relatively good fit to the data, and it can be seen in Table 3 that all variables had loadings above .70. Furthermore, most of the loadings were only slightly smaller when the analysis was based on age-partialled residuals.
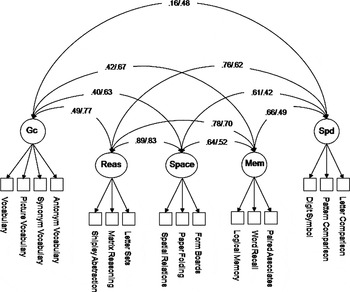
Figure 5 portrays correlations among the cognitive abilities. As in the Wechsler data, the correlations among the abilities were larger with Gc, and smaller with speed, when the age-related variation was controlled.
Correlations among the five ability constructs specified in the VCAP data. The first number in each set is the correlation ignoring age, and the second is the correlation after partialling age-related variation from each variable. Gc refers to crystallized ability, Reas to inductive reasoning, Space to spatial visualization, Mem to (verbal) memory, and Spd to speed. All portrayed correlations are significantly different from zero (p < .01).

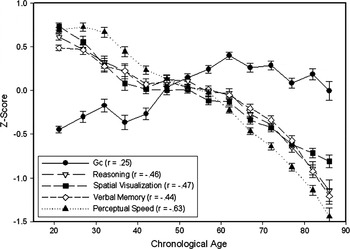
Means for the composite scores representing each factor are portrayed in Figure 6 as a function of age. Similar to the Wechsler data, the age relations on the composites were all negative except for the Gc composite, which was slightly positive.
Mean composite scores (with standard errors) as a function of age in the VCAP data.

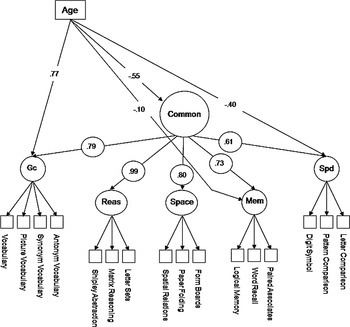
The hierarchical model is portrayed in Figure 7 with coefficients in circles corresponding to the standardized loadings of the ability constructs on the higher-order construct when the influences of age were partialled from all variables. All of the 1st-order ability constructs had moderate to strong relations with the 2nd-order common factor, with the Gf construct having a relation of essentially 1.0. Constraining the coefficients of the 1st-order factors on the 2nd-order factor resulted in a significant loss of fit (i.e., ∆χ2 > 53; df = 1) for all but the Gf factor, indicating that the coefficients of these other factors were all significantly less than 1.0.
Hierarchical structure for the VCAP variables. The numbers in circles are the standardized loadings of the cognitive ability factors on the higher-order common factor in an initial analysis in which age was partialled from each variable. The other numbers are standardized coefficients for the linear age relations on the constructs. Gc refers to crystallized ability, Reas to inductive reasoning, Space to spatial visualization, Mem to (verbal) memory, and Spd to speed. All coefficients are significantly different from zero (p < .01).

As with the Wechsler data, influences associated with sex were examined first, again coding males as 0 and females as 1. The standardized relations were −.07 on Gc, −.19 on Space, .19 on Memory, and .13 on Speed. The pattern of a female disadvantage on Gc, but an advantage on memory and speed, is very similar to the results with the Wechsler data.
The age relations in the hierarchical structure are portrayed in Figure 7, where it can be seen that there was a large negative relation of age on the highest-order common factor, a large positive age relation on Gc ability, and negative age-related influences on verbal memory and speed abilities.
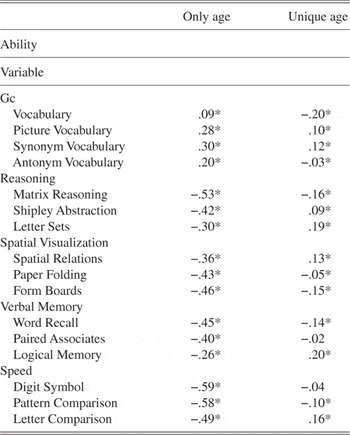
Table 4 contains the linear age relations on individual variables before and after control of variation in other variables. The pattern is again similar to that with the Wechsler data in Table 2 as most of the non-vocabulary variables had much smaller unique than total age relations. In fact, the median total age relation was −.44, exactly the same as in the Wechsler data, whereas the median unique age relation was only −.03.
Standardized regression coefficients for linear age relations on individual cognitive variables, VCAP data

* p < .01.
Note. The column labeled “Only age” contains the simple correlation with age as portrayed in the left panel of Figure 1. The column labeled “Unique age” contains the standardized regression coefficient for age after considering relations on the hierarchical structure, as portrayed in the right panel of Figure 1.
GENERAL DISCUSSION
One important finding from these analyses is that very similar results were obtained across two separate data sets with independent samples of participants and different combinations of cognitive variables. This is noteworthy because the Wechsler data were based on a sample selected to match demographic proportions in the United States, whereas the participants in VCAP were largely a sample of convenience.
In both data sets there were moderately strong correlations among the variables, and reasonably good fits of the data to a model in which the variables were organized into a structure with correlated neurocognitive abilities. When the correlated abilities were rearranged into a hierarchical structure, there were strong relations of reasoning (.99), Gf (.91), WM (.90), and visual memory (.93) to the highest-order factor. These strong relations are consistent with numerous earlier reports (e.g., Gustaffson, Reference Gustafsson and Sternberg1988, Reference Gustafsson, Braun, Jackson and Wiley2002; Salthouse, Reference Salthouse2004; Salthouse & Davis, Reference Salthouse and Davis2006), and suggest that the individual differences in these abilities overlap nearly completely with individual differences in the higher-order construct representing what is shared among different cognitive abilities. Stated somewhat differently, these results suggest that the 2nd-order construct and the constructs representing reasoning, Gf, working memory, and visual memory, may reflect essentially the same dimension of cognitive functioning.
The two data sets also had similar patterns of sex differences in the hierarchical structure. In both cases females had higher average levels in verbal memory and speed, and slightly lower levels in Gc, but there were no sex differences on the highest order common factor.
The age-related differences were also consistent in the two data sets as is apparent in the age trends on composite scores in Figures 3 and 6, and in the pattern of age relations in Figures 4 and 7. In the hierarchical models there was a strong negative influence of age on the highest order factor, and in addition, a moderate positive influence on Gc, and negative influences on speed and some measures of memory. This general pattern is very similar to that reported in other data sets (Salthouse, Reference Salthouse1998; Salthouse & Czaja, Reference Salthouse and Czaja2000; Salthouse & Davis, Reference Salthouse and Davis2006). Taken together, these results suggest that a large proportion of the cross-sectional age-related influences on many individual cognitive variables are shared, and that at least some of the influences likely operate at more abstract levels of abilities or higher order factors, and not simply at the level of individual variables. Not all of the age-related influences are shared because the entries in Tables 2 and 4 indicate that unique age relations on individual variables were often significantly different from zero. Because these unique relations are statistically independent of influences through the higher-order factors, they will require additional explanatory mechanisms beyond those that could account for influences on the factors. However, it is important to note that the unique age relations were always much smaller than the simple or total age relations, which suggests that at least some of the influences were shared.
The results of these analyses, together with results from other studies, have important implications for explanations of individual, and particularly age-related, differences in neuropsychological and cognitive functioning. That is, the explanatory focus could be quite different if other influences on the target variables are ignored because a researcher might try to account for all of the age-related influences when only a small portion of the age relations are specific to the variable. Consider the matrix reasoning variable. A total of 25% of the variance in this variable was related to age, but less than 4% was specific to the variable when the age-related influences were considered in the context of age-related influences on other variables. Comparable values in the VCAP data were 25% and 3%, respectively. A very similar pattern was evident with the digit symbol (coding) variable, as the total and unique variance associated with age in the Wechsler data was 30% and 0%, respectively, and 35% and less than 1%, respectively, in the VCAP data.
A researcher might try to explain the age-related effects on a variable with a task-specific strategy of identifying relations among matrix elements in matrix reasoning, or learning associations between digits and symbols in the digit symbol substitution task. However, if the proposed explanatory mechanisms are not applicable to other variables found to share age-related influences, they would only be able to account for a small fraction of the total age relations on the variables.
An alternative research approach might involve trying to explain the shared influences in addition to the unique influences. This will likely require a combination of interpretations that are specific to the variable (e.g., task-specific strategy or processes) and that are shared across different variables (e.g., ability to conceptualize, plan, organize, execute, hold information in mind, etc.). The behavioral patterns described above clearly suggest that there is overlap of the age-related influences across different neuropsychological and cognitive variables. An informative next step might involve examining whether the variables with shared age-related influences also share neurobiological substrates, such as the involvement of the same neuro-anatomical regions or circuits.
Another promising direction for future research is to investigate whether similar patterns of shared age-related influences are evident with longitudinal data. There is some evidence that this is the case (Tucker-Drob, Reference Tucker-Drob2009), but much more research is needed before strong conclusions can be reached.
In conclusion, the results reported here indicate the value of adopting a multivariate perspective in analyses of neuropsychological and cognitive functioning. Very few, if any, neuropsychological or cognitive variables exist in isolation, and conclusions about the nature and magnitude of effects on specific variables can be misleading if the variables are treated as though they were independent. The magnitude of the association with a specific variable could be overestimated, and the breadth of the impact of the individual difference variable could be underestimated, when a researcher focuses on a single variable, or multiple variables are treated as though they were independent of one another.
ACKNOWLEDGMENTS
Standardization data from the Wechsler Adult Intelligence Scale-Fourth Edition (WAIS-IV). Copyright @ 2008 by NCS Pearson, Inc. Used with permission. All rights reserved. Standardization data from the Wechsler Memory Scale-Fourth Edition (WMS-IV). Copyright @ 2009 by NCS Pearson, Inc. Used with permission. All rights reserved.
The Virginia Cognitive Aging Project (VCAP) data were obtained with support from a grant from the National Institute on Aging (R37 AG024270).
APPENDIX
WAIS-IV Variables
Vocabulary: Provide definitions of words or name pictured items.
Similarities: State how two words are similar.
Information: Answer questions of general information.
Comprehension: Answer questions relating to common knowledge or social situations.
Block Design: Assemble blocks to match a pictured design.
Matrix Reasoning: Select the best option that completes a matrix or series.
Visual Puzzles: Select the pieces that will complete a larger shape.
Figure Weights: Select weights to balance a scale.
Picture Completion: Determine which piece is missing from a picture.
Digit Span Forward: Recall a list of numbers in the original order.
Digit Span Backward: Recall a list of numbers in the reverse order of presentation.
Digit Span Sequencing: Recall a list of numbers in ascending order.
Arithmetic: Solve a series of arithmetic word problems.
Letter-Number Sequencing: Listen to an intermixed set of letters and numbers and recall the numbers in numerical order and the letters in alphabetical order.
Symbol Search: Identify target symbols.
Coding: Copy symbols associated with numbers according to a code key.
Cancellation: Cancel out all target shapes.
WMS-IV Variables
Logical Memory I: Immediate recall of idea units from stories.
Logical Memory II: Delayed recall and recognition of story information.
Verbal Paired Associates I: Immediate recall of the second word from a set of word pairs.
Verbal Paired Associates II: Delayed recall of the second word from the word pairs.
Designs I: Immediate reproduction of designs in a grid.
Designs II: Delayed reproduction and recognition of designs in a grid.
Visual Reproduction I: Immediate reproduction of visual figures.
Visual Reproduction II: Delayed reproduction and recognition of visual figures.
Spatial Addition: Addition or subtraction of elements from a grid.
Symbol Span: Immediate reproduction of a sequence of abstract symbols.
Data Set 2 (VCAP)
Matrix Reasoning: Determine which pattern best completes the missing cell in a matrix.
Shipley Abstraction: Determine the words or numbers that are the best continuation of a sequence.
Letter Sets: Identify which of five groups of letters is different from the others.
Spatial Relations: Determine the correspondence between a 3-D figure and alternative 2-D figures.
Paper Folding: Determine the pattern of holes that would result from a sequence of folds and a punch through the folded paper.
Form Boards: Determine which combinations of shapes are needed to fill a larger shape.
Logical Memory: Number of idea units recalled across three stories.
Word Recall: Number of words recalled across trials 1 to 4 of a word list.
Paired Associates: Number of response terms recalled when presented with a stimulus item.
Digit Symbol: Use a code table to write the correct symbol below each digit.
Letter Comparison: Same/different comparison of pairs of letter strings.
Pattern Comparison: Same/different comparison of pairs of line patterns.
WAIS Vocabulary: Provide definitions of words
WJ-R Picture Vocabulary: Name the pictured object
Antonym Vocabulary: Select the best antonym of the target word
Synonym Vocabulary: Select the best synonym of the target word