Introduction
The fraction of the Northern Hemisphere land-surface area covered by snow varies greatly through the year. This seasonal variation in snow cover is an important feature of the climate because the unique properties of snow significantly affect interactions between the land surface and the atmosphere. A snowpack increases the surface albedo, insulates the ground from the atmosphere, stores water, and changes the roughness of the surface. Extensive snow cover can modify overlying air masses and influence the large-scale circulation of the atmosphere. A review of studies of snow cover and climate is given by Reference CohenCohen (1994).
General circulation models (GCMs) provide tools for studying climate and climate change. It is important that GCMs should represent both the extent and the impact of snow cover. This paper discusses seasonal snow cover simulated by the Hadley Centre GCM in both current and future climates.
The high albedo of snow reduces the absorption of solar radiation at the surface, and provides a possible positive feedback mechanism for climate change; reduced snow cover in a warmer climate will tend to decrease the planetary albedo, reinforcing the warming of the atmosphere. Snow cover could increase, however, if climate changes increase the snowfall in high-latitude regions, where temperatures are well below 0°C through most of the year and snow accumulation is presently limited by moisture availability rather than by temperature. Indirect effects due to, for example, changes in surface temperature and cloudiness complicate the interpretation of feedbacks between snow cover and climate change. A study involving 17 GCMs found snow-climate feedbacks ranging from weakly negative to strongly positive (Reference CessCess and others, 1991). Improed representations of physical processes will be required to narrow this uncertainty.
The Hadley Centre GCM and the Representation of Snow Cover
The model used here, designated HADCM2 and described in detail by Reference JohnsJohns and others (1997), is a coupled ocean-atmosphere version of the Hadley Centre GCM with a resolution of 2.5° latitude by 3.75° longitude, 19 levels in the atmosphere and 20 levels in the ocean.
Net radiation at the land surface is partitioned into sensible, latent, ground and snow melt heat fluxes. Ground heat fluxes and surface temperatures are calculated using a soil model with four layers extending to about 2 m below the surface. Insulation of the ground by a snowpaek, assumed to have a constant density of 250 kg m−3, is represented by reducing the thermal conductivity of the surface layer when there is lying snow; the conductivities of the snowpaek and the surface-soil layer are combined in series, snow being given a conductivity of 0.265 W m−1 K−1.
Model vegetation cover is derived from the Reference Wilson and Henderson-SellersWilson and Henderson-Sellers (1985) land-cover classification. Along with other surface parameters, a snow-free roughness length (z 0V), a snow-free albedo (αV) and a cold deep-snow albedo (αCD) are specified for each vegetation type. Given snow water equivalent (SWE) depth S (mm or, equivalently, kg m−2), surface roughness lengths are linearly interpolated between z 0V and a deep-snow limit of 5 × 10⁻⁴ for snow depths exceeding 2500 z 0V. The surface albedo is taken to be

where the deep-snow albedo αD is set to αCD for cold snow but decreased according to

as a simple representation of aging when surface temperature T, exceeds −2°C.
After the surface temperature reaches 0°C. subsequent net energy input to the snowpack is used to melt snow, and the resulting meltwater is passed to the hydrology routine, which calculates infiltration and run-off. A single unfrozen soil-moisture store is used, but a multi-layer hydrology scheme, that represents freezing and thawing oi the soil, has been developed.
Work is underway to develop improved representations of snow processes and assess their impact on simulated snow cover. Aspects being considered include the spectral albedo of snow, aging, interaction with vegetation canopies, heterogeneity (Reference EsseryEssery, 1997, Reference Esseryin press) and sublimation from blowing snow.
Simulated and Observed Snow Cover
A number of studies (e.g. Reference FosterFoster and others, 1996a) have compared GCM simulations of snow cover with observations. Although global snow-depth climatologies exist, and there are extensive snow records for some regions, ground-based observations of snow cover require measurements at remote locations with hostile environments and are impractical for operational snow monitoring on global scales. Point measurements may also not be representative of areal averages on scales appropriate for validation of GCMs, due to the heterongeneous deposition, redistribution and ablation of snow. Satellite-derived snow observations provide attractive alternatives. Techniques developed to obtain snow cover from sateellite data include subjective analysis of visible satellite images (Reference Dewey and HeimDewey and Heim, 1981) and inference from passive-microwave brightness temperatures (Reference Chang, Foster and HallChang and others, 1987). Microwave instruments have advantages over visible sensors in that they can operate through cloud cover and under darkness at high latitudes, and provide snow depths as well as coverage, but improved algorithms will be required for retrieval of snow depths in forested regions (Reference FosterFoster and others, 1996b) and areas of wci snow (Reference Walker and GoodisonWalker and Goodison, 1993).
GCM results for this study have been taken from two model runs: a 190 year climate-change simulation starting from 1860 with gradually increasing concentrations of CO2> and sulphate aerosols, and a 130 year control run with a fixed pre-industrial CO2 concentration. The inclusion of sulphate aerosols partially offsets the warming due to increased CO2 concentrations and improves the agreement with observed global mean surface temperatures (Reference Mitchell, Johns, Gregory and TettMitchell and others, 1995). Changes in simulated temperatures, precipitation and atmospheric circulation are discussed by Reference Mitchell and JohnsMitchell and Johns (1997).
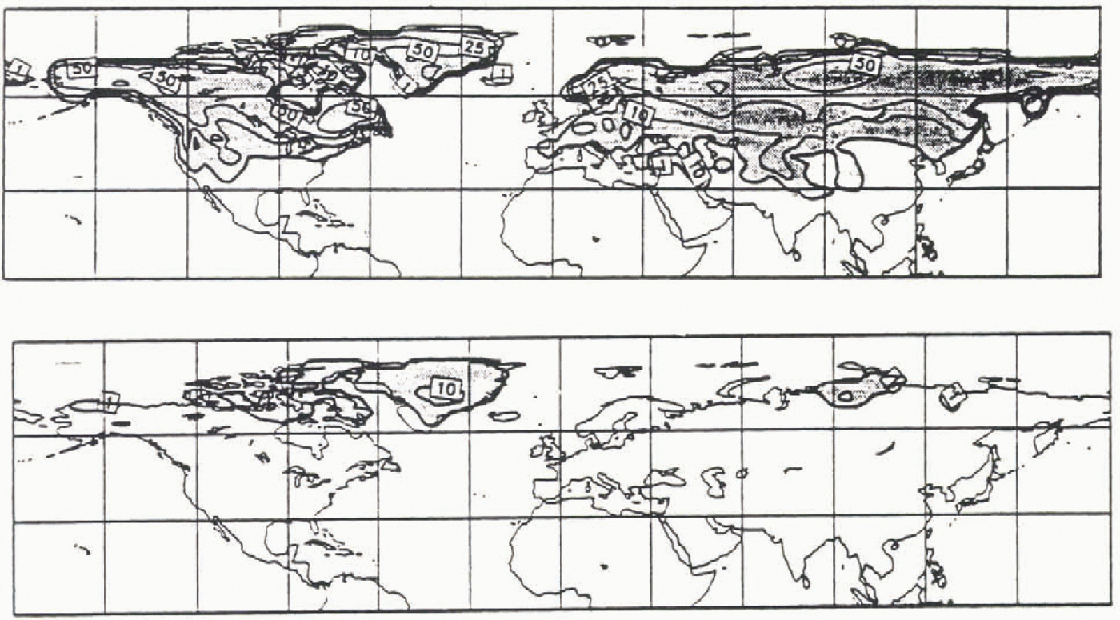
The seasonal range in present-day snow cover predicted by the climate-change simulation is illustrated in Figure 1. which shows average winter (DJF) and summer (JJA) snow depths over the period 1979–88. Areas where the average snow depth exceeds 1cm (2.5 mm SWE, given the model’s fixed snow density) are shaded. For comparison, Figure 2 shows snow depths from a USAF climatology Reference Foster and DsyyFoster and Davy, 1988). Almost 50% of the Northern Hemisphere land surface is covered by snow in winter. The GCM and the climatology have similar snow cover over North America, but the GCM has more snow over China and less over western Europe, In summer, less than 10% of the Northern Hemisphere land surface has snow cover, most of which is confined to the Greenland ice sheet. The GCM retains deep mountain snowpacks through the summer in the Himalayas and the Alaskan Range, but these do not appear in the climatology.
Average winter and summer snow depths for 1979–88 from the Hadley Centre GCM. Contours at 1,10, 25 and 50 cm.
Winter and summer snow depths from the USAF snow-depth climatology, reproduced from Reference Douville, Royer and MahfoufDouville and others (1995). Contours at 1, 10, 25 and 5O cm.
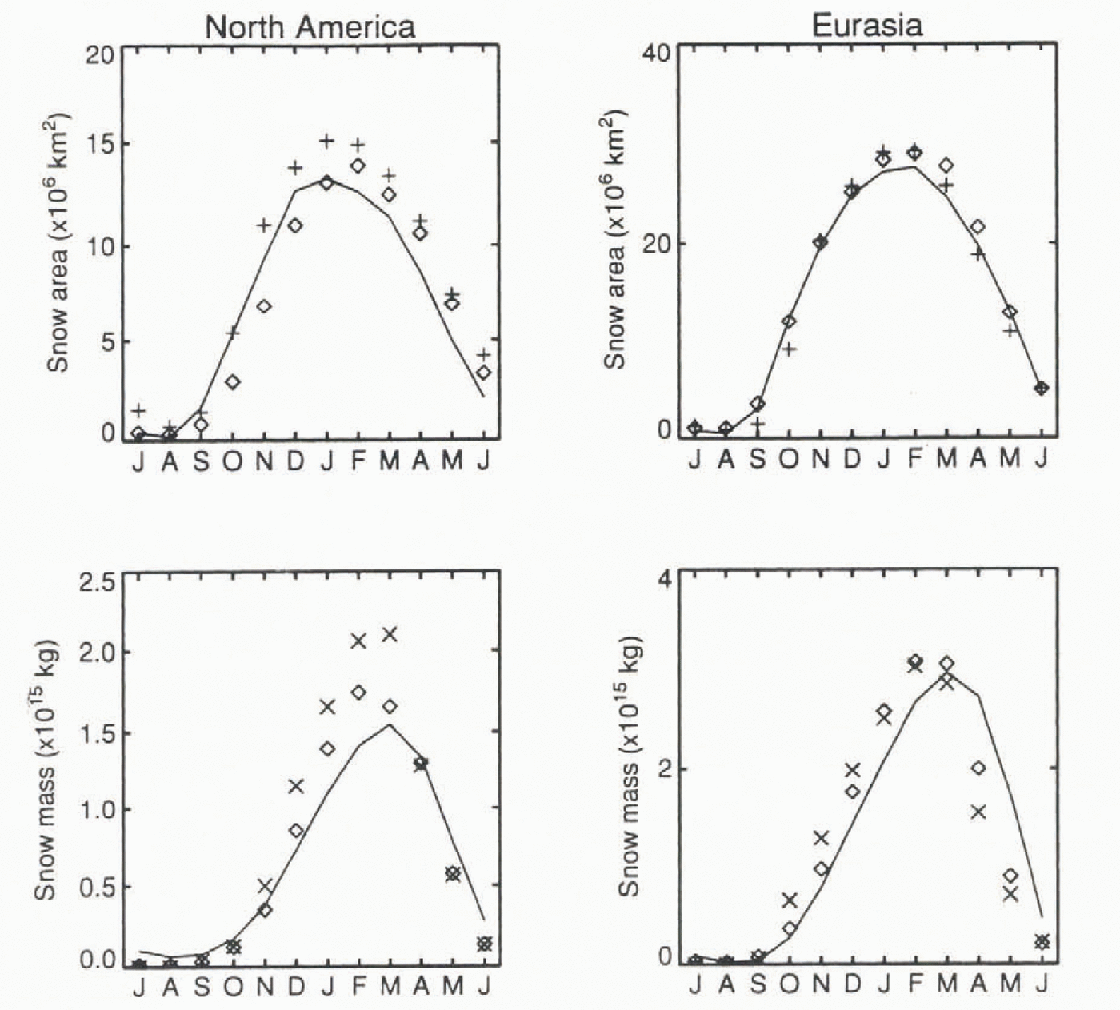
Average monthly continental snow areas and masses for North America and Eurasia from the GCM are shown in Figure 3, along with results obtained from the Nimbus-7 SMMR passive-microwave sensor, NOAA analyses of visible satellite images, and the USAF climatology (the satellite data were supplied by J. Foster of the NASA Goddard Space Flighl Center). Snow areas were obtained from the GCM for each month by adding up the areas of gridboxes where the average snow depth exceeded 1 cm, excluding permanent ice sheets. Despite probable differences in thresholds for detection of snow cover (Reference FosterFoster and others, 1996a), there is reasonable agreement between the different estimates of snow area for both continents. There is a larger spread in the estimates of snow mass, particularly for the winter months in North America and spring in Eurasia, and the GCM snow mass appears to lag the observations slightly. This could, in part, be due to the difficulty of measuring snow masses in forested areas. Inaccuracies in the simulation of temperature, precipitation, surface net radiation and snowpaek processes will all contribute to errors in the simulated snow cover. Variabilities of simulated and SMMR snow cover (not shown) are comparable throughout the year, but the simulated variability of winter snow mass is lower than observed.
Continental snow cover and snow mass from the Hadley Centre GCM(-),
the USAF snow-depth climatology (×), NOAA analyses (+) and SMMR
 .
Foster and others (1996a, b) give more detailed discussions of the snow cover simulated by an atmosphere-only version of the Hadley Centre GCM, and several other GCMs, in comparison with observations. The atmosphere-only GCM, run with prescribed sea-surface temperatures and sea-ice extents, gives slightly greater winter snow cover (about 8% more for each continent in January) than the coupled ocean-atmosphere GCM.
Snow Cover and Climate Change
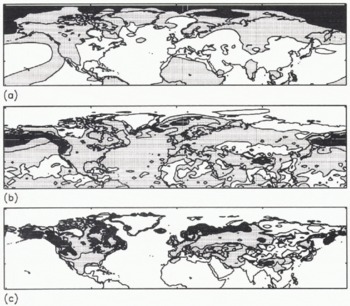
Differences in temperature, snowfall and snow mass between 2030–2050, annual averages from the climate-change simulation and 130 year annual averages from the control are shown in Figure 4. Snow masses are given in kgm−2. The temperature increases over almost all of the Northern Hemisphere, but the warming is greatest at high latitudes. There are large decreases in snowfall over the North Pacific and North Atlantic, and lesser decreases extending over most of North America and Eurasia. Total precipitation, in general, increases in these regions, but a larger fraction of the precipitation falls as rain due to the higher temperatures. Snowfall increases at high latitudes over most of the Arctic Ocean and land in north-central Canada, Greenland and eastern Siberia. Snowfall also increases over a cold, high-elevation inland area in the mid-latitudes of Asia. As a result of changes in temperature and snow fall, the snow mass decreases over most of North America, Europe and Asia west of 90°E, but increases in parts of the Canadian Arctic and eastern Asia. The largest decreases in snow mass are over the northern Rockies, Alaska and Scandinavia — areas with deep winter snow cover.
Differences between 2030–2050 averages from the climate-change simulation and 130-year averages from the control. (a) temperature contours at 0, 2, and 4°C, with shading for increases of more than 2°C and dark shading for increases of more than 4°C. (b) Snowfall contours at 0, ± 4, ±8 kg m−2/month. Regions of reduced snowfall are shaded, with dark shading for reductions of more than 8 kg m−2 per month. (c) Snow-mass contours at 0, ± 1, ± 10 kg m −2. Regains of reduced snow mass are shaded, with dark shading for reductions of more than 10 kg m−2.

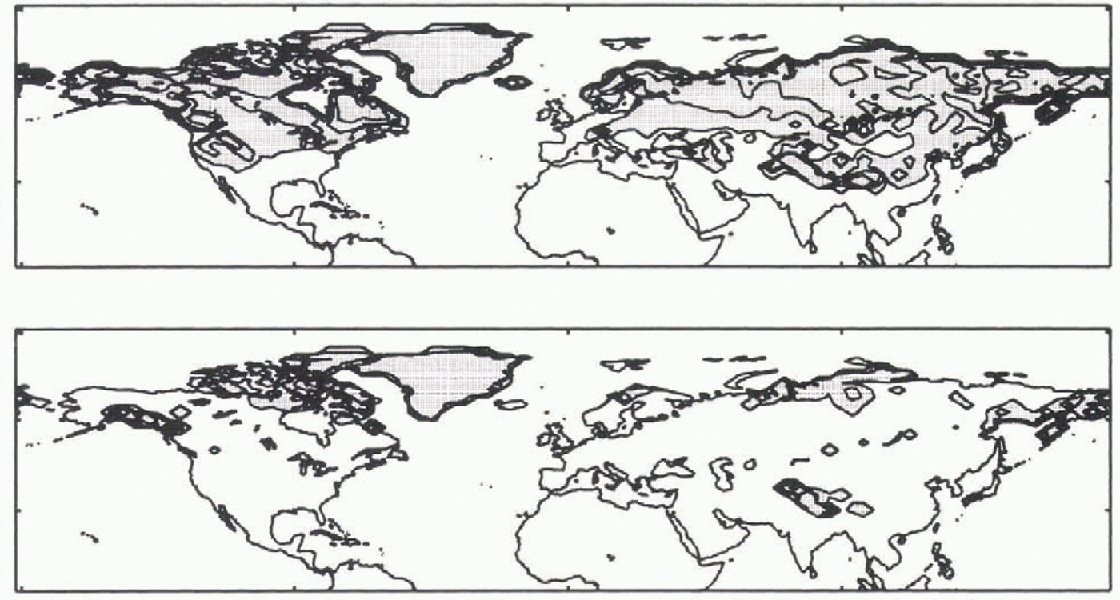
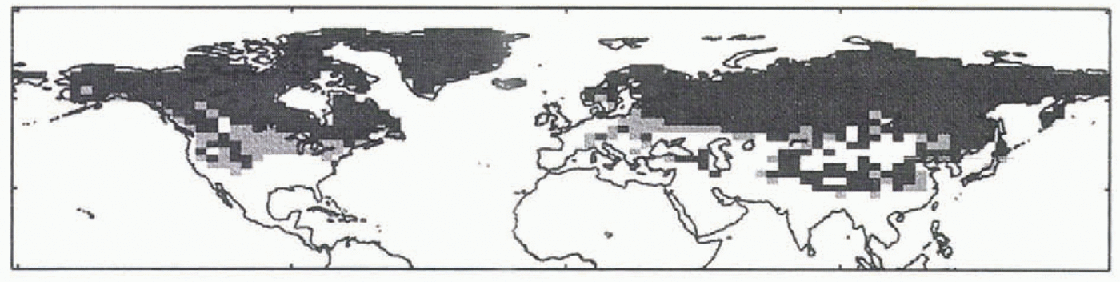
Snow cover increases at a few scattered points in Asia, but retreats in snow cover mostly occur over low-elevation, mid-latitude regions of North Ameriia and Europe. This is shown in Figure 5, where gridboxes with annual average snow depths exceeding 1 cm have dark shading for the climate-change simulation and lighi shading for the control. In the control climate, only 36% of the annual average snow covet is “shallow” (depth between 1 cm and 10 cm) in Asia east of 50° E, compared with 45% in North America and 57% in Europe west of 50°E, making the Asian snow cover less susceptible for climate warming. Moreover, the shallow Asian snow cover largely coincides with the area of increased snowfall shown in Figure 4b.
2030–2050 annual average snow cover from the climate-change simulation (dark shading) and 130 year annual average control snow cover (light shading).
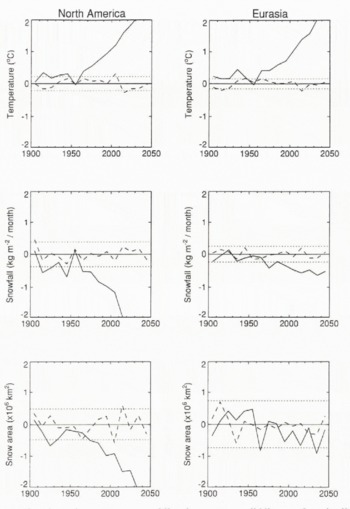
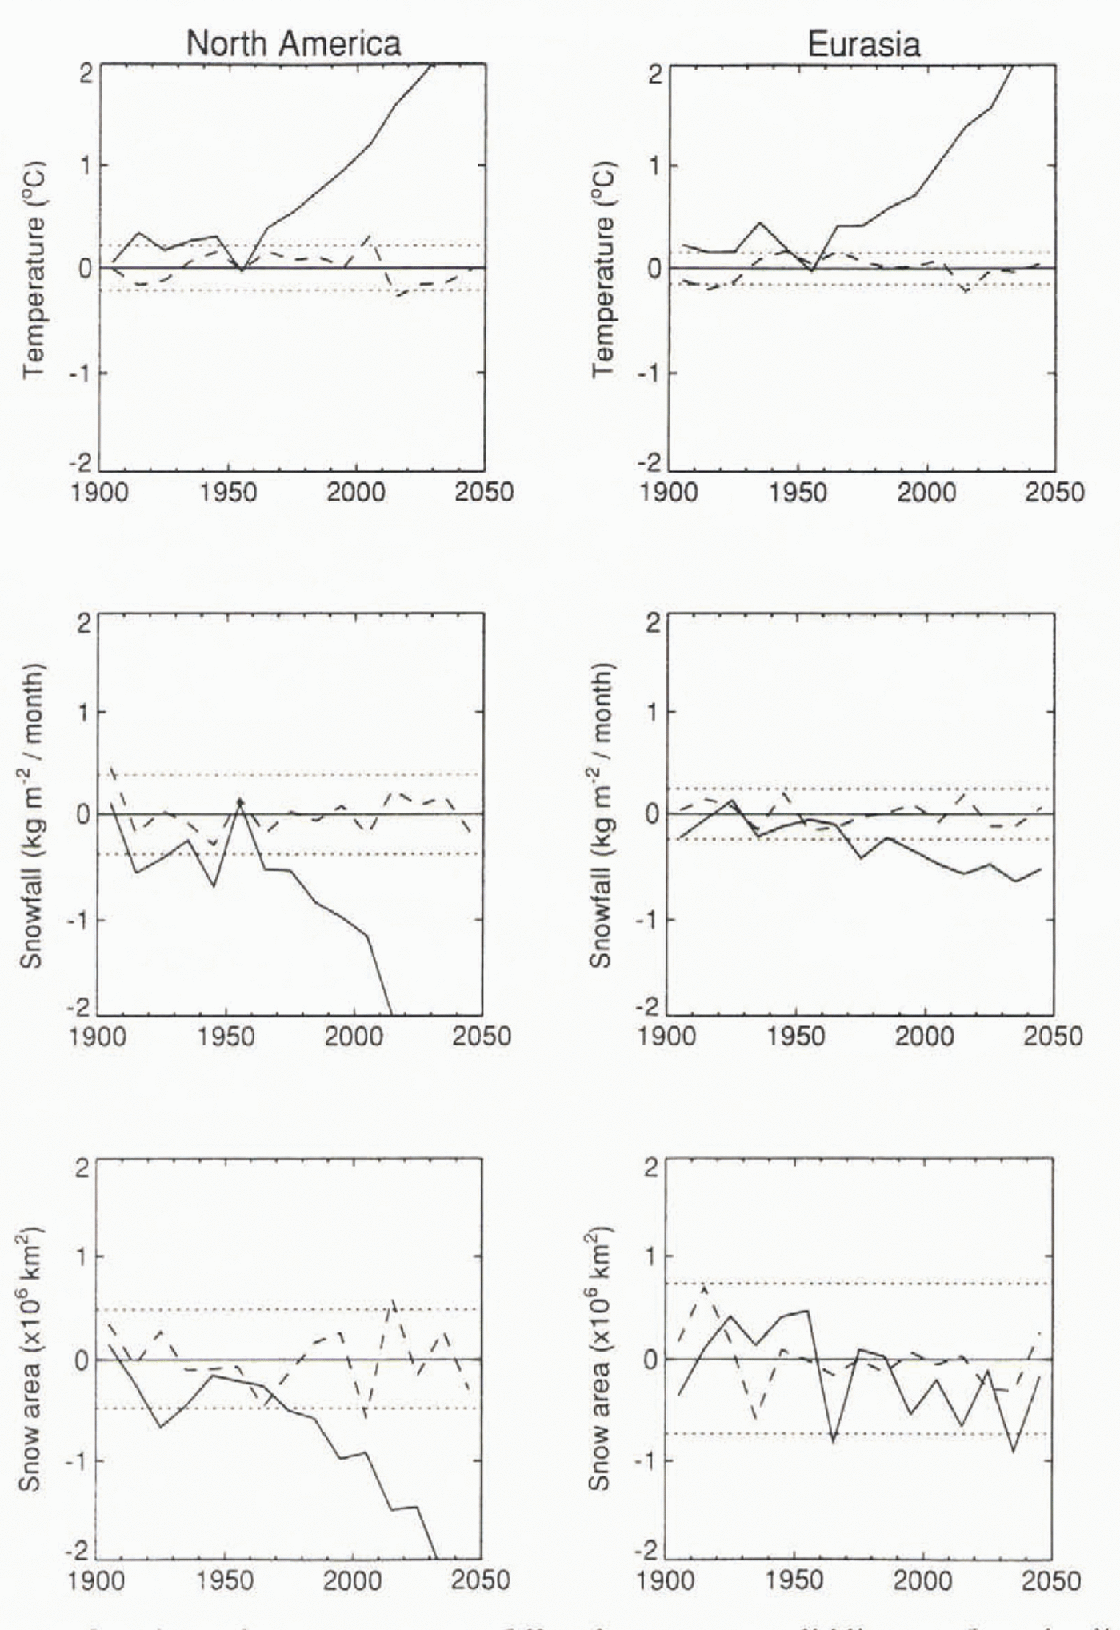
Decadal averages of temperature, snowfall and snow area over land in North America and Eurasia are shown in Figure 6; solid lines are from the climate-change simulation, dashed lines are from the control, and dotted lines show 5% t-test significance levels, calculated using variances of annual averages from the control. The climate-change simulation gives significant increases in temperature and decreases in snowfall for both continents. The reduction in snow cover, however, is much larger over North America than over Eurasia.
Decadal averages of continental temperature, snowfall and snow caver; solid lines are from the climate-change simulation, dashed lines are from the control, and dotted lines are 5% significance levels.
The stuck of Cess and others (1991) used perpetual April simulations with fixed sea-surface temperature to investigate snow-climate feedbacks in atmosphere-only GCMs. Two simulations were required for each GCM: one with fixed snow cover and the other with snow cover allowed to respond to climate change. It is not possible to make a direct comparison with the results presented here.
Conclusions
The Hadley Centre GCM simulates present-day continental snow cover well, and suggests that climate warming will lead lo larger reductions in snow cover over North America and Europe than over Asia. Satellite observations show a general decrease in Northern Hemisphere snow cover over recent years, but the decrease is greater for Eurasia (Reference Robinson and DeweyRobinson and Dewey, 1990). It should also be noted that snow-cover estimates reconstructed from station data suggest a gradual increase in winter snow cover over North America for much of this century (Reference Brown and GoondisonBrown and Goodison, 1996). Further work is required to relate model results to observations and to investigate the role of snow cover in climate-change simulations.
Acknowledgements
Figure 2 has been reproduced from Reference Douville, Royer and MahfoufDouville and others (1995) by kind permission of H. Douville and Springer-Verlag. J. Foster provided the satellite data shown in Figure 3 and the Climate Change Group at the Hadley Centre provided the GCM results. T. Johns, J. Gregory, P. Rown-tree, J. Walsh and an anonymous referee made many useful comments on drafts of this paper. This work was supported by the U.K. Department of the Environment.