Introduction
Over the last decade increasing attention has been paid by policy makers to overcoming age barriers in the labour markets of the industrialised nations. A vast array of policy instruments are being deployed to reverse the trend towards ‘early exit’ observed from the 1970s onwards, in order to address concerns raised by the ageing of populations, for instance social welfare and health costs. However, as noted by Young and Schuller, the ‘whole society is obsessed with age’ (1991: 14) and so it is critical to consider how a person's age affects their experiences of employment. Labour market age barriers have long been a topic of interest to scholars, and interest has grown considerably in recent years alongside changes in public policy (Riach Reference Riach2006). The literature is somewhat equivocal on the role age plays in determining employment outcomes (Adams and Neumark Reference Adams, Neumark and Rogers2006) and while the labour market situation of older people is often described in negative terms, for example, as being about discrimination or premature labour market withdrawal, this does not accurately reflect the realities of the lived lives of many such workers. Nevertheless, numerous studies point to the existence of age discrimination in labour markets, whereby systematic stereotyping and discrimination against people on age grounds (Butler Reference Butler and Maddox1987) are expressed by employers seemingly reluctant to recruit, train or retain older workers. Their somewhat disadvantaged status means that older workers have been disproportionately vulnerable to job loss and are over-represented among the long-term unemployed (see e.g. Encel Reference Encel and Taylor2008). On the other hand, employment rates among older workers have, after a long-term decline, been on the increase among the developed economies (Taylor Reference Taylor2008), suggesting that important changes may be afoot. However, a weakening economic situation has resulted in declining interest in their recruitment and retention (Henkens and Schippers Reference Henkens, Schippers and Taylor2008).
As a result of the evident policy imperatives, a new policy consensus is emerging around the benefits of ‘activating’ labour market policies and prolonging working lives, with proponents stressing the need for the removal of labour market age barriers if this is to be achieved (Frerichs and Taylor Reference Frerichs, Taylor, Walker and Naegele2009). The term ‘active ageing’ has largely replaced ‘early retirement’ in the policy vernacular (Prager and Schoof Reference Prager and Schoof2006) and bodies such as the World Health Organization (WHO 2002) and the European Commission (Employment and Social Affairs, European Commission 1999) have been busy promoting the concept. A policy framework for active ageing has been set out by the WHO. Active refers to: ‘continuing participation in social, economic, cultural, spiritual and civic affairs, not just the ability to be physically active or to participate in the labour force. Active ageing aims to extend healthy life expectancy and quality of life for all people as they age, including those who are frail, disabled and in need of care’ (WHO 2002: 12). According to Naegele (Reference Naegele1999) such an approach includes tackling age discrimination in the labour market, adapting learning approaches to the circumstances of older people and the adaptation and improvement of working conditions. The European Commission states that ‘Successful active ageing policies involve all generations. All actors (government, firms and workers) need to adopt lifecycle strategies enabling workers of all ages to stay longer in employment’ (Employment and Social Affairs, European Commission 1999: 5). Thus, it is notable that current conceptions of the relationship between age and the labour market appear to have implicitly rejected previous ones based on notions of systematic discrimination against people deemed too old in favour of a somewhat looser and more inclusive definition whereby ageist behaviours can be seen to affect people of all ages (Duncan Reference Duncan, Glover and Branine2001). While this is increasingly recognised, studies which examine the relationship between workplace experiences of discrimination and facets of wellbeing at different points in the lifecycle have been few, and it is this gap in knowledge that this study sought to help fill.
Experiences of labour markets according to age and gender
Interestingly, in considering experiences of labour market age discrimination, it is notable that often, surveys of older workers appear to indicate that this is a problem that a relatively small minority face. For example, one Finnish study found that among the 55–64 age group, 8 per cent had experienced age discrimination. This was manifested in terms of limited career and training opportunities and negative attitudes (European Industrial Relations Observatory 2000). Similarly, analysis of the British Family and Working Lives Survey again uncovered evidence that age discrimination was not experienced by many, just over 7 per cent of men and women in the 50–54 age group stated that age was a factor in their failure to find a job, this figure falling for people who were older (McKay Reference McKay1998). Workplace age discrimination sometimes appears to be experienced less frequently than discrimination in terms of finding a job. A further British study found that age discrimination was experienced by a minority of employees, albeit a larger minority than in the earlier research. Among older people aged between 50 and 69 surveyed, around one in four believed they had experienced age discrimination. This was most frequently experienced with regard to finding a new job and obtaining a job interview. Age discrimination in terms of promotion, training and development, and early retirement was less frequently mentioned. However, further questioning found that the majority of older employees surveyed felt that employers discriminated against older people in at least one aspect of employment, perhaps suggesting that the concept of age discrimination has little saliency among older employees (Goldstone and Jones Reference Goldstone and Jones2001).
Importantly, researchers have also begun to explore individual differences in experiences of age discrimination. For instance, an employee survey carried out among organisations located in the United Kingdom (Austin Knight Reference Austin1996: 12) found that the majority of respondents described where they worked as an ‘ageism’ free environment, with a fifth (21.5%) responding that this was not the case. Those aged over 30 were slightly more likely to report that this was not the case. Just over a quarter of respondents stated that they had experienced age discrimination during their career and just over half said that this was because they were thought to be too young. Experiences of age discrimination were most likely to occur at the ages of 21 and 40 in the case of women and 18 and 50 in the case of men. Gender differences were also observed in a study of the British public sector carried out by Itzin and Phillipson (Reference Itzin and Phillipson1993) who quote, for example, one personnel director as saying that ‘women get where they are going by the age of 35’. ‘Gendered ageism’ was a term coined by Ginn and Arber (Reference Ginn, Arber, Arber and Ginn1995) to describe the phenomenon of age and gender combining to influence labour market prospects, but unfortunately while seemingly opening up numerous potential paths for enquiry, as a phenomenon it has ‘received disproportionately little attention in the literature’ (Encel Reference Encel1999: 76). Duncan and Lorreto (Reference Duncan and Lorreto2004), in a notable study, found that age-related discrimination most often affected the youngest and oldest in their sample of financial services staff, but with negative attitudes more often experienced by women and their accounts of ageism often containing a sexualised element. Although recent qualitative research among women does seem to add further weight to the argument that these variables do interact to affect employment experiences and wellbeing (Walker et al. Reference Walker, Grant, Meadows and Cook2007), while echoing the earlier findings of Goldstone and Jones (Reference Goldstone and Jones2001), another qualitative study found that the causes of discrimination against older women, manifested for instance in the form of inaccessibility of training and a lack of challenging work, were in fact rather difficult to isolate, possibly reflecting unfamiliarity with age discrimination as a concept (Moore Reference Moore2007). A quantitative element to this study found that women were somewhat more likely than men to report experiences of age discrimination (16% versus 11%) and notably, workers under the age of 30 were three times as likely to report having experienced age discrimination than those aged over 50 (29% versus 11%). Research which specifically considered age discrimination experienced by younger people found that, while it was difficult to isolate this from other forms of discrimination, it was experienced in terms of persistent teasing and bullying, being passed over for recruitment and promotion, being denied access to training, being given menial work tasks and patronising comments from managers and co-workers. The researchers coined the term ‘petty ageism’ to refer to ‘patronising remarks, observations and jokes made at the younger person's expense’ and which could be ‘repetitive, then irritating, offensive and upsetting’ (Andrew Irving Associates 2001: 26).
The individual consequences of discrimination have been studied extensively, but with mixed evidence concerning its consequences for physical and psychological wellbeing (see Goldman et al. Reference Goldman, Gutek, Stein and Lewis2006 for a recent review). In the aforementioned Austin Knight study, among those experiencing age discrimination this experience frequently resulted in them leaving their job. This finding is confirmed by research from the United States of America which found that workers who reported no age discrimination from their employer stayed with the company for 1.5 years longer than those reporting such an experience (Neumark and Johnson Reference Neumark and Johnson1997).
It has been argued that measurement problems might partly explain an inconsistency of findings in the discrimination literature. While recent studies of age discrimination have commonly asked respondents a direct question about their experience of this, the wider discrimination literature provides useful guidance on how a different, less direct, approach to measurement might elicit a nuanced and, potentially, more accurate picture of its extent and form in workplaces and more insights into its role in influencing wellbeing. In this regard Deitch et al. point to the need go beyond ‘overt expressions of prejudice’ to consider ‘more subtle discriminatory behaviours … such as avoidance … “closed” and unfriendly verbal and nonverbal communication, or failure to provide assistance’ (2003: 1301) as, they argue in this instance, ‘racism is not disappearing, but rather is being replaced by less overt forms’ (2003: 1301). Deitch et al. argue for the need to focus on ‘everyday discrimination’, which they argue may more accurately measure its actual form and extent in the workplace, noting evidence, for instance, that events that may not be classified by those experiencing them as instances of ‘sexual harassment’ may nevertheless have deleterious consequences for psychological wellbeing. In their study they found evidence for the adverse consequences of relatively minor discriminatory incidents for job satisfaction. If, as suggested earlier, age discrimination may not be recognised by those experiencing it, then a subtler approach to measurement may be warranted.
The present article is based on analysis of quantitative data collected from employees in four Australian workplaces who were asked a range of questions concerning their employment experiences, about their job satisfaction and about their psychological wellbeing. The data analysis reported here considered the effects of ‘everyday’ workplace harassment and discrimination on job satisfaction and psychological wellbeing and whether this relationship was moderated by other factors, building on previous studies which have considered the relationship between age and wellbeing in organisational settings (e.g. Warr Reference Warr1992). The study also explored age, gender and socio-economic position differences and potential interactions of these factors in determining experiences of discrimination in order to help refine workplace interventions. Following Deitch et al., we sought to measure workplace discrimination in a more indirect fashion. Based on a review of the literature on age and work, we chose to examine participation in training, management support, respect and consultation, the opportunity to participate in meaningful work and job insecurity as areas of discrimination, as well as a measure of everyday discrimination used by Deitch et al.. As with this earlier study, we considered how aspects of discrimination would affect context-free and specifically workplace aspects of psychological wellbeing. Evidence from Australia points to a similar pattern of relationships between age and the labour market as evidenced elsewhere in the industrialised world (Encel Reference Encel1999) and so the findings of this study have relevance for other countries.
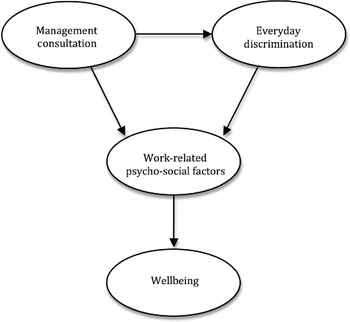
We began our assessment of the role of everyday discrimination in workplaces with a general model of its effect on psychological wellbeing. As the experience of such discrimination may be more accurately measured indirectly, the model initially describes the effect of discrimination via the psycho-social factors enumerated above and mitigating factors on the effect of discrimination in terms of management consultation. Thus a general model as presented in Figure 1 was used.
Initial general model of everyday discrimination.

Methodology
The employee survey was carried out in two phases during mid-2007 and mid-2008 in a small Australian university, two international freight terminals of a large international airline, a national manufacturing company and the roadside assistance division of a motoring organisation. Employees were invited to complete an online or paper version of the survey instrument in two case organisations, whereas only paper versions were available in the others. Strenuous efforts were made to encourage employees to respond in each case organisation. For instance, in one company, an email was sent from the National Human Resources Manager to other managers with an attached letter introducing the study, the URL and instructions on how to complete the questionnaire. A question and answer document was circulated and meetings were held to explain the questionnaire to staff. Posters encouraging participation were also placed at different locations. Although response rates varied across the case organisations, the survey had an approximate response rate of 40 per cent overall. Individually, the organisational response rates were: manufacturing firm 42 per cent (855 of 2,000 employees), small national university 47 per cent (618 of 1,300 employees), motoring organisation 49 per cent (59 of 119 employees) and the international freight company 20 per cent (76 of 380 employees). Questionnaires lacked identification by name or employee number to ensure anonymity. Details of a contact person in the research team and in the case organisations were included online for support and advice as internet connection problems arose during the completion of some questionnaires.
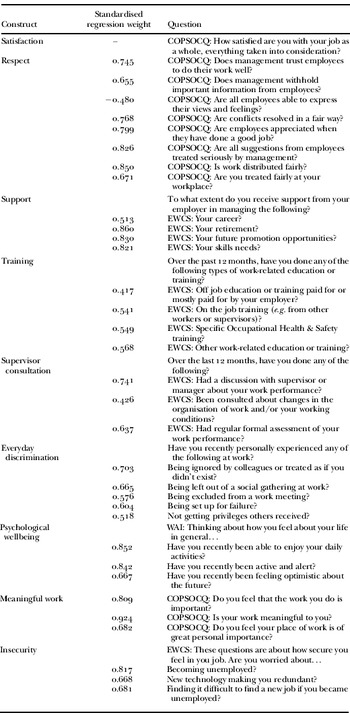
The survey instrument comprised 61 questions, including the Finnish Work Ability Index (WAI; Ilmarinen Reference Ilmarinen2007) and additional questions about attitudes to and experiences of work, most adapted from the European Working Conditions Survey and the Copenhagen Psycho-social Questionnaire (COPSOQ). The individual items used to operationalise the constructs, their individual contribution to each construct and their source are enumerated in Appendix 1.
Data analysis commenced with exploratory structural equation modelling, which can be considered as a combination of factor analysis and path analysis. As with factor analysis, the relationship between observed indicators (usually items) and underlying theoretical constructs are modelled. This is extended in structural equation modelling with path analysis that, in this case, models the relationship between underlying theoretical constructs. This was followed by multivariate analysis of variance in order to act as a guide to analysis of age, gender and socio-economic position effects. Next, we assessed the varying importance of the constructs in the prediction of psychological wellbeing and job satisfaction, according to age and gender using measurement invariance techniques.
Results
We undertook initial exploratory factor analysis in order to assess the composition of scales employed to measure the various constructs. Prior to this analysis, observations with missing items were deleted. Approximately 5 per cent of cases were deleted, leaving responses from 1,596 participants. In some cases items were removed in order to ensure that the various required goodness-of-fit criteria (Byrne Reference Byrne2001) were achieved. The resulting constructs were then assessed for discriminant validity by checking that imputed correlations were largest for those constructs to which items had been assigned. Exploratory factor analysis suggested the eight constructs listed below. The scale scores established from these factor analyses were established with a summative method, with larger scores reflecting a greater magnitude of the construct. The response options of the items used in the construction of this model are also presented. It is noteworthy that items were recoded to have a total possible range of one to five to establish the equal contribution of each item to the structural model.
1. Respect (1=always, 5=hardly ever/never).
2. Support (1=to a very large extent, 5=not at all).
3. Training (1=yes, 2=no).
4. Consultation with supervisor (1=yes, 2=no).
5. Everyday discrimination (1=yes, 2=not sure, 3=no).
6. Psychological wellbeing (1=most of the time, 5=never).
7. Job insecurity (1=to a very large extent, 5=not at all).
8. Personally meaningful work (1=to a very large extent, 5=not at all).
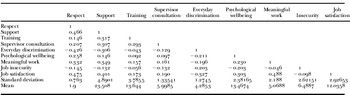
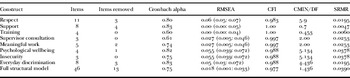
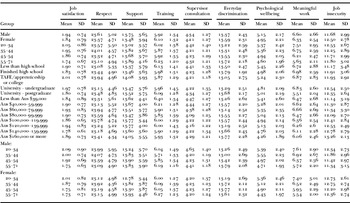
Only one item measured job satisfaction, using a five-point Likert scale. For the reader interested in replicating the present analysis, the correlations, means and standard deviations (SD) for these constructs once adequate fit was achieved are presented in Table 1. For the details of the achieved fit for these constructs and a brief discussion of the measures of fit used in structural equation modelling, see Table 2 and additional notation.Footnote 1 Also the means and standard deviations for each group of respondents discussed in this analysis are presented later.Footnote 2
Correlations, means and standard deviations for constructs used in structural model

Reliability and goodness of fit of measures

Notes: RMSEA: root mean square error of approximation. CFI: comparative fit index. CMIN/DF: normed χ2. SRMR: standardised root mean square residual.
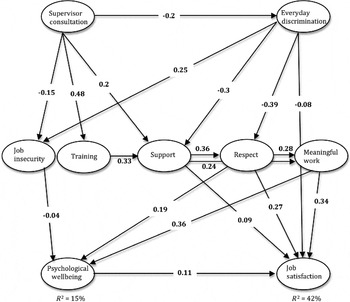
In the process of establishing the structural model, additional links were added when this was suggested by the modification indices and the link between ‘everyday discrimination’ and ‘meaningful work’ was removed when this was found to be non-significant. Modification indices are the primary statistical tool used for improving the ability of a structural model to describe data, through quantifying the possible improvement in fit achieved via model changes. When these indices are used, it is necessary to both verify these statistically based changes to the model through validation with an independent sample and to consider theoretical implications for model changes. As our study is exploratory, replication will be required to confirm the validity of these changes. Adequate fit was achieved with the final model as shown in Table 2. This is presented in Figure 2 with the standardised weights at the centre of each link. Although the items have been removed from this figure to improve readability, the final model was fitted using items – that is, this analysis did not employ item parcelling. As indicated in the figure, this model explained 42 per cent of the variation in the job satisfaction response and 15 per cent of the variation in the psychological wellbeing response. Job satisfaction in this case was measured using the item ‘How satisfied are you with your job as a whole, everything taken into consideration?’. Also, psychological wellbeing was measured using three items ‘Have you recently been able to enjoy your daily activities?’, ‘Have you recently been active and alert?’ and ‘Have you recently been feeling optimistic about the future?’.
Full structural model for the effect of everyday discrimination on psychological wellbeing and job satisfaction.

The model attempts to capture the psycho-social factors that interplay with everyday discrimination. The influence of these factors was assessed in terms of their relationship with reported job satisfaction and psychological wellbeing. The strength of the present model and structural equation modelling as a general technique is the ability to map a system of interrelated factors and the way in which these factors affect each other. If the direct relationship between everyday discrimination and job satisfaction and psychological wellbeing are considered, only a weak relationship with job satisfaction described the present data effectively. When the other variables in the equation were controlled for, the model indicated that with a unit increase in everyday discrimination, job satisfaction would be expected to fall by 0.08 units. Of greater interest and influence were the numerous indirect effects of everyday discrimination. When the indirect effects were considered, it was observed that everyday discrimination influenced job satisfaction via the effects of the respect and support factors. Also, respect and support affected job satisfaction via their individual effects on the meaningful work factor. Concurrently, meaningful work, job insecurity and respect influenced job satisfaction via the effect of psychological wellbeing. A similar set of pathways were itemised in the process of assessing the influence of everyday discriminations on psychological wellbeing. As is self-evident, in reality there is a complex interplay between such psychological factors. The present model that attempts to model a fraction of the possible relationships is capturing only some of this complexity. To facilitate interpretation, the discussion that follows primarily reports standardised total effects for the constructs of interest.
Comparison of age groups
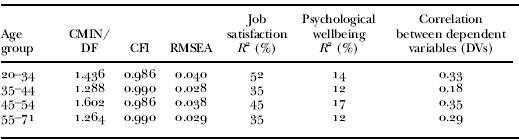
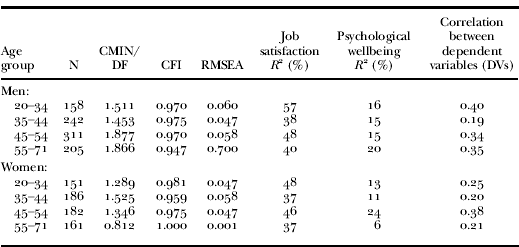
The model fitted the data well even when these were split according to age group. The R 2 values, which measure the amount of variance in the dependent variables that was explained by the model, indicated that it performed best for the youngest and 45–54 age groups (R 2=0.33). The correlation between the two dependent variables, job satisfaction and psychological wellbeing, was particularly low for people aged between 35 and 44 (R=0.18). Table 3 presents the fit indices for the model with the dataset split by age group. It is noteworthy that the spread of ages across the four groups were somewhat heterogeneous. Particularly, the youngest and oldest age groups were spread over a greater age range than the other groups. This is primarily due to low frequencies at the extremes of the age distribution. At the top of the age range, it was evident that there were employees in highly skilled employment at the university that participated in the study.
Goodness of fit for full structural model between age groups
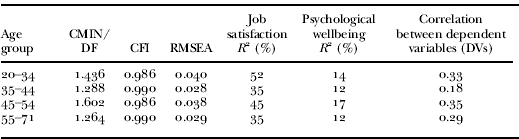
Notes: CMIN/DF: normed χ2. CFI: comparative fit index. DVs = Psychological wellbeing and Job satisfaction. RMSEA: root mean square error of approximation.
Multivariate analysis of variance was applied to the constructs of interest in order to determine whether significant mean differences existed between age groups. Numerous significant differences were detected and it was evident that the constructs: support (F(3, 1,581)=3.1, p=0.02), training (F(3, 1,581)=4.1, p=0.007), psychological wellbeing (F(3, 1,581)=9.5, p<0.001), meaningful work (F(3, 1,581)=29.1, p<0.001) and insecurity (F(3, 1,581)=4.6, p=0.003) had significantly different means across the age groups. From reviewing the age group-specific means and standard deviations for these constructs, it was observed that the youngest age group had the lowest mean reported support score (mean=13.1, SD=3.5). Concurrently, the oldest group appeared to have the largest and most distinct training scale mean score (mean=6.23, SD=1.2). In terms of psychological wellbeing, the two younger age groups demonstrated comparable mean scale scores whereas the two older groups reported lower mean scale scores. For both the meaningful work (mean=7.51, SD=2.9) and insecurity (mean=12.53, SD=2.6) constructs the youngest age group recorded the highest mean score. It is noteworthy that the differences in means across all constructs were less than one standard deviation. Also, the partial eta2, analogous to the R 2 statistics, reflects the variance in the constructs explained by the effect of age. The largest amount of explained variance at approximately 6 per cent was for the meaningful work construct.
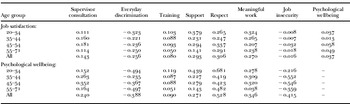
An invariance test showed that different age groups required different weights in the above model (χ2=293.1, df=135, p<0.001), and as a result the standardised total effect sizes differed markedly for the four age groups. Standardised total effects sizes are determined by summing the direct and indirect effect sizes of one variable on another and are interpreted as path coefficients. Hence, a single standard deviation increase in one variable corresponds to the increase or decrease in the value of the total effect in the target variable. Indirect effects are estimated statistically as a product of the direct effect that comprises them (Kline Reference Kline1998). Everyday discrimination demonstrated the strongest relationship with job satisfaction for the youngest and the oldest age groups, with total effects sizes of −0.323 and −0.256, respectively. These effect sizes were negative as increased everyday discrimination related to lower job satisfaction. It is also notable this variable was the third most important predictor of job satisfaction in the case of people aged 35 or under, behind support (0.379) and meaningful work (0.324), and for those aged 45 or over, behind respect (0.309) and support (0.293). However, for the 35–54 age group it was the fourth most important predictor of satisfaction. Other interesting differences between the age groups related to the relative importance of meaningful work and support for the youngest age group. Meaningful work appeared to decline in importance as people reached prime working age, falling from 0.324 for the youngest group to 0.207 for respondents aged 45–54, and then increased towards retirement. Respect became more important, relative to support, increasing from 0.265 to 0.337 for the 45–54 age group. Meanwhile, participation in training appeared to be a weak indicator of job satisfaction among the oldest age group (0.08), demonstrating the strongest relationship for the youngest (0.103). Altogether, these findings appear to demonstrate that there are age-related differences in the effects of psycho-social factors, for example everyday discrimination, respect and meaningful work, and career progression factors such as training and support on job satisfaction. Considered overall, it appears that the effect of workplace psycho-social factors is greatest on the job satisfaction of the youngest age group. They are followed by those in the oldest age category. Results of this analysis are presented in Table 4.
Standardised total effect sizes for job satisfaction and psychological wellbeing

Turning to psychological wellbeing, age differences were again observed. The most important predictor among the youngest age group was respect, with a total effect of 0.681, and for the oldest, everyday discrimination (−0.497). By contrast, among those aged 35–44 and 45–54 job insecurity was the most important factor (−0.552 and −0.546). As was the case with job satisfaction, everyday discrimination had the greatest influence on the youngest and oldest age groups and overall. It was also the youngest age group among whom these various factors had the greatest influence on psychological wellbeing, with the 45–54 age group following. Notably, the provision of training and meaningful work appeared to be of relatively little importance in determining psychological wellbeing among the oldest age group, with effect sizes of 0.051 and 0.038, respectively. However, the relatively low R 2 (variance explained by the model) suggests that there were many variables outside of this study that were affecting psychological wellbeing. An alternative explanation is the quality of the measure which, due to space constraints in the survey instrument was perfunctory by current standards. Results of this analysis are presented in Table 4.
Gender comparisons
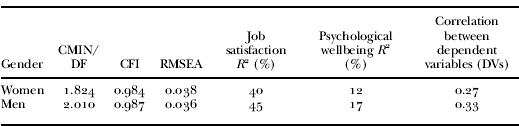
The proposed model fitted the data well even when these were divided according to gender. The R 2 values, or explained variance, indicated that the model performed best for men (R 2=0.33). The correlation between the two dependent variables, satisfaction and psychological wellbeing, was comparable for the two groups. Table 5 presents the fit indices for the model when the dataset was split according to gender.
Goodness of fit for full structural model between genders
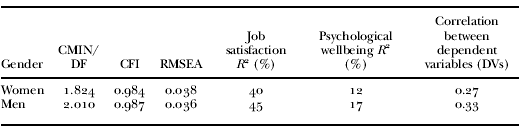
Notes: CMIN/DF: normed χ2. CFI: comparative fit index. DVs=Psychological wellbeing and Job satisfaction. RMSEA: root mean square error of approximation.
Multivariate analysis of variance was applied to the constructs of interest in order to determine whether significant mean differences existed between genders. Statistically significant differences were evident in the case of the constructs: training (F(1, 1,581)=4.4, p=0.04), supervisor consultation (F(1, 1,581)=4.6, p=0.03), meaningful work (F(1, 1,581)=4.7, p=0.03) and insecurity (F(1, 1,581)=22.9, p<0.0001). Each construct, with the exception of insecurity, demonstrated small mean differences. Males in the present sample had higher mean scale scores for supervisor consultation (mean=4.34, SD=1.2) and meaningful work (mean=6.6, SD=2.6). Females had higher mean scores for training (mean=6.1, SD=1.3) and insecurity (mean=12.5, SD=2.7). Interestingly, the largest mean difference, in the insecurity construct, was approximately one-third of a standard deviation. Also, this relationship did not explain a large amount of variance in the construct, where a significant effect was found as demonstrated by the partial eta2 statistic that ranged from 0.02 to 0.003.
An invariance test demonstrated that different genders required different weights in the above model (χ2=88.01, df=45, p<0.001), and as a consequence the standardised total (direct + indirect) effect sizes differed markedly for men and women. Everyday discrimination (−0.313) was the third most important construct for predicting job satisfaction in the case of women, behind respect (0.335) and meaningful work (0.385). However, among men, everyday discrimination (−0.368) was the second most important predictor of job satisfaction. Other interesting differences between the genders related to the relative importance of respect and support, which were markedly more important for men's reported job satisfaction, with effect sizes of 0.423 and 0.361, respectively. Meaningfulness of work (0.385) and training (0.135) were more important for women in predicting satisfaction. Notably job insecurity had a small, equal and negative impact on both genders' reported job satisfaction. Results of this analysis are presented in Table 6.
Standardised total effect sizes for job satisfaction and psychological wellbeing

In the case of psychological wellbeing, the most important predictor was respect for both genders (males=0.245, females=0.215). However, it was slightly more effectual for men. Of interest again was that everyday discrimination was more important in predicting psychological wellbeing among men than it was among women (−0.194 and −0.169). The most notable difference here was the reversal in the importance of the meaningfulness of work. In the prediction of psychological wellbeing, meaningfulness of work was more important for men (0.385) than for women (0.325). Interestingly, insecurity had a practically equal influence, as was observed in the prediction of job satisfaction. However, the relatively low R 2 suggests that there were many variables outside this study that affected psychological wellbeing. Results of this analysis are presented in Table 6.
Socio-economic position
The analysis also considered the moderating role of socio-economic position. There are good reasons for so doing as it has been identified as important in determining the labour market experiences of older workers (Cliff Reference Cliff1989; Laczko et al. Reference Laczko, Dale, Arber and Gilbert1988; McGoldrick and Cooper Reference McGoldrick and Cooper1980; Walker Reference Walker1985), although the group-specific sample sizes did not allow the application of the structural model to gender and age groups within levels of socio-economic position.
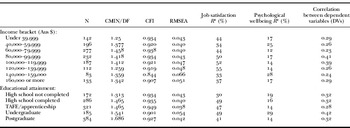
The model fitted the data well even when these were split according to educational attainment and household income. The R 2 values, which measure the amount of variance in the dependent variables that is explained by the model, indicated that the model performed best for respondents with an undergraduate education level and also those with a household income between 120,000 and 139,999 dollars per annum (R 2=39 per cent and 35 per cent respectively). The correlation between the two dependent variables, job satisfaction and psychological wellbeing, was particularly high for people with an undergraduate level of education and also those with a household income between Aus $80,000 and $119,999 per annum (R=0.41). Table 7 presents the fit indices for the model when the dataset is split by educational attainment and household income.
Goodness of fit for full structural model between household income and educational attainment

Notes: CMIN/DF: normed χ2. CFI: comparative fit index. DVs=Psychological wellbeing and Job satisfaction. RMSEA: root mean square error of approximation. TAFE: Technical and Further Education.
Multivariate analysis of variance was applied to the constructs of interest in order to determine whether significant mean differences existed between respondents with different household incomes and levels of educational attainment. It is notable that when multivariate analysis of variance was applied to investigate the interaction effect of gender, age and socio-economic position, no significant three-way interactions were present in the mean scale scores. A statistically significant difference was detected in the mean everyday discrimination scale score across age and household income level. As this interaction effect only accounted for 2 per cent of the variation in everyday discrimination scale score it is considered to be of little practical importance. Numerous significant differences were detected for main effects of household income and educational attainment in the constructs. Regarding educational attainment, significant differences were observed for the constructs: everyday discrimination (F(4, 1581)=4.1, p=0.001), psychological wellbeing (F(4, 1581)=2.2, p=0.04), meaningful work (F(5, 1581)=14.1, p<0.001), job insecurity (F(4, 1581)=2.9, p=0.01) and job satisfaction (F(4, 1581)=3.7, p=0.002). In terms of household income, significant mean differences were detected for the constructs: training (F(7, 1581)=2.4, p<0.01), psychological wellbeing (F(7, 1581)=3.4, p=0.001) and job insecurity (F(7, 1581)=7.7, p<0.001). From reviewing the group-specific means and standard deviations for these constructs it was observed that respondents with a high school level of educational attainment had the highest mean reported rates of everyday discrimination (mean=13.8, SD=1.9). Concurrently, respondents that had not finished high school appeared to have the largest psychological wellbeing scale mean score (mean=5.45, SD=2.2). For the meaningful work construct, respondents with a high school level of educational attainment had the largest mean scale score (mean=6.9, SD=2.5). Respondents with an undergraduate level of educational attainment reported the largest mean scale score for the insecurity construct (mean=12.35, SD=2.6). For the job satisfaction item, respondents with an intermediate or apprenticeship qualification had the largest mean score. In terms of household income, respondents reporting a sum of less than Aus $39,999 per annum reported the largest mean training scale score (mean=6.4, SD=1.3). Respondents reporting an annual household income of less than Aus $39,999 also appeared to have the highest psychological wellbeing scale mean score (mean=5.4, SD=2.6). Respondents with the highest reported annual income reported the largest mean scale score for the job insecurity construct (mean=13.26, SD=2.1). It is noteworthy that the differences in means across all constructs were less than one standard deviation. Also, the partial eta2, analogous to the R 2 statistics, reflects the variance in the constructs explained by the effect of educational attainment and household income. The largest amount of explained variance at approximately 6 per cent was for the everyday discrimination construct.
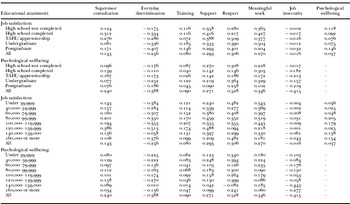
An invariance test showed that respondents with different levels of education required different weights in the above model (χ2=202.9, df=76, p<0.001), and as a result the standardised total (direct + indirect) effect sizes differed markedly for the five groups with different levels of education. Everyday discrimination demonstrated the strongest relationship with job satisfaction for respondents with a postgraduate level of education, with a total effect size of −0.407. This effect size was negative, as increased everyday discrimination related to lower job satisfaction. It was also notable this variable was the most important predictor of job satisfaction for this group of respondents. However, for respondents that had not finished high school, had finished high school or had an intermediate or apprenticeship qualification, respect and meaningful work were the most important predictors of job satisfaction. The support construct demonstrated a pattern of decreasing importance for job satisfaction as level of education increased. Considered overall, it appears that the effect of everyday discrimination is greatest on the job satisfaction of those respondents with the highest levels of educational attainment while other factors, including meaningful work, respect and support, were more central for respondents with lower levels of educational attainment. Results of this analysis are presented in Table 8.
Standardised total effect sizes for job satisfaction and psychological wellbeing

Note: TAFE: Technical and Further Education.
Turning to the case of psychological wellbeing, differences were again observed. Everyday discrimination was most important for respondents with an undergraduate level of education (−0.252), although, overall the most important predictor for this group was respect. By contrast, meaningful work was the most consistent important predictor of psychological wellbeing among those with lower educational attainment, as was the case with job satisfaction. Notably, the level of supervisor consultation and training was of relatively little importance for all groups. However, the relatively low R 2 (variance explained by the model) suggests that there are many variables outside of this study that were affecting psychological wellbeing. An alternative explanation is the quality of the measure which, due to space constraints in the survey instrument, was perfunctory by current standards. Results of this analysis are presented in Table 8.
An invariance test showed that groups with different household income required different weights in the above model (χ2=160.6, df=133, p<0.05), and as a result the standardised total (direct + indirect) effect sizes differed markedly for the eight groups with different levels of household income. Everyday discrimination demonstrated a strong relationship with job satisfaction for all of the income groups except the second-highest income bracket. This group had a comparably small sample size and it is considered more spurious than the remaining groups. Thus it was concluded that everyday discrimination was of significant importance for all income groups. Other interesting differences between the income groups related to the relative importance of meaningful work that decreased as income level increased. Respect remained more important than other constructs, across the income ranges. Meanwhile, participation in training and supervisor consultation appeared to be a weak indicator of job satisfaction for all income brackets. Altogether, the results appear to demonstrate that there are income-related differences in the effects of these various psycho-social factors on respondents' job satisfaction, perceptions concerning support and respect in particular demonstrating influence across income levels. Results of this analysis are presented in Table 8.
Turning to the case of psychological wellbeing, household income differences were again observed. As was observed with job satisfaction, respect was an important predictor of psychological wellbeing across the range of income levels. Concurrently, everyday discrimination was of mixed importance for the prediction of psychological wellbeing across the income levels, though marginally more important for the lower-level income groups. It is also notable that job insecurity was an important predictor for the two highest income brackets (−0.443 and −0.277, respectively). Interestingly, supervisor consultation and the provision of training were both of relatively low importance across these groups. Results of this analysis are presented in Table 8.
Age and gender
The model fitted the data well even when these were divided according to age and gender. However, notably, women aged 35–44 were not described as effectively by the general model. For this group an additional link was required between everyday discrimination and psychological wellbeing and between training and job satisfaction in order to achieve adequate fit. The R 2 values indicated that the model performed best for male respondents aged 20–34 and female respondents aged 45–54. The correlation between the two dependent variables, job satisfaction and psychological wellbeing, was also strongest for these groups. Results of the assessment of the fit of the proposed model are presented in Table 9. It was apparent that when multivariate analysis of variance was applied to investigate the interaction effect of gender and age, no significant interactions were present in the mean scale scores. Although no statistically significant differences were evident in the mean scale scores across the constructs of interest for these age and gender groups, differences in the total effects of these constructs at any level of the scale scores were observed.
Goodness of fit for full structural model between age groups and genders
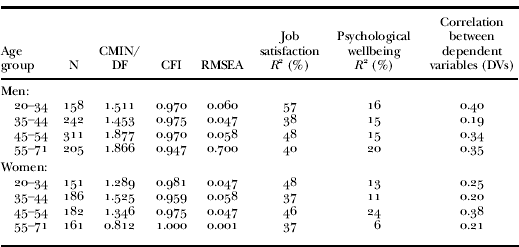
Notes: CMIN/DF: normed χ2. CFI: comparative fit index. RMSEA: root mean square error of approximation.
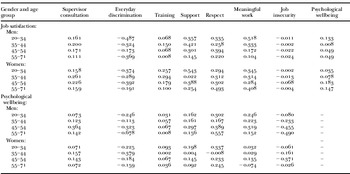
An invariance test showed that different genders and age groups required different weights in the above model (χ2=561.4, df=315, p<0.001), and as a result the standardised total (direct + indirect) effect sizes differed markedly for males and females. Everyday discrimination (−0.374) was the second most important construct for predicting job satisfaction in the case of women aged 20–34, fourth (−0.289) for the 35–44 and 55–71 age groups (−0.191), but the most important for the 45–54 age group (−0.392). Among men, everyday discrimination was the second most important predictor of job satisfaction for the 20–34 age group (−0.487), while among those aged between 35 and 54 it was the third most important predictor (−0.324 for the 35–44 age group and −0.173 for the 45–54 age group). Unlike the female sample it was found that everyday discrimination was the most important predictor of job satisfaction for the oldest age category of men (−0.369). Other interesting differences between the genders related to the relative importance of respect and support. It was evident that respect became increasingly important for women as age increased, increasing from 0.294 to 0.493, whereas the change for men with increasing age was not so linear. Meaningfulness of work was most important for the youngest male age group and for the oldest female age group, with effect sizes of 0.518 and 0.408, respectively. Notably, support was most important for the youngest women (0.543), and men aged between 35 and 44 (0.421). Receipt of training appeared to be a rather more important determinant of job satisfaction in the case of women than was the case for men. The relationship was particularly weak in the case of older men (0.100). Results of this analysis are presented in Table 10.
Standardised total effect sizes for job satisfaction and psychological wellbeing

Means and standard deviations of scale scores across groups of participants discussed in this paper

Notes: SD: standard deviation. TAFE: Technical and Further Education.
In the case of psychological wellbeing, one common important predictor was respect for both genders in the oldest age group, with effect sizes for males of 0.557 and females of 0.245. This was the most important predictor for women in this age group. In the prediction of psychological wellbeing, meaningfulness of work was a more important predictor for men of all ages. Interestingly, everyday discrimination was a very strong negative influence on wellbeing in the oldest male age group (−0.678) and a relatively weak predictor among older women (−0.159). However, as noted already, the relatively low R 2 value suggests that there were many variables outside this study that affected psychological wellbeing. Results of this analysis are presented in Table 10.
Conclusions
This study has found that everyday discrimination was a direct and indirect predictor of job satisfaction and an indirect predictor of psychological wellbeing. We also identified several other factors that appear to affect psychological wellbeing and job satisfaction. Responses from all the discrete groups assessed in this study were described effectively by the same model, excluding one. When these data were split by age and gender one change to the model was required to describe responses from females aged 35 to 44 years effectively. This distinction would require replication with an independent sample because of the exploratory nature of the model development proposed in this study.
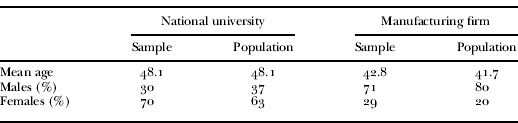
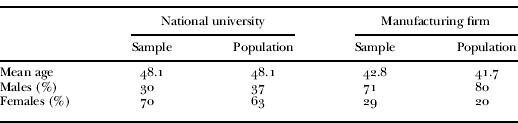
Limitations of the study also require noting and consideration. Importantly, the sample cannot be considered nationally representative. It was established that the samples drawn from the two case study organisations (a national manufacturing firm and a small national university), that accounted for more than 90 per cent of the sample, were largely reflective of the gender and age configurations of these organisations. That is, in both cases, the age and gender distributions of the organisations were equivalent to that captured in the sample.Footnote 3 Concurrently, the diversity in the sample in terms of types of work, locations across Australia and ages covered provides a reasonable argument for the use of these data for the establishment of the exploratory model. A notable characteristic of respondents was the over-representation of highly educated individuals, to be expected when conducting research with university employees (approximately 25 per cent of respondents had attained postgraduate level of education), much greater than the 5 per cent of the Australian population that attains this level of education (Australia Bureau of Statistics 2010). Due to space constraints in our survey instrument, as noted already, our measure of psychological wellbeing was relatively weak, which limits the conclusions that may be drawn from the study. Also, the study's cross-sectional design did not allow us to consider dynamic effects of discrimination over time (Glomb et al. Reference Glomb, Munson, Hulin, Bergman and Drasgow1999), necessary in order to properly explore its consequences. The potential for reverse causation is worthy of note. Reverse causation, in this case, would suggest that stronger job satisfaction and psychological wellbeing may negate the influence of acts of everyday discrimination, lack of support from management and adverse psycho-social conditions at work. Sanchez and Brock (Reference Sanchez and Brock1996) highlight the potential for reverse causation paths in research of this type, nominating a longitudinal and experimental design as the appropriate method of approaching this issue. Previous research has elucidated a relationship between everyday discrimination based on ethnicity and wellbeing, while controlling for the automatic negative perception of ambiguous events, suggesting that an internal buffer, such as strong job satisfaction and psychological wellbeing, does not determine the nature of the relationship between these factors (Schneider, Hitlan and Radhakrishnan Reference Schneider, Hitlan and Radhakrishnan2000). Despite these methodological caveats, it was possible to construct what appeared to be a robust statistical model using our data that may form the basis of a future study utilising a more sophisticated longitudinal design.
Our findings point to the need for a nuanced perspective on those factors influencing psychological wellbeing and job satisfaction which takes account of age and gender. Thus, interestingly experiences of workplace everyday discrimination appeared to be a factor of much greater salience in the working lives of men aged over 55 than was the case with women in the equivalent age group. The seeming importance of perceptions of everyday discrimination for older men as opposed to older women is worthy of follow up. For women, other measures, of respect, and to a lesser extent meaningful work, were apparently more important. Somewhat starkly, in this regard, older women were very similar to the youngest age group of men. For men aged over 55, job insecurity was a much more important determinant of psychological wellbeing than was the case for the equivalent group of women. Among women in the 45–54 age group, everyday discrimination was the most important predictor of job satisfaction. Such findings suggest that the importance of different discriminatory factors in determining job satisfaction and psychological wellbeing strongly depends on the age and gender group which is considered. They also challenge the notion that there is a kind of age and gender double jeopardy for older women (Itzin and Phillipson Reference Itzin and Phillipson1993).
Our findings provide strong justification for efforts to tackle workplace age discrimination at all ages, not only among older workers. Specifically, they suggest that greater attention be paid to early career younger workers and those aged in their mid-forties through to the mid-fifties. The findings also point to the need for management interventions that are subtle and nuanced according to the group being considered and according to gender. In considering workplace interventions targeting worker job satisfaction and psychological wellbeing, this article has contributed some new knowledge in terms of how actions could be differentiated according to age group. Notable for the oldest and youngest workers would be approaches that address issues of discrimination and build on feelings of respect, while for the middle age groups, tackling issues of job insecurity would have greater prominence. In terms of job satisfaction, employer actions might emphasise respect among those workers aged over 45, support among the youngest age group and meaningful work among those in the 35–44 age range. Also of note and concern is the seemingly minor role participating in learning activities has on older workers' psychological wellbeing. This finding provides some support for employer opinions concerning a lack of motivation to participate in learning activities among many older employees and suggests that they are likely to be highly vulnerable in a competitive job market. Alternatively, older workers, who are known to experience exclusion from training (Taylor and Urwin Reference Taylor and Urwin2001), may derive self-esteem elsewhere. Either way, development opportunities that would benefit older workers may face limited take up. There would be value in interventions that aimed to help workers understand the value of participation in development and training activities.
Acknowledgements
The authors would like to acknowledge and thank the reviewers whose suggestions and advice have greatly improved this article. This project was funded by grant LP0562052 from the Australian Research Council and by industry partners.
Constructs and items used in the structural equation model including regression weights for item contribution

Proportion of respondents by age and gender sampled compared to the population of the organisation