Introduction
Rare-earth elements (REE) rank among the strategic raw materials for modern high-technology industries. These elements are typically concentrated in phosphate minerals such as monazite, but also occur in carbonates such as bastnäsite and, less commonly, in members of the alunite supergroup, notably the florencite group. Within this group, classification into the plumbogummite and dussertite subgroups depends on whether phosphate (PO43–) or arsenate (AsO43–) anions dominate the tetrahedral site (Bayliss et al., Reference Bayliss, Kolitsch, Nickel and Pring2010; Back, Reference Back2018).
The substitution of P5+ by As5+ in florencite-group minerals has been reported widely, but systematic crystal-chemical investigations of the florencite-(La)–arsenoflorencite-(La) solid solution are limited. Reports of substitutions involving alternative tetrahedral groups are even rarer, particularly those concerning sulfate (SO42–) in REE-bearing phases. In this context, it is important to note that if As were to predominate over P in the tetrahedral site, the correct mineralogical name would be arsenoflorencite-(La). Florencite-(La) was approved as a mineral species by the International Mineralogical Association (IMA) in 1987 (IMA1987-s.p.; Lefebvre and Gasparrini, Reference Lefebvre and Gasparrini1980), whereas arsenoflorencite-(La) was only recognised in 2009 (IMA2009-078; Mills et al., Reference Mills, Kartashov, Kampf and Raudsepp2010). Historically, cerium-dominant analogues of this group have been described more frequently (Hussak and Prior, Reference Hussak and Prior1900; Nickel and Temperley, Reference Nickel and Temperly1987).
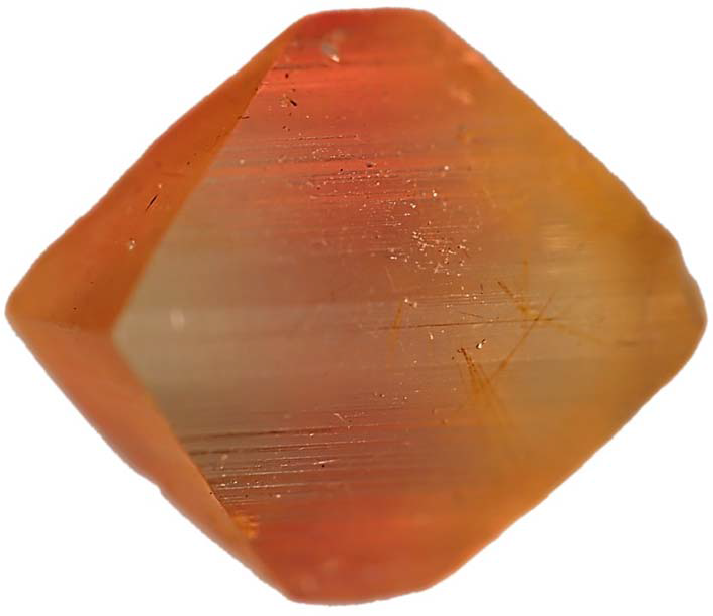
This study describes the occurrence and crystal-chemical characterization of As-rich florencite-(La) as microscopic inclusions within pink-orange euclase (Fig. 1) and colourless quartz crystals from auriferous hydrothermal quartz veins in the Abaíra region, Bahia State, Brazil. The compositional variability along the PO43––AsO43– solid solution was investigated using electron-probe microanalysis (EPMA) and single-crystal X-ray diffraction. Raman spectroscopy was further employed to evaluate the presence of hydroxyl groups, thereby providing additional constraints on the structure of this hydrated phase.
Rough pink-orange euclase crystal from Abaíra, Bahia, Brazil. Maximum crystal width: 22 mm. Photo by Jurgen Schnellrath.

Geological setting
The As-rich florencite-(La) crystals studied were recovered from hydrothermal veins located in the municipality of Abaíra, in the central region of Bahia State, Brazil (Chaves et al., Reference Chaves, Cornejo and Queiroz2025). These veins are hosted in quartzites of the Ouricuri do Ouro Formation, at the base of the Paraguaçu Group, and are in contact with metarhyolites from the upper portion of the Rio dos Remédios Group (Gilles-Guéry et al., Reference Gilles-Guéry, Queiroz, Schnellrath, Williams, Williams, Barbosa, Laurs, Galoise and Calas2022).
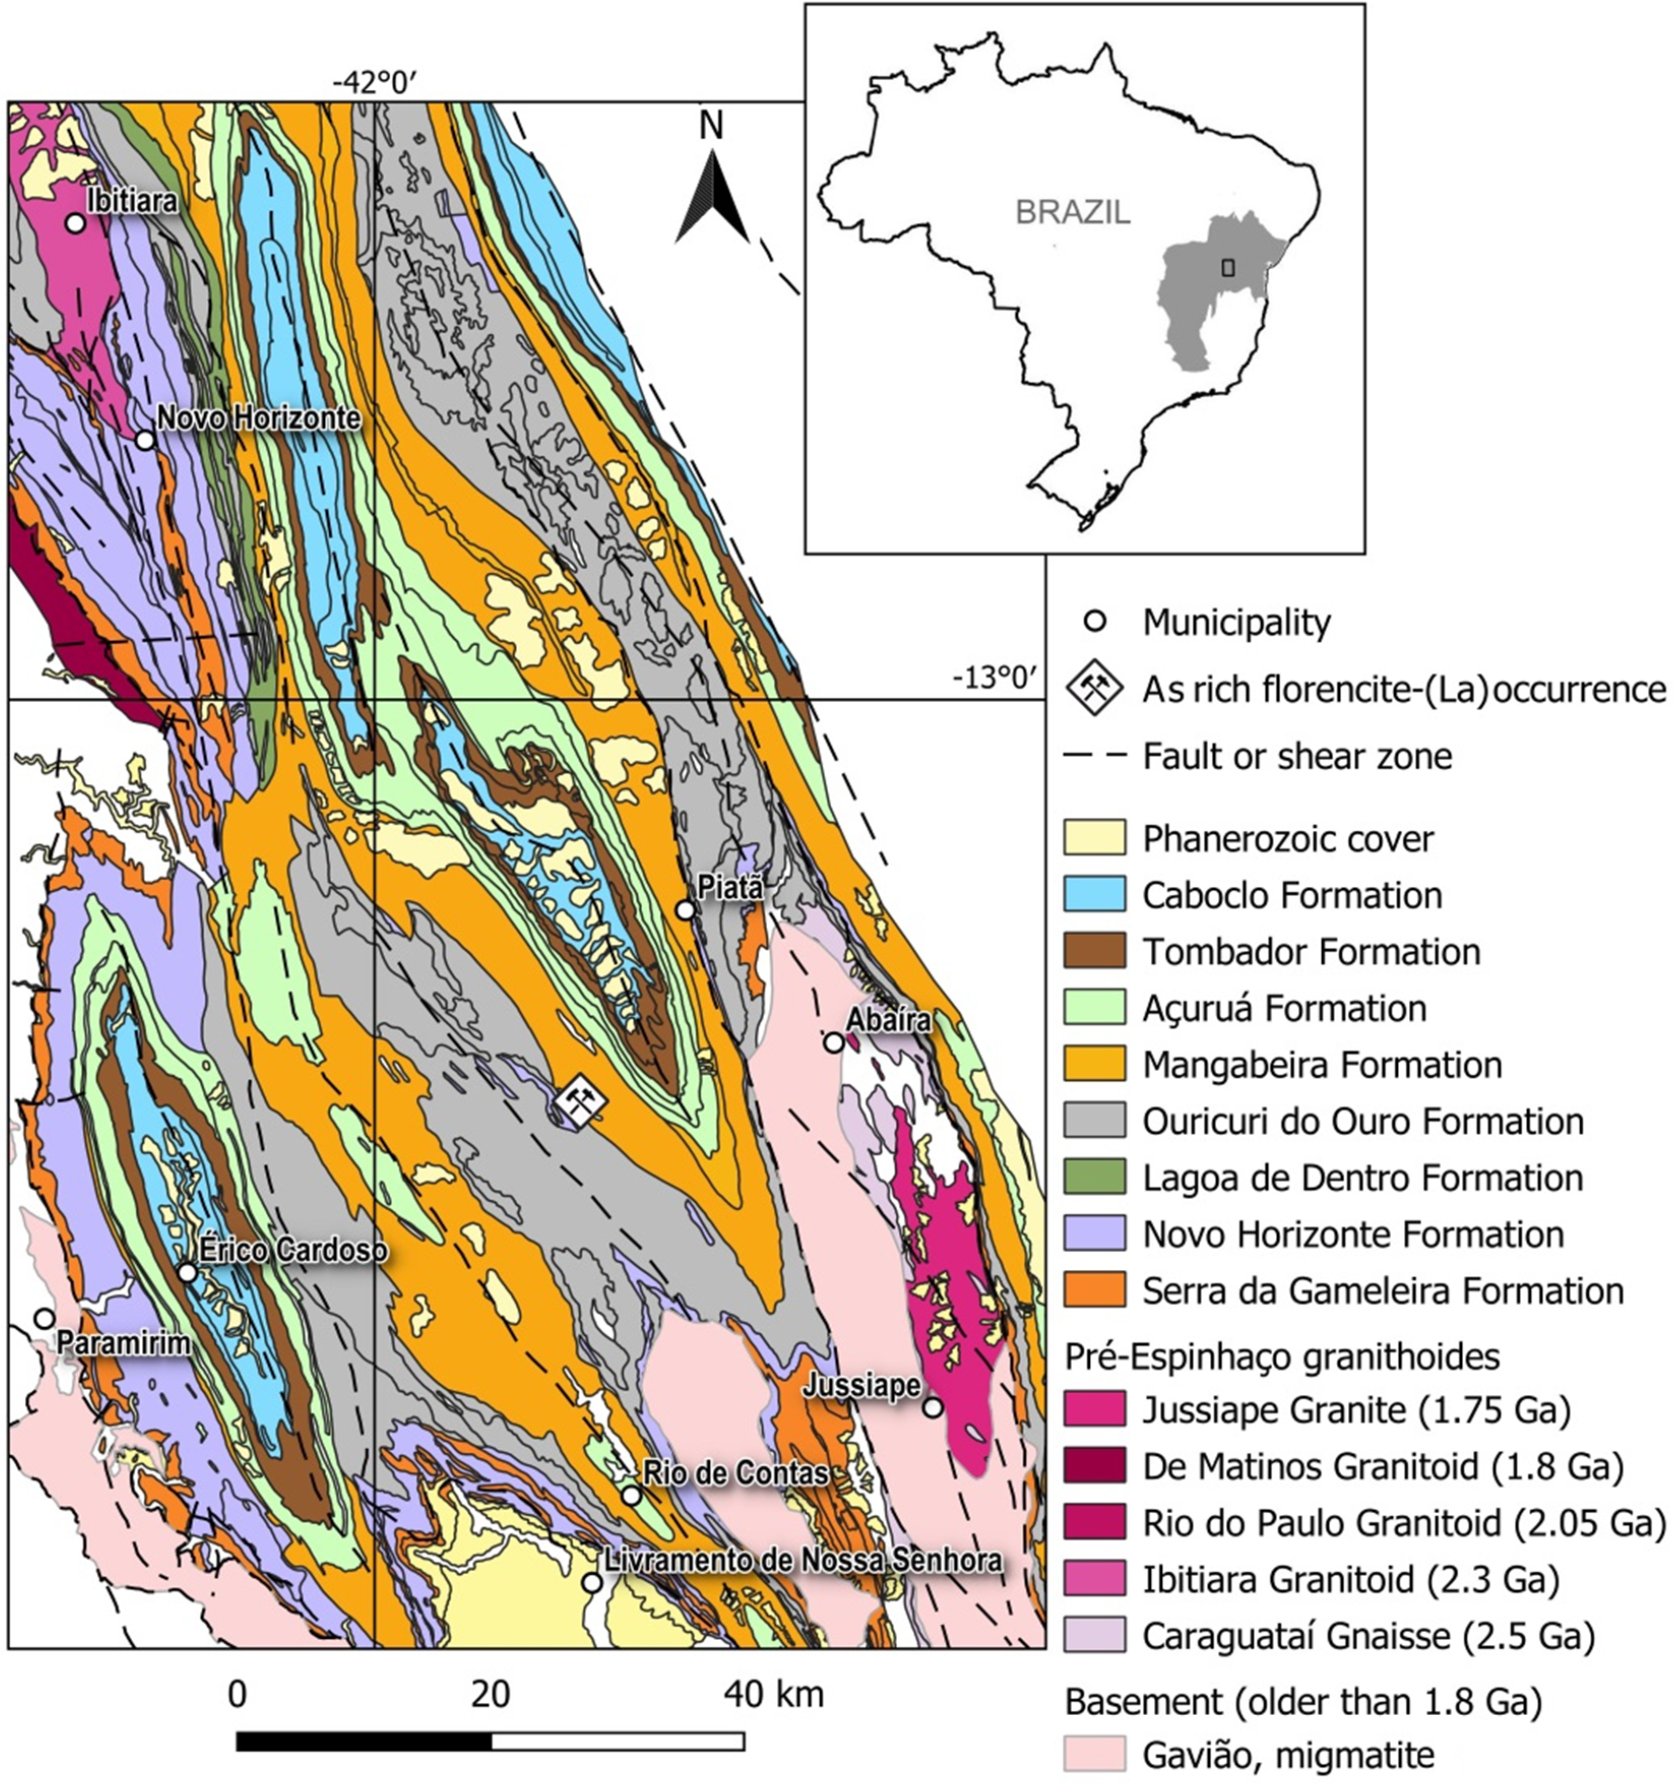
This geological domain belongs to the Espinhaço Supergroup, a Mesoproterozoic megasequence comprising thick packages of continental, marine and volcanic/metavolcanic metasedimentary rocks deposited ∼1.75–1.80 Ga ago (Guimarães et al., Reference Guimarães, Martins, Filho, Loureiro, Arcanjo, Neves, Abram, Silva, Melo and Bento2005). The Espinhaço units were deposited over Archaean to Palaeoproterozoic basement rocks of the São Francisco Craton and are divided stratigraphically into three main groups (Fig. 2): (1) Serra da Gameleira; (2) Rio dos Remédios Group (Novo Horizonte and Lagoa de Dentro formations); and (3) Paraguaçu Group (Ouricuri do Ouro, Mangabeira, and Açuruá formations). Overlying these are the Chapada Diamantina Group (Tombador and Caboclo formations) and the younger Morro do Chapéu Formation (Guimarães et al., Reference Guimarães, Alkmim, Cruz and Barbosa2012).
Map of Brazil at upper right showing the location of the São Francisco Craton. The highlighted rectangle indicates the area enlarged to display a geological sketch of the occurrence site of As-rich florencite-(La), modified from Guimarães et al. (Reference Guimarães, Martins, Filho, Loureiro, Arcanjo, Neves, Abram, Silva, Melo and Bento2005).

Figure 2 Long description
The map displays the Sao Francisco Craton in Brazil, highlighting the location of As-rich florencite-(La) occurrence. The enlarged geological sketch shows various formations and geological features. The legend includes symbols for municipalities, As-rich florencite-(La) occurrences and fault or shear zones. Geological formations are color-coded: Phanerozoic cover, Caboclo, Tombador, Acurua, Mangabeira, Ouricuri do Ouro, Lagoa de Dentro, Novo Horizonte and Serra da Gameleira formations. Pre-Espinhaco granitoids are marked with specific ages: Jussipape Granite (1.75 Ga), De Matinos Granitoid (1.8 Ga), Rio do Paulo Granitoid (2.05 Ga), Itiuba Granitoid (2.3 Ga), Caraguatai Gneisse (2.5 Ga). Basement older than 1.8 Ga is indicated as Gaviao, migmatite. The map includes a scale bar of 40 km and a north arrow for orientation.
Following deposition, the region underwent significant deformation during the Neoproterozoic Brasiliano Orogeny (∼600–500 Ma), associated with the final amalgamation of Gondwana. This tectonic event resulted in crustal shortening, thickening, and the formation of major shear zones and fold-thrust belts, such as the Araçuaí Belt to the south (Almeida, Reference Almeida1967, Reference Almeida1977; Trompette, Reference Trompette1994). In the Chapada Diamantina region, deformation intensity increases from north to south but generally remains within the greenschist metamorphic facies (Torquato and Fogaça, Reference Torquato and Fogaça1981; Süssenberger et al., Reference Süssenberger, Neves and Wemmer2014). The genesis of most mineral deposits in the area, including gold, baryte, rutilated quartz and pyrophyllite, is associated with the circulation of low-temperature hydrothermal fluids during this orogenic episode (Guimarães et al., Reference Guimarães, Martins, Filho, Loureiro, Arcanjo, Neves, Abram, Silva, Melo and Bento2005; Teixeira et al., Reference Teixeira, Misi, Silva and Brito2019).
U-Pb age determination of xenotime-(Y) from quartz veins in the Rio dos Remédios Group yielded ages of 491.7 ± 1.0 Ma, 493.0 ± 0.93 Ma, and 504.1 ± 0.78 Ma (Chaves et al., Reference Chaves, Buhn, Dias and Menezes Filho2018), confirming that the hydrothermal mineralization is temporally related to the late stages of the Brasiliano Orogeny.
Materials and methods
Microscopy and imaging
Rough crystals of euclase (BeAlSiO4(OH)) and quartz were examined under a Carl Zeiss Stemi 2000-C stereomicroscope using 1-bromonaphthalene as the immersion medium to enhance contrast and identify inclusions. Photomicrographs were acquired using a Canon EOS 6D digital camera under transmitted polarised light.
Electron probe microanalysis (EPMA)
Quantitative chemical analyses were carried out using a CAMECA SXFive electron microprobe at the Electron Microprobe Laboratory, Institute of Geosciences, Federal University of Rio Grande do Sul (UFRGS). The instrument was equipped with five wavelength-dispersive spectrometers (WDS), an energy-dispersive spectrometer (EDS), and an optical microscope. Analyses were performed with an accelerating voltage of 15 kV, beam current of 20 nA, and a beam diameter of 1 μm. Counting times were 10 s at the peak, 5 s background for Al, P, As and La; 20 s at the peak and 10 s at the background for Ca, Ba and Nd; and 30 s at the peak and 15 s in the background for S, Ce, Pr, Sm, Dy and Si. The crystals used were TAP (Si, Al and As), LPET (Ca, P, S, Sr and Ba) and LLIF (Fe, REEs). To avoid peak overlaps, Lβ lines were used for Pr, Nd, Sm and Dy.
Cation proportions were calculated using the normalization scheme of Janeczek and Ewing (Reference Janeczek and Ewing1996), assuming six cations and 14 oxygen atoms per formula unit. Minor elements (S, Si) and As were considered as partial substitutes for P. Hydrogen content was estimated based on charge balance, assuming six hydroxyl groups per unit cell. The site occupancy model followed the general formula DG 3(TX 4)2X´ 6 as proposed by Smith et al. (Reference Smith, Roberts, Bayliss and Liebau1998) and Bayliss et al. (Reference Bayliss, Kolitsch, Nickel and Pring2010), with D, G and T sites corresponding to 1, 3 and 2 cationic positions, respectively.
Single-crystal X-ray diffraction (SCXRD)
Crystallographic analyses were conducted at the Multiuser X-ray Diffraction Laboratory (LDRX) of Universidade Federal Fluminense (UFF) using a Bruker D8 Venture diffractometer equipped with a graphite-monochromated MoKα source (λ = 0.71073 Å) and CMOS detector. Two crystals were analysed, one from a euclase inclusion and the other from a quartz inclusion. Data were collected at 273 K, with 2θ ranging up to 30.46° (sample 1) and 26.34° (sample 2), and a detector distance of 40 mm. The Bruker programs (Bruker AXS Inc, Wisconsin, USA) were used for data reduction (SAINT) and absorption corrections (SADABS). Structural refinement was performed using SHELX-18 (Sheldrick, Reference Sheldrick2015) within the WinGX suite (Farrugia, Reference Farrugia1999), in space group R  $ \bar 3$m, using initial atomic coordinates from the alunite structure model (Mills et al., Reference Mills, Kartashov, Kampf and Raudsepp2010). The P/As site was refined with mixed occupancy and a vacancy of 0.03. All non-hydrogen atoms were refined anisotropically. Powder XRD was not conducted due to limited sample availability.
Raman spectroscopy
Micro-Raman analyses were performed using a WITec alpha300 R Raman microscope at the Centro de Tecnologia em Nanomateriais e Grafeno (CTNano), Universidade Federal de Minas Gerais (UFMG). Spectra were acquired with a 532 nm laser (20 mW max power), 50× objective, and six accumulations of 5 s integration each, yielding ∼5 cm–1 resolution. The spectra were collected in the 100–3800 cm–1 range at room temperature in random crystal orientations. Baseline correction was performed using GRAMS, and peak deconvolution was carried out with PeakFit v.4.12, applying Lorentzian-Gaussian mixed functions with minimal component fitting.
Results
General description and optical microscopy identification
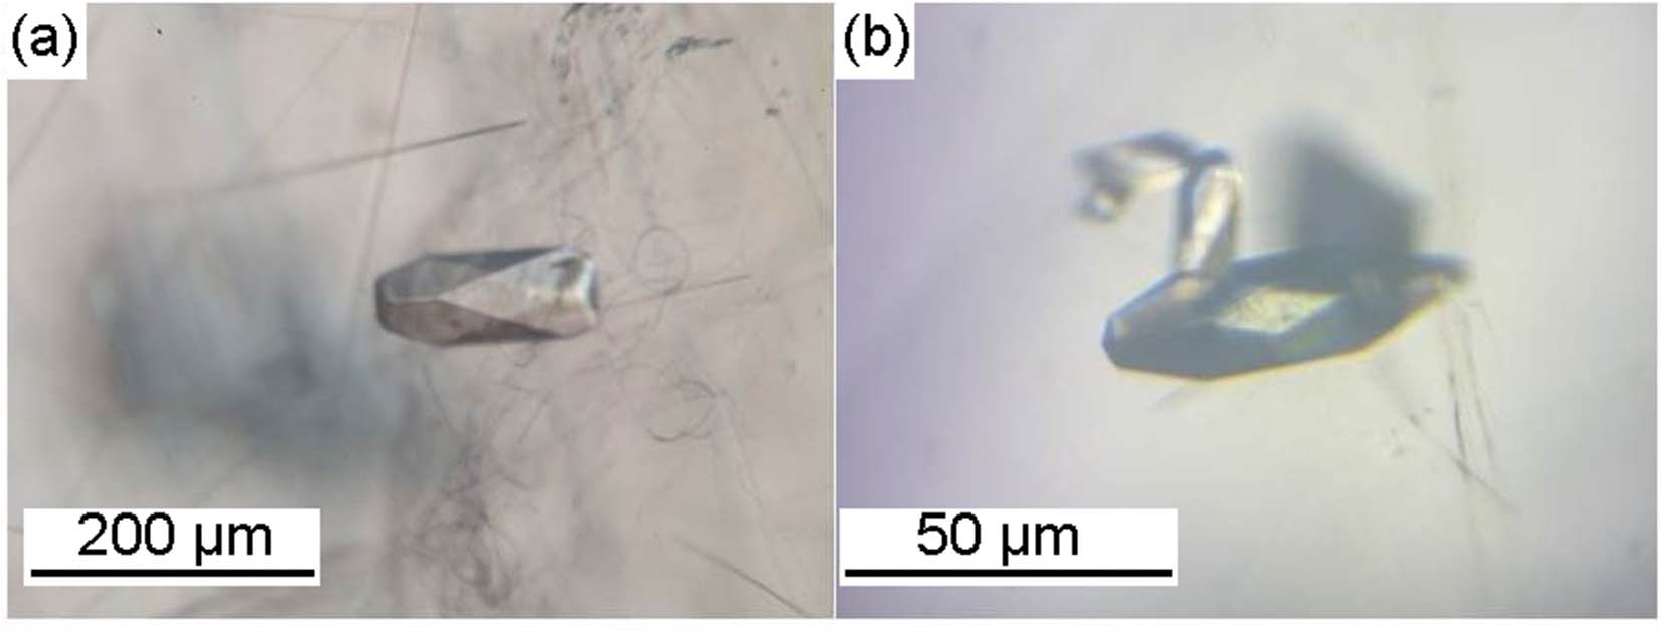
Colourless to pale yellow, transparent minerals were observed as inclusions within euclase (Fig. 3a) and quartz crystals (Fig. 3b), measuring ∼150 μm × 70 μm and 60 μm × 20 μm respectively. Under polarised transmitted light microscopy, the euhedral crystals studied exhibited rhombohedral and scalenohedral crystal forms, with a pseudo-cubic habit. These inclusions were commonly associated with other mineral phases such as dolomite, quartz, phyllosilicates and cryptomelane–hollandite-type fibres and cylinders. Numerous negative crystals of varied and peculiar morphologies, as well as fluid inclusions, were also identified.
Euhedral crystals of As-rich florencite-(La) occurring as inclusions in: (a) pink-orange euclase, associated with woolly-type inclusions; and (b) quartz crystals hosting fibrous inclusions.

Electron probe microanalyses
Nine spot analyses were obtained from various zones of a florencite-(La) inclusion occurring within the euclase crystal analysed. The EPMA data were recalculated on an anhydrous basis to derive cation proportions per formula unit (apfu) for florencite-(La), based on 14 oxygen atoms. The general formula of the florencite–arsenoflorencite-(La) solid solution is expressed as LaAl3(PO4,AsO4)2(OH)6, derived from the alunite supergroup formula DG 3(TX 4)2X´6, as proposed by Smith et al. (Reference Smith, Roberts, Bayliss and Liebau1998) and Bayliss et al. (Reference Bayliss, Kolitsch, Nickel and Pring2010).
In this structural model, the D site is typically occupied by large cations (REE3+, Ca2+, Sr2+, Ba2+, Pb2+, etc.); the G site corresponds to a trivalent octahedral position, often occupied by Al3+ or Fe3+ and occasionally by divalent or trivalent transition metals (Cu2+, Zn2+, V3+); and the T site is tetrahedral, generally occupied by PO43–, AsO43–, SO42– or minor SiO44–. The X/X′ sites are dominated by O2– and OH–, with minor incorporation of F– and H2O. Due to extensive potential for ionic substitution, these compositions often involve OH-for-O replacement in the tetrahedron, H2O-for-OH substitution, and partial occupancy of cationic sites (Jambor, Reference Jambor1999; Dill, Reference Dill2001).
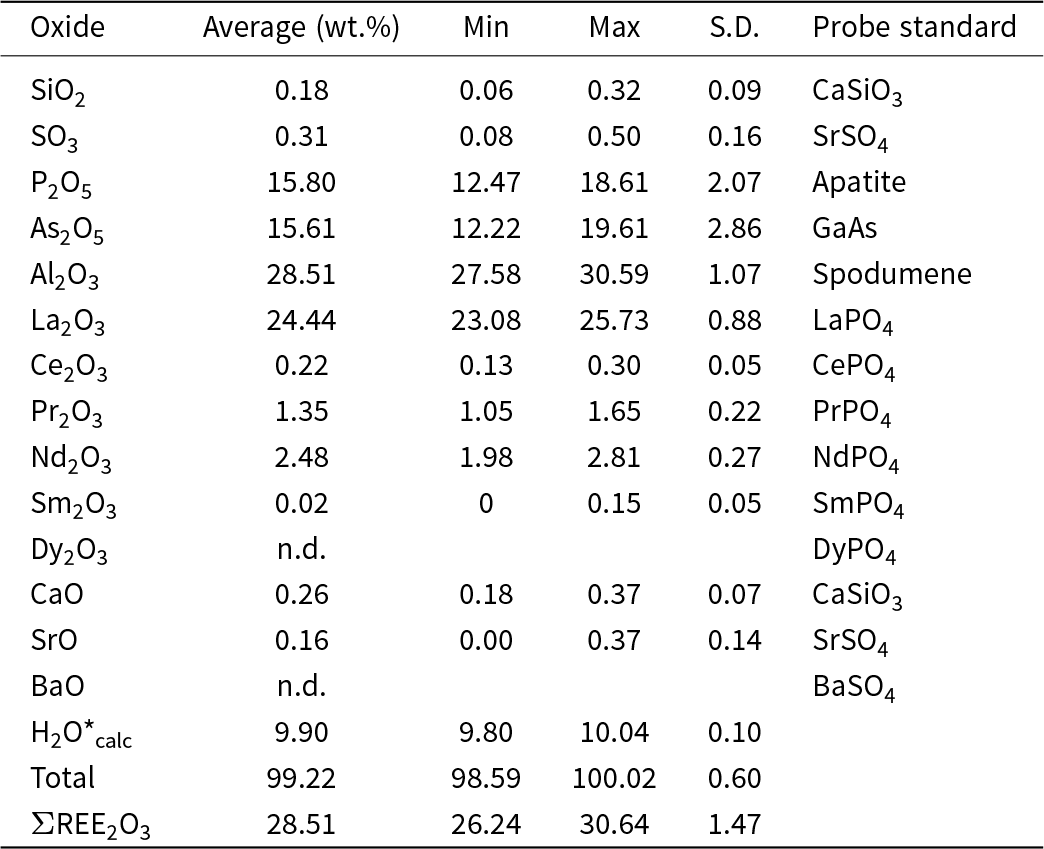
The full dataset of spot analyses is presented in Table 1. Normalization to 14 O atoms yielded the average empirical formula: (La0.94Nd0.08Pr0.04Ca0.02Ce0.01Sr0.01)Σ1.10Al2.99(P1.19As0.74S0.02Si0.02)Σ1.97O14H5.91
Electron probe microanalysis (EPMA) data (n = 9) for As-rich florencite-(La) occurring as inclusions in euclase sample

Table 1 Long description
Electron probe microanalysis results are reported as oxide composition in weight percent, with columns for Average, Min, Max, S. D., and Probe standard. Silicon dioxide averages 0.18 with a minimum of 0.06 and maximum of 0.32, and sulfur trioxide averages 0.31 with a minimum of 0.08 and maximum of 0.50. Phosphorus pentoxide averages 15.80 with a minimum of 12.47 and maximum of 18.61, and arsenic pentoxide averages 15.61 with a minimum of 12.22 and maximum of 19.61. Aluminum oxide averages 28.51 with a minimum of 27.58 and maximum of 30.59, and lanthanum oxide averages 24.44 with a minimum of 23.08 and maximum of 25.73. Cerium oxide averages 0.22, praseodymium oxide 1.35, neodymium oxide 2.48, and samarium oxide 0.02, each with listed minima, maxima, and standard deviations; dysprosium oxide is marked n.d. Calcium oxide averages 0.26, strontium oxide 0.16, and barium oxide is marked n.d. with min, max, and S. D. shown as 0. Water, calc averages 9.90 with a minimum of 9.80 and maximum of 10.04, total averages 99.22 with a minimum of 98.59 and maximum of 100.02, and the row labeled ree two o three totals averages 28.51 with a minimum of 26.24 and maximum of 30.64. Probe standards are listed per oxide, including CaSiO3 for silicon dioxide and calcium oxide, SrSO4 for sulfur trioxide and strontium oxide, apatite for phosphorus pentoxide, GaAs for arsenic pentoxide, spodumene for aluminum oxide, and rare earth phosphates for the rare earth oxides.
Notes: S.D. – standard deviation
The H2O content was calculated by considering six OH groups, with the possibility of additional H atoms introduced by the coupled substitution mechanism REE3+ = M 2+ + H+. This process implies that some hydrogen may be structurally incorporated at apical positions of the tetrahedron. Thus, the G, D and T sites correspond to 3, 1 and 2 cations respectively, distributed over 11 O atoms (eight from the tetrahedra and three from hydroxyl groups), summing to a total of 14 O atoms in the structural formula. When normalised to an anhydrous basis, charge-balance calculations from the EPMA data indicate only OH groups in the structure, with no requirement for molecular water.
Crystallographic data
Single-crystal X-ray diffraction analyses yielded the following unit-cell parameters (space group R  $ \bar 3$m, Z = 3):
Sample 1 (euclase inclusion): a = 6.9767 Å, c = 16.3495 Å
Sample 2 (quartz inclusion): a = 6.9813 Å, c = 16.3656 Å
The best-fit structural formulae are:
Sample 1: (La1)(Al3)(P1.47As0.49)Σ1.96O14H6.2
Sample 2: (La1)(Al3)(P1.37As0.59)Σ1.96O14H6.2
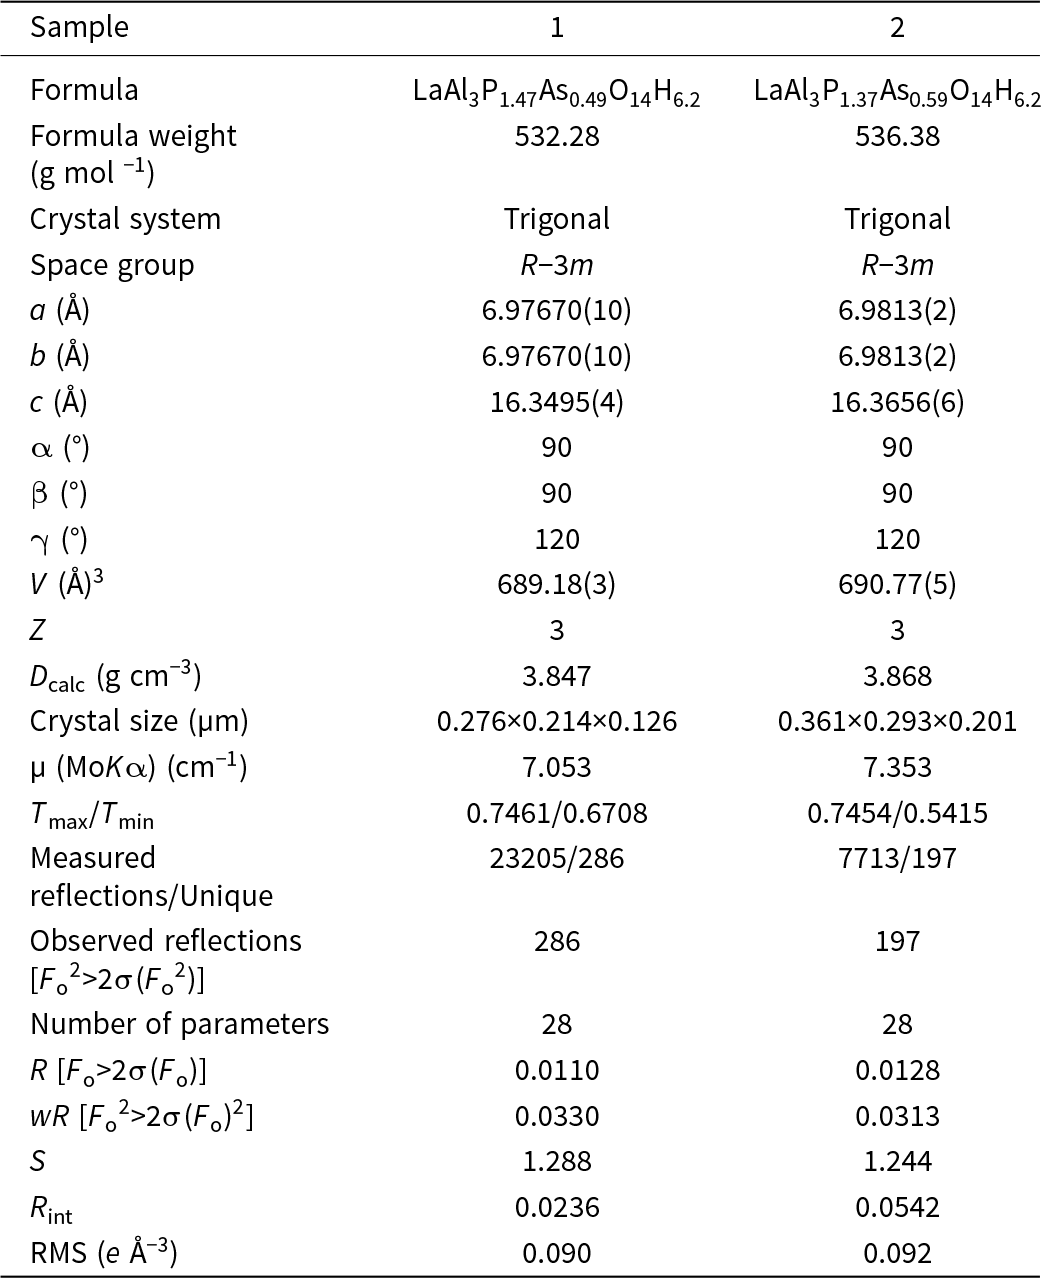
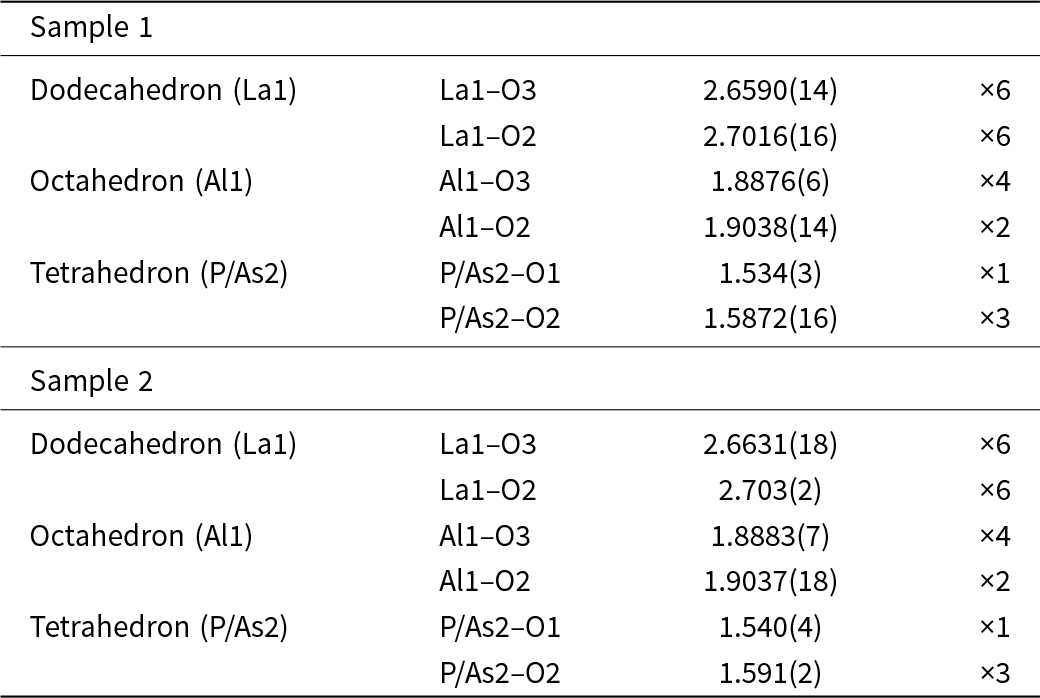
Sample 2 exhibits a slightly lower phosphorous content and correspondingly higher arsenic content, resulting in marginally expanded unit-cell parameters compared to Sample 1. This trend reflects the larger ionic radius of As5+ compared to P5+, indicating that compositional variation at the tetrahedral site can influence unit-cell dimensions. Crystallographic parameters are listed in Table 2 and the polyhedral bond distances in Table 3. The crystallographic information files have been deposited and are available as Supplementary material (see below).
Crystallographic parameters of As-rich florencite (La) in euclase (sample 1) and quartz (sample 2)

Table 2 Long description
Crystallographic and refinement parameters are listed for two samples, labeled 1 and 2. For sample 1, formula is LaAl3P1.47As0.49O14H6.2 and formula weight is 532.28 grams per mole; for sample 2, formula is LaAl3P1.37As0.59O14H6.2 and formula weight is 536.38 grams per mole. Both samples have crystal system trigonal and space group R minus 3 m. Unit cell parameters for sample 1 are a 6.97670(10) angstroms, b 6.97670(10) angstroms, c 16.3495(4) angstroms, alpha 90 degrees, beta 90 degrees, gamma 120 degrees, volume 689.18(3) cubic angstroms, Z 3, and calculated density 3.847 grams per cubic centimeter. Unit cell parameters for sample 2 are a 6.9813(2) angstroms, b 6.9813(2) angstroms, c 16.3656(6) angstroms, alpha 90 degrees, beta 90 degrees, gamma 120 degrees, volume 690.77(5) cubic angstroms, Z 3, and calculated density 3.868 grams per cubic centimeter. Crystal size is 0.276 by 0.214 by 0.126 micrometers for sample 1 and 0.361 by 0.293 by 0.201 micrometers for sample 2; absorption coefficient mu for MoK alpha is 7.053 per centimeter for sample 1 and 7.353 per centimeter for sample 2; Tmax over Tmin is 0.7461 over 0.6708 for sample 1 and 0.7454 over 0.5415 for sample 2. Measured reflections over unique are 23205 over 286 for sample 1 and 7713 over 197 for sample 2, with observed reflections listed as 286 for sample 1 and 197 for sample 2; number of parameters is 28 for both. Refinement indicators are R 0.0110 for sample 1 and 0.0128 for sample 2, wR 0.0330 for sample 1 and 0.0313 for sample 2, S 1.288 for sample 1 and 1.244 for sample 2, Rint 0.0236 for sample 1 and 0.0542 for sample 2, and RMS e per cubic angstrom 0.090 for sample 1 and 0.092 for sample 2.
Polyhedral bond distances (Å) in As-rich florencite from samples 1 (in euclase) and 2 (in quartz)

Table 3 Long description
Bond distances are listed in angstroms for two samples, grouped by polyhedron type and site, with a final column giving multiplicity. For sample 1, dodecahedron La1 has La1 to O3 at 2.6590(14) with multiplicity 6 and La1 to O2 at 2.7016(16) with multiplicity 6. For sample 1, octahedron Al1 has Al1 to O3 at 1.8876(6) with multiplicity 4 and Al1 to O2 at 1.9038(14) with multiplicity 2. For sample 1, tetrahedron P or As2 has P or As2 to O1 at 1.534(3) with multiplicity 1 and P or As2 to O2 at 1.5872(16) with multiplicity 3. For sample 2, dodecahedron La1 has La1 to O3 at 2.6631(18) with multiplicity 6 and La1 to O2 at 2.703(2) with multiplicity 6. For sample 2, octahedron Al1 has Al1 to O3 at 1.8883(7) with multiplicity 4 and Al1 to O2 at 1.9037(18) with multiplicity 2. For sample 2, tetrahedron P or As2 has P or As2 to O1 at 1.540(4) with multiplicity 1 and P or As2 to O2 at 1.591(2) with multiplicity 3.
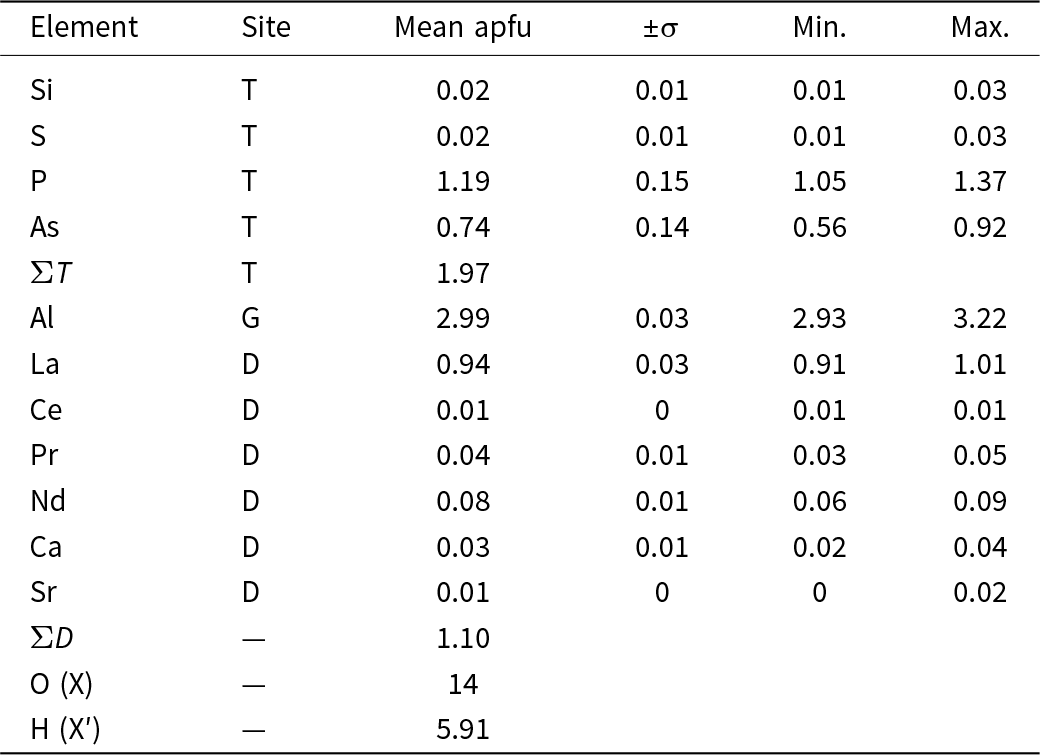
The D (lanthanide) site was modelled as predominantly occupied by La3+, yielding a distorted dodecahedron with an average La–O distance of 6.6803 Å. Although EPMA data (Table 4) indicate minor amounts of other REE (e.g. Nd, Pr and Ce), attempts to refine mixed La/REE occupancies produced unstable or non-physical parameters, therefore, the final structural model retains La only at the D site.
Chemical composition of the As-rich florencite-(La) inclusions, within the euclase crystal, expressed as atoms per formula unit (apfu), and normalised to 14 oxygen atoms. Values were calculated based on EPMA data (n = 9)

Table 4 Long description
Chemical composition is reported as atoms per formula unit, with columns for Element, Site, Mean apfu, plus or minus sigma, Min., and Max. T site values list Si mean 0.02 with sigma 0.01, range 0.01 to 0.03; S mean 0.02 with sigma 0.01, range 0.01 to 0.03; P mean 1.19 with sigma 0.15, range 1.05 to 1.37; and As mean 0.74 with sigma 0.14, range 0.56 to 0.92. The row labeled total T at site T reports mean apfu 1.97 with no sigma, minimum, or maximum shown. G site lists Al mean 2.99 with sigma 0.03, range 2.93 to 3.22. D site values list La mean 0.94 with sigma 0.03, range 0.91 to 1.01; Ce mean 0.01 with sigma 0, range 0.01 to 0.01; Pr mean 0.04 with sigma 0.01, range 0.03 to 0.05; Nd mean 0.08 with sigma 0.01, range 0.06 to 0.09; Ca mean 0.03 with sigma 0.01, range 0.02 to 0.04; and Sr mean 0.01 with sigma 0, range 0 to 0.02. The row labeled total D shows mean apfu 1.10 with no sigma, minimum, or maximum shown. Two additional rows list O at site X as 14 and H at site X prime as 5.91, with no sigma, minimum, or maximum shown.
The TO4 tetrahedra show variable P and As proportions. The average 〈As–O〉 bond lengths are 1.5739 Å in Sample 1 and 1.5783 Å in Sample 2. These values are slightly longer than reported by Scharm et al. (Reference Scharm, Kuehn, Scharmova and Novak1985) for florencite-(La) and shorter than that reported by Mills et al. (Reference Mills, Kartashov, Kampf and Raudsepp2010) for pure arsenoflorencite-(La) (1.668 Å). This supports the interpretation that increasing phosphorous content reduces both 〈T–O〉 bond lengths and unit-cell volume. Attempts to refine occupancy by S and Si at the tetrahedral site resulted in significant discrepancies with EPMA data and were not retained in the final model.
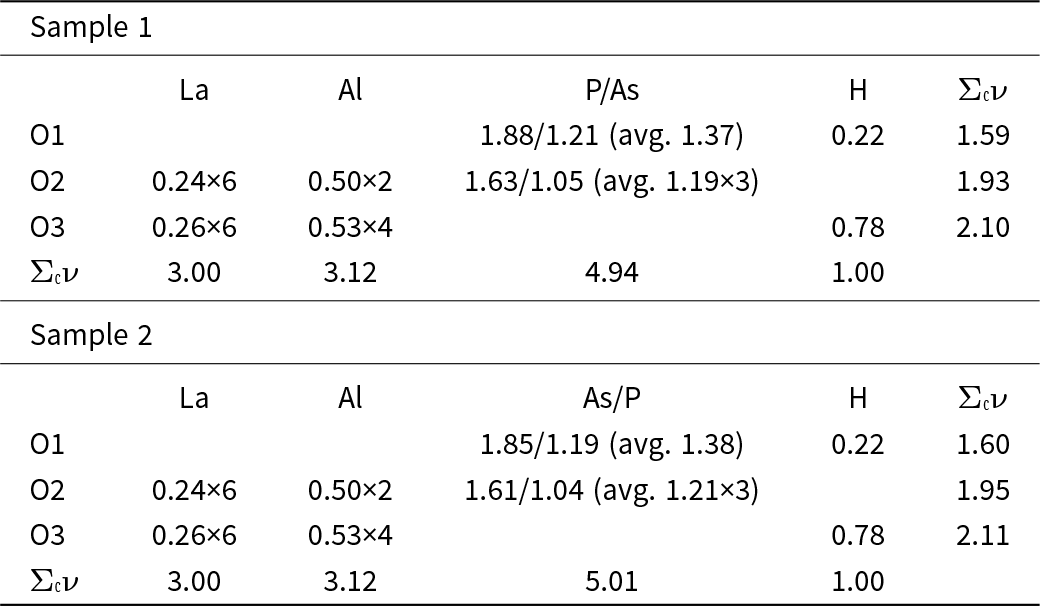
The G site forms a distorted octahedron, with Al–O bond lengths averaging 1.893 Å in both samples (Table 3). Bond-valence values for the mixed P/As site are presented in Table 5 as individual contributions followed by the weighted average. Notably, this indicates that the AlO6 geometry remains unaffected by the composition of the tetrahedral site. Hydrogen positions were fixed during refinement, as free refinement consistently yielded unrealistic geometries.
Bond valence analysis (vu) for As-rich florencite-(La) in sample 1 (euclase) and 2 (quartz)

Table 5 Long description
Bond valence values in vu are listed for two samples, each with rows O1, O2, O3, and a final row labeled Sigma with superscript c and nu. Columns for sample 1 are La, Al, P slash As, H, and Sigma with superscript c and nu; columns for sample 2 are La, Al, As slash P, H, and Sigma with superscript c and nu. For sample 1, O1 has P slash As 1.88 slash 1.21 with average 1.37, H 0.22, and total 1.59; O2 has La 0.24 times 6, Al 0.50 times 2, P slash As 1.63 slash 1.05 with average 1.19 times 3, and total 1.93; O3 has La 0.26 times 6, Al 0.53 times 4, H 0.78, and total 2.10. For sample 1 totals, La is 3.00, Al is 3.12, P slash As is 4.94, and H is 1.00. For sample 2, O1 has As slash P 1.85 slash 1.19 with average 1.38, H 0.22, and total 1.60; O2 has La 0.24 times 6, Al 0.50 times 2, As slash P 1.61 slash 1.04 with average 1.21 times 3, and total 1.95; O3 has La 0.26 times 6, Al 0.53 times 4, H 0.78, and total 2.11. For sample 2 totals, La is 3.00, Al is 3.12, As slash P is 5.01, and H is 1.00.
Raman Spectroscopy
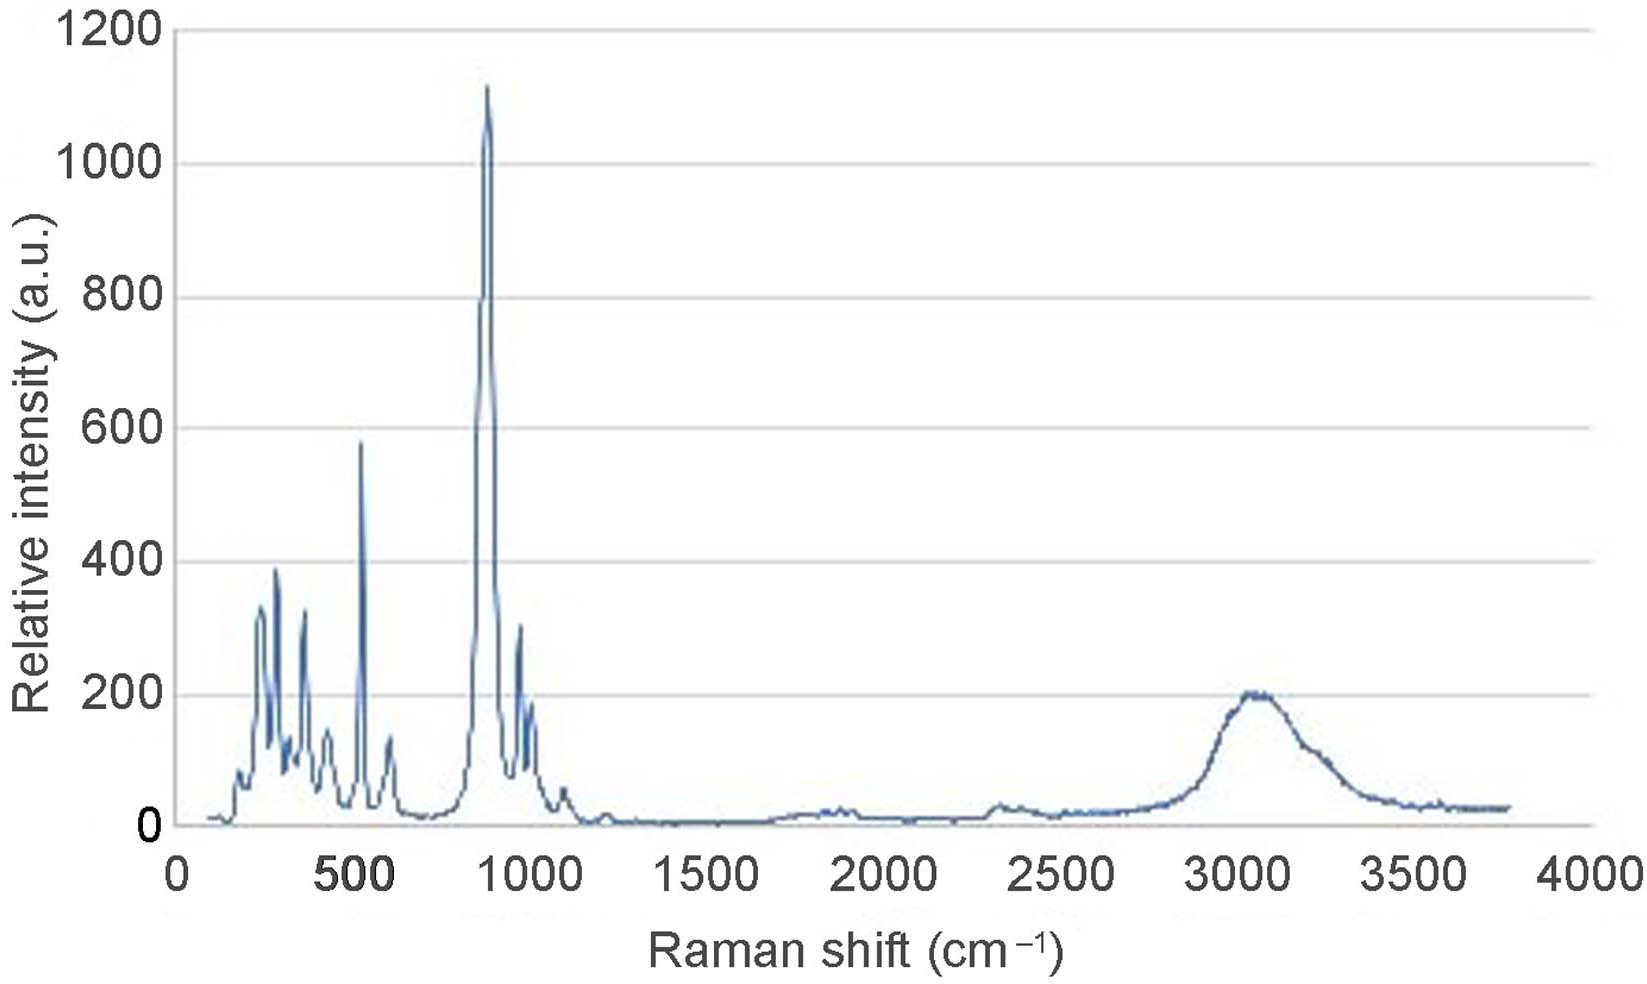
Raman spectra of As-rich florencite-(La) crystals (Fig. 4) were recorded over the range 0–3800 cm–1. A broad feature between 2860 and 3320 cm–1 indicates variable hydrogen bonding, mainly due to structural hydroxyls with possible minor contributions from weakly bound or disordered H2O. By contrast, the sharp band at 3576 cm–1 is assigned to a well defined OH stretching vibration commonly observed for structural hydroxyl in florencite-group minerals. Weak features observed near 1880 and 2334 cm–1 fall outside the expected region for the fundamental H–O–H bending mode (≈1600–1650 cm–1) and should therefore be regarded as tentative; they may represent combination/overtone bands or coupling with lattice modes rather than a straightforward δ(H–O–H) assignment. These interpretations are broadly consistent with prior Raman studies of florencite-group and related hydrated phosphates (Frost et al., Reference Frost, Xi, Scholz and Tazava2013a, Reference Frost, Palmer, Xi, Cejka, Sejkora and Plasil2013b; Zhukova et al., Reference Zhukova, Stepanov, Korsakov and Jiang2022).
Representative wide-range micro-Raman spectrum of As-rich florencite-(La).

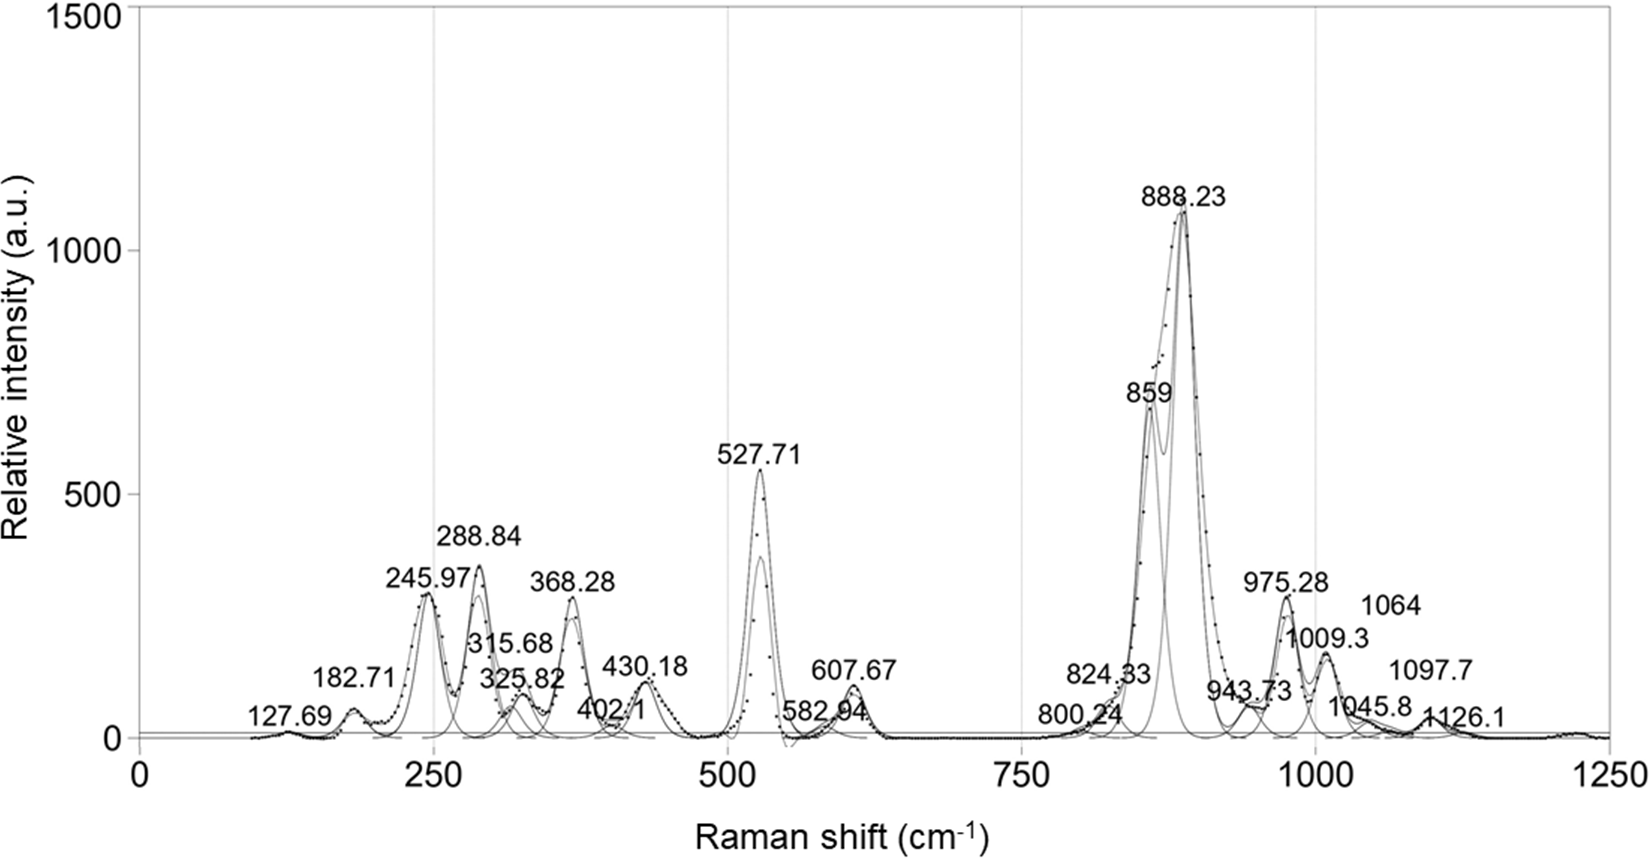
Raman spectrum of As-rich florencite-(La) in the 0–1250 cm–1 range, showing peak positions and relative intensities.

Figure 5 Long description
The x-axis is labeled, Raman shift (cm superscript minus 1), ranging from 0 to 1250. The y-axis is labeled, Relative intensity (a.u.), ranging from 0 to 1500. A single line trace is plotted with labeled peak positions. Labeled values along the trace include 127.69, 182.71, 245.97, 288.4, 315.68, 336.28, 352.82, 359.88, 403.18, 527.71, 607.67, 802.43, 824.83, 859, 888.23, 943.73, 975.28, 1007.9, 1064, 1107.8 and 1121.61. The highest labeled peak is at 888.23, rising above the 1000 mark on the y-axis. Another prominent peak is at 859, rising to a level below the 888.23 peak. A distinct peak is labeled at 527.71, rising to a level below the 500 mark on the y-axis. Smaller labeled peaks appear at 127.69, 182.71, 245.97, 288.4, 315.68, 336.28, 352.82, 359.88, 403.18, 607.67, 802.43, 824.83, 943.73, 975.28, 1007.9, 1064, 1107.8 and 1121.61.
The main Raman bands occur at 888, 859, 537, 289, 246, 368 and 975 cm–1, with secondary features at 180, 326, 430, 608, 824, 944, 1009 and 1098 cm–1. Compared to florencite-(La) spectra reported by Frost et al. (Reference Frost, Xi, Scholz and Tazava2013a) and Ghignone et al. (Reference Ghignone, Prencipe, Manzotti, Bruno, Boero, Borghini, Costa, Ciriotti and Scaramuzzo2023), the phosphate symmetric stretching band typically observed near 985–987 cm–1 appears at 975 cm–1 in this study. Arsenate-related bands were observed near 870–888 cm–1, while phosphate vibrations are evident between 975 and 1098 cm–1.
Note, bands at 859 cm–1 and 888 cm–1, attributed to arsenate ions, were not reported in previous florencite-(La) studies. Their presence in both analysed samples confirms arsenate incorporation in the crystal structure. Additional bands in this region may arise from (PO3OH)2– and (As3OH)2– groups in disordered tetrahedral sites, as proposed by Frost et al. (Reference Frost, Bahfenne, Cejka, Sejkora, Plasil, Palmer, Keeffe and Nemec2011, Reference Frost, Palmer, Xi, Cejka, Sejkora and Plasil2013b) and Biagioni et al. (Reference Biagioni, Ciriotti, Favreau, Mauro and Zaccarini2022). However, due to overlap with phosphate and arsenate bands, these features could not be resolved individually and would require infrared spectroscopy for further investigation.
Detailed Raman spectra in the 0–1250 cm–1 range are shown in Fig. 5. Minor shifts (up to 9 cm–1) between the two samples were observed, probably due to differences in crystal orientation. Although both samples showed similar band positions, intensity variations, particularly at 528, 888 and 975 cm–1, were noted. These cannot be attributed conclusively to compositional differences due to the non-orientated nature of the analysis.
Discussion and conclusions
Electron microprobe analyses and single-crystal X-ray diffraction confirm the occurrence of As-rich florencite-(La) as microscopic inclusions within euclase and quartz crystals from hydrothermal veins hosted in quartzitic layers of the Ouricuri do Ouro Formation, Abaíra County, Bahia, Brazil. Raman spectroscopy further supports this identification by revealing phosphate and arsenate vibrational bands consistent with a solid solution between florencite-(La) and arsenoflorencite-(La). Variations in As and P contents correlate with 〈T–O〉 bond lengths and unit-cell expansion, highlighting the structural sensitivity of the alunite supergroup to tetrahedral-site substitutions and the value of crystallographic data in tracing subtle chemical variations in REE-bearing minerals.
The role of hydrogen species in the structure is particularly noteworthy. Charge-balance calculations indicate only structural hydroxyls, yet Raman spectra display weak H2O-related features, suggesting partial hydration undetectable by EPMA. The absence of a clear Raman band near 1600 cm–1 and the broad OH-stretching envelope imply that molecular H2O is weakly bound or structurally disordered, reflecting variable hydrogen-bonding environments during crystal growth. This apparent discrepancy agrees with the long-recognised ambiguity in hydrogen bonding within the alunite supergroup, where partial proton occupancy and secondary hydrogen-bonding schemes, discussed by Blount (Reference Blount1974) and Mills et al. (Reference Mills, Kartashov, Kampf and Raudsepp2010), have been invoked to satisfy bond-valence requirements.
The marked REE fractionation recorded in these inclusions probably resulted from late-stage hydrothermal fluids under oxidising conditions. Partial oxidation of Ce3+ to Ce3+ would have stabilised immobile phosphate and fluoride complexes, favouring La-rich phase formation. Similar redox-controlled fractionation was reported for parisite-(La) by Menezes Filho et al. (Reference Menezes Filho, Chaves, Chukanov, Atencio, Scholz, Pekov, da Costa, Morrison, Andrade, Freitas, Downs and Belakovskiy2018) in the Novo Horizonte region, ∼80 km to the north-northwest, suggesting a regional hydrothermal control. Acidic, moderately saline fluids probably enhanced light-REE solubility, leading to La enrichment and precipitation of florencite-(La) at moderate temperatures (200–400°C) and low pressures. Raman evidence for minor water supports a fluid-assisted crystallisation mechanism for this solid solution.
Collectively, the chemical, structural, and spectroscopic data demonstrate that As-rich florencite-(La) is a sensitive tracer of oxidised, REE-enriched hydrothermal systems. Its occurrence as minute inclusions in euclase and quartz records crystallisation from La-dominant fluids under moderate temperatures and oxidising conditions. These findings extend the known stability field of the florencite group beyond supergene environments and underline its potential as a proxy for redox evolution, fluid–rock interaction, and rare-earth fractionation in hydrothermal systems.
Supplementary material
The supplementary material for this article can be found at https://doi.org/10.1180/mgm.2025.10180.
Acknowledgements
The authors express their gratitude to Susan Martins Drago M.Sc. (Instituto de Geociências, Universidade Federal do Rio Grande do Sul – UFRGS) for conducting the electron probe microanalyses and for her valuable insights. They also acknowledge CETEM, particularly the LMCT and LAPEGE laboratories, for their analytical support and contributions to discussion of the results. Financial support from the Brazilian Ministry of Science, Technology and Innovation (MCTI) and the National Council for Scientific and Technological Development (CNPq) is gratefully acknowledged.
Competing interests
The authors declare none.