INTRODUCTION
Photosynthetic picoplankton (Pico, ≤2 µm diameter), the smallest component of photosynthetic organisms, has been found to be of great importance in a variety of oceanic provinces (e.g. Olson et al., Reference Olson, Chisholm, Zettler, Altabet and Dusenberry1990; Partensky et al., Reference Partensky, Hess and Vaulot1999; Chiang et al., Reference Chiang, Kuo, Chang, Wang and Gong2002; Moore et al., Reference Moore, Post, Rocap and Chisholm2002; Jiao et al., Reference Jiao, Yang, Hong, Ma, Harada, Koshikawa and Watanabe2005). At least 3 groups of photosynthetic picoplankton can be categorized in unstained samples as Prochlorococcus (Pro), Synechococcus (Syn) and picoeukaryotes (Euk) by flow cytometry (Marie et al., Reference Marie, Simon, Vaulot and Andersen2005). Prochlorococcus and Syn are the marine prokaryotic autotrophic Cyanobacteria widespread from the oligotrophic ocean waters to the eutrophic coastal waters and estuaries. Their abundances cover a wide range, from 103 to 107 cells/ml, and they contribute significantly to the cycles of carbon and the energy flow in marine ecosystems. Synechococcus, discovered in 1979 (Johnson & Sieburth, Reference Johnson and Sieburth1979; Waterbury et al., Reference Waterbury, Watson, Guillard and Brand1979), was regarded as the most abundant marine autotroph until the discovery of Pro in 1988 (Chisholm et al., Reference Chisholm, Olson, Zettler, Goericke, Waterbury and Welschmeyer1988). Prochlorococcus is a widely distributed bacterial-sized, divinyl chlorophyll containing photoautotroph. The discovery of Pro has greatly enhanced the understanding of marine ecosystem functions (Chisholm et al., Reference Chisholm, Olson, Zettler, Goericke, Waterbury and Welschmeyer1988; Fuhrman & Campbell, Reference Fuhrman and Campbell1998; Jiao et al., Reference Jiao2006).
The Pearl River, flowing south into the South China Sea (SCS), has the second largest runoff in China. The four eastern-most distributaries, namely, Humen, Jiaomen, Hongqili and Hengmen, discharge their waters into the Lingdingyang Bay of the Pearl River Estuary (PRE). The average annual discharge through the PRE is about 5300 m3 s−1, about 53% of the total discharge of the Pearl River. The PRE is located along a micro-tidal coast with an average tidal range of about only 1 m. The combined effect of the small tidal range and large bay area has generated an interesting circulation and plume behaviour in the PRE. During the north-east monsoon (from October to April), the circulation pattern is transformed from the river plume (confined to the eastern shore of PRE) to the coastal current in the middle reach of the PRE because of the relatively low river discharge (Su, Reference Su2004; Dong et al., Reference Dong, Su, Wong, Cao and Chen2004). In the wet season, the salinity varies from 1 to 34.5 in the PRE, but the temperature varies only between 21°C and 31°C. Temperatures below 27°C occur only in the deep water outside the river mouth. In the dry season, the salinity varies from 3 to 32 in the PRE, while the corresponding temperature varies only from 18°C to 19°C. Nutrients also show spatial heterogeneity. For phytoplankton, nutrient limitation shifts across the coastal plume from P limitation in the estuary to N limitation in the oceanic waters. Potential P limitation was observed in the estuary, P and Si co-limiting occurred at the edge of the coastal plume, and N was limiting in the oceanic side in summer (Yin et al., Reference Yin, Qian, Wu, Chen, Huang, Song and Jian2001).
With the rapid economic development in the Pearl River Delta, the estuarine ecosystem is under strong anthropogenic impact. The nitrogen input from the Pearl River has increased up to 4-fold since the 1950s. However, little is known about the community dynamics of Pico in the PRE and the adjacent waters. Few studies have ever focused on the response of Pico along the environmental gradient related to anthropogenic stress and a natural gradient from the inner estuary to the open waters. In this paper, the relationship between the spatial distribution of the three groups of Pico and the environmental conditions was analysed, and the possible dynamic mechanisms were discussed.
MATERIALS AND METHODS
Description of the study area
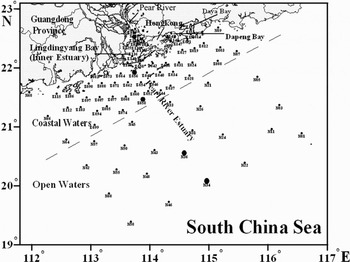
The investigation was carried out at 92 stations from December 2006 to January 2007 (Figure 1). The investigated area can be divided into 3 parts (Figure 1): the inner estuary (mainly the Lingdingyang Bay, with 16 stations); the coastal waters (depth ≤60 m in most of the area, with 54 stations); and the open waters (depth ≥70 m in most of the area, with 22 stations). Transect 1 (consisting of 5 stations: Z122, Z056, Z05, N36 and N34) extends from the inner estuary to the open waters perpendicular to the isobaths.
Distribution of the investigation stations in the inner estuary, coastal and open waters of Pearl River Estuary. Stations along the Transect 1 are indicated by the large solid circles, and the other stations are indicated by the small solid circles.

Sample collection and flow cytometry measurement
Water samples were collected at depths of 0.5 m, 10 m, 30 m, and bottom layer (2 m off the bottom) using van Dorn samplers. Triplicate samples from each depth at all stations were fixed with paraformaldehyde (final concentration of 1%), quick-frozen and stored in liquid nitrogen on board and transported to the freezer (–80°C, Thermos) in the laboratory until analysis. Samples were analysed with a FACSCalibur flow cytometer (Becton-Dickinson) equipped with an air-cooled argon laser (488 nm, 15 mW). We followed the procedures described by Marie et al. (Reference Marie, Simon, Vaulot and Andersen2005). Forward light scatter, side light scatter, green fluorescence (FL1), orange fluorescence (FL2) and red fluorescence (FL3) were recorded for each particle in the samples, and the data obtained were processed with CELLQuest software (Becton-Dickinson). YG fluoresbrite microspheres (diameter: 0.994 µm, Polysciences) were added to each sample as a basis for normalizing fluorescence signals. Prochlorococcus, Syn and Euk were distinguished according to their specific autofluorescence properties and differences in light scatter (Matsumoto et al., Reference Matsumoto, Furuya and Kawano2004; Marie et al., Reference Marie, Simon, Vaulot and Andersen2005; Pitta et al., Reference Pitta, Stambler, Tanaka, Zohary, Tselepides and Rassoulzadegan2005).
Temperature, salinity and dissolved oxygen (DO) were recorded in the water column using a SBE 911plus CTD (Sea-Bird) and the pH was measured using a PHS-3C pH instrument (LeiCi, Shanghai). Samples for nutrients—including total nitrogen (TN), total dissolved nitrogen (TDN), nitrate (NO3), nitrite (NO2), ammonium (NH4), total phosphorous (TP), total dissolved phosphorus (TDP), phosphate (PO43) and silicic acid (SiO32)—were analysed with QuikChem 8500 automatic flow injection analyser (Lachat, USA) in the laboratory. Suspended sediment concentration (SSC) was analysed by a gravimetric method using BS110S analytical balance (Sartorius, Germany) in the laboratory.
Statistical analysis
The data were analysed using the SPSS 11.0 software (SPSS Inc.). Pearson correlations between cell abundances of 3 groups of Pico and environmental factors were calculated. The stations were ordinated based on their environmental factors with principal component analysis. Correlation matrix was used since the environmental factors have different measurement units.
Various regression functions such as Multiple Linear, Compound, Growth, Logarithmic, Cubic, S Curve, Exponential, Inverse, Power and Logistic, using principal components as the independent variables and cell abundances of 3 groups of Pico or their proportions as dependent variables were carried out. The functions with maximum R2 values were selected.
RESULTS
Physical and chemical conditions
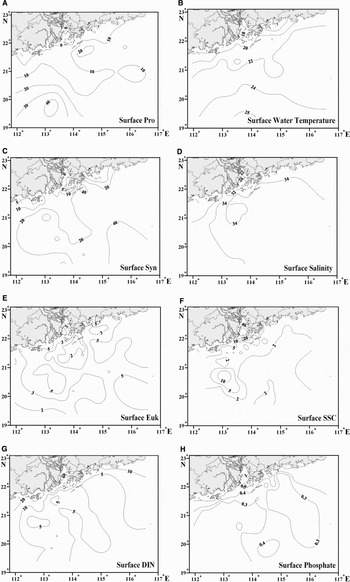
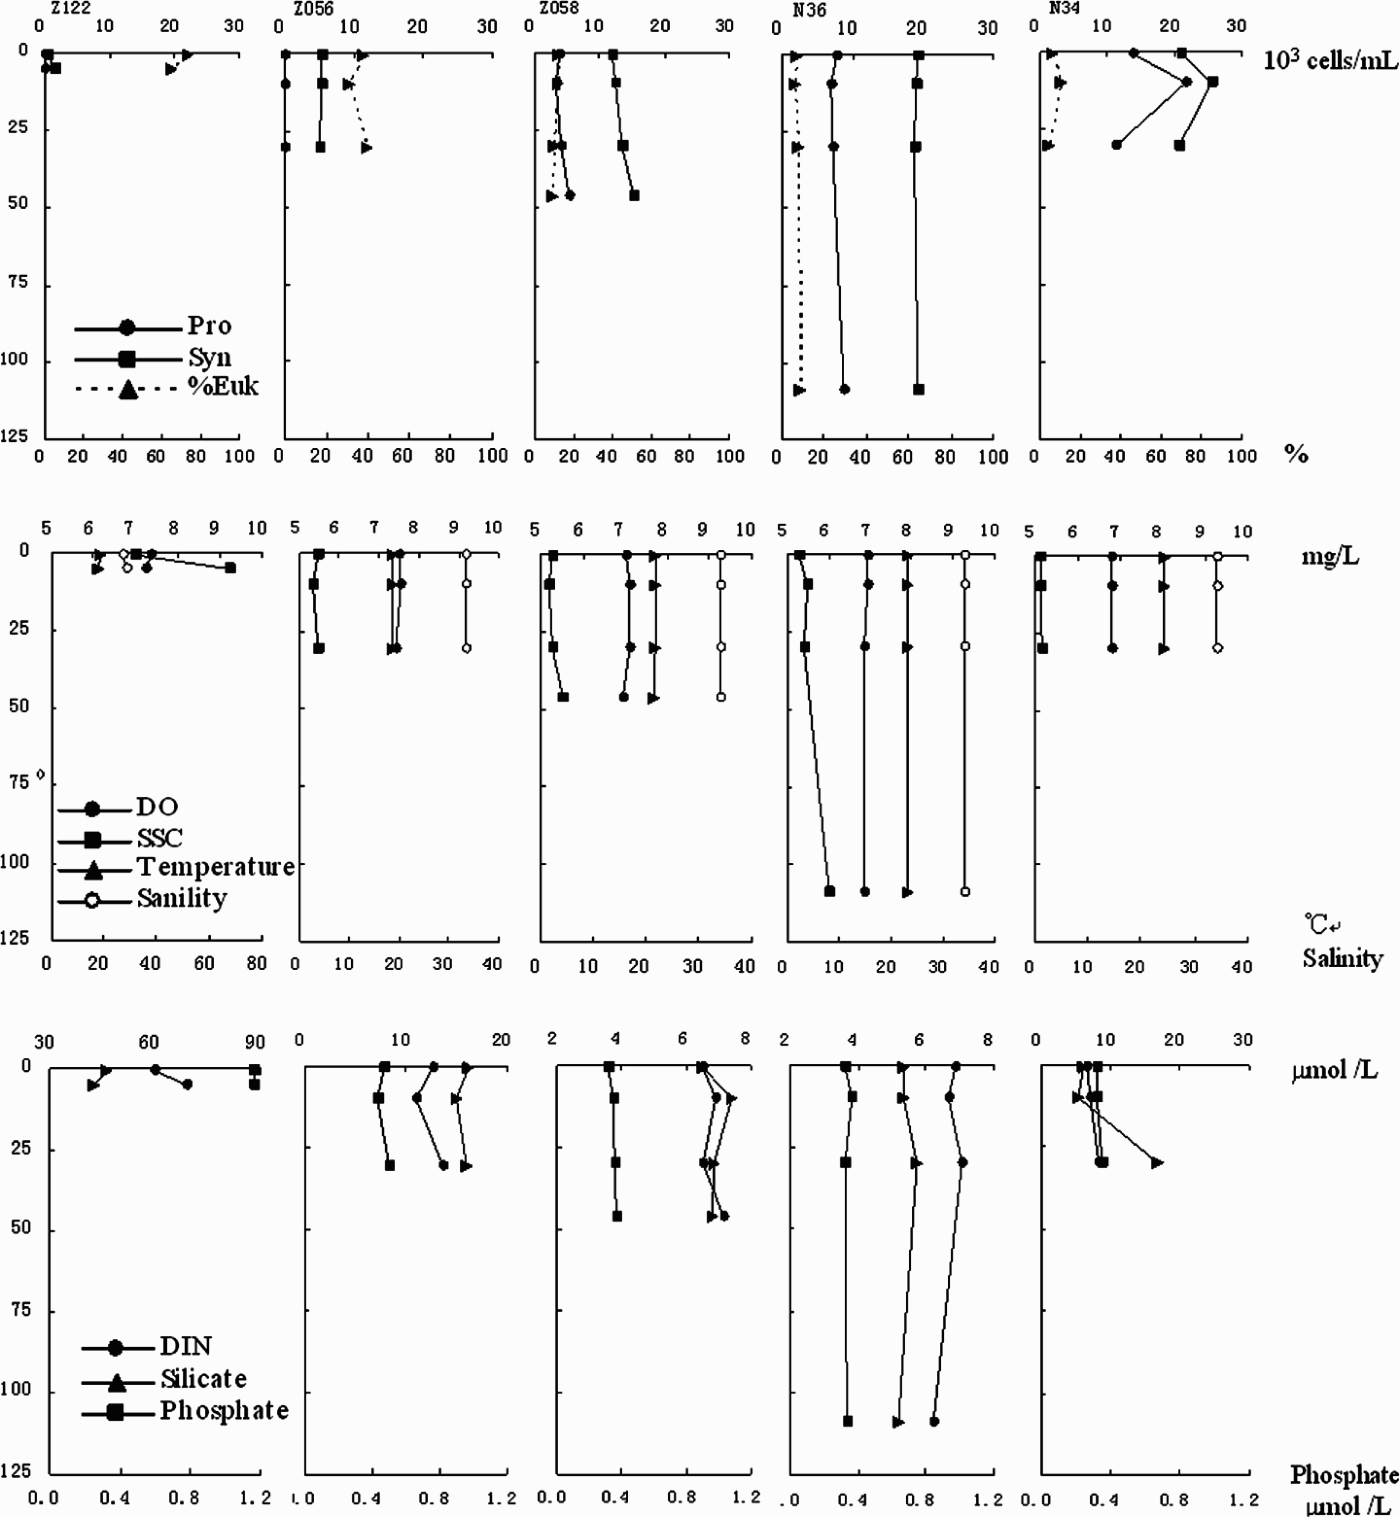
The average concentrations of TDN, TDP, dissolved inorganic nitrogen (DIN, NO3+ NO2+ NH4) and PO43 in the inner estuary were higher than those in the coastal and open waters (Figures 2 & 3). The average concentrations of surface NO3, NO2 and NH4 were respectively 27.1, 5.5 and 11.8 µmol/l in the inner estuary, 6.9, 0.90 and 1.1 in the coastal waters, and 4.2, 0.43 and 0.79 µmol/l in the open waters. The concentration of PO43 also decreased offshore, and the average surface concentrations of PO43 in the inner estuary, coastal and open waters were respectively 0.98, 0.39 and 0.30 µmol/l (Figures 2 & 3). The water temperature increased from the inner estuary to the open waters, with average values of 18.4°C, 20.0°C and 23.3°C, respectively. The salinity also increased outwards, with average values of 28.6, 33.4 and 34.2, respectively. The SSC in the inner estuary was much higher than in the coastal and open waters, with average values of 30.0, 4.5 and 3.0 mg/l, respectively. The pH increased from the inner estuary to the open waters, with smaller variations in the open waters. The average pH of the surface waters in the inner estuary, coastal and open waters was 8.01, 8.23 and 8.26, respectively. The DO was higher in the coastal waters (7.46 mg/l) than in the inner estuary (7.21 mg/l) and open waters (6.89 mg/l), with higher fluctuations in the coastal waters. The vertical variations of the temperature, salinity, DO, SSC, DIN, PO43 and SiO32 were not significant in the inner estuary and coastal waters (Figure 4).
Distribution of the surface cell abundance of Pro, Syn, Euk and the surface water temperature, salinity, SSC, DIN, PO43 (cell abundance, 103 cells/ml; temperature, °C; SSC, mg/l; concentration of DIN and PO43, μmol/l).

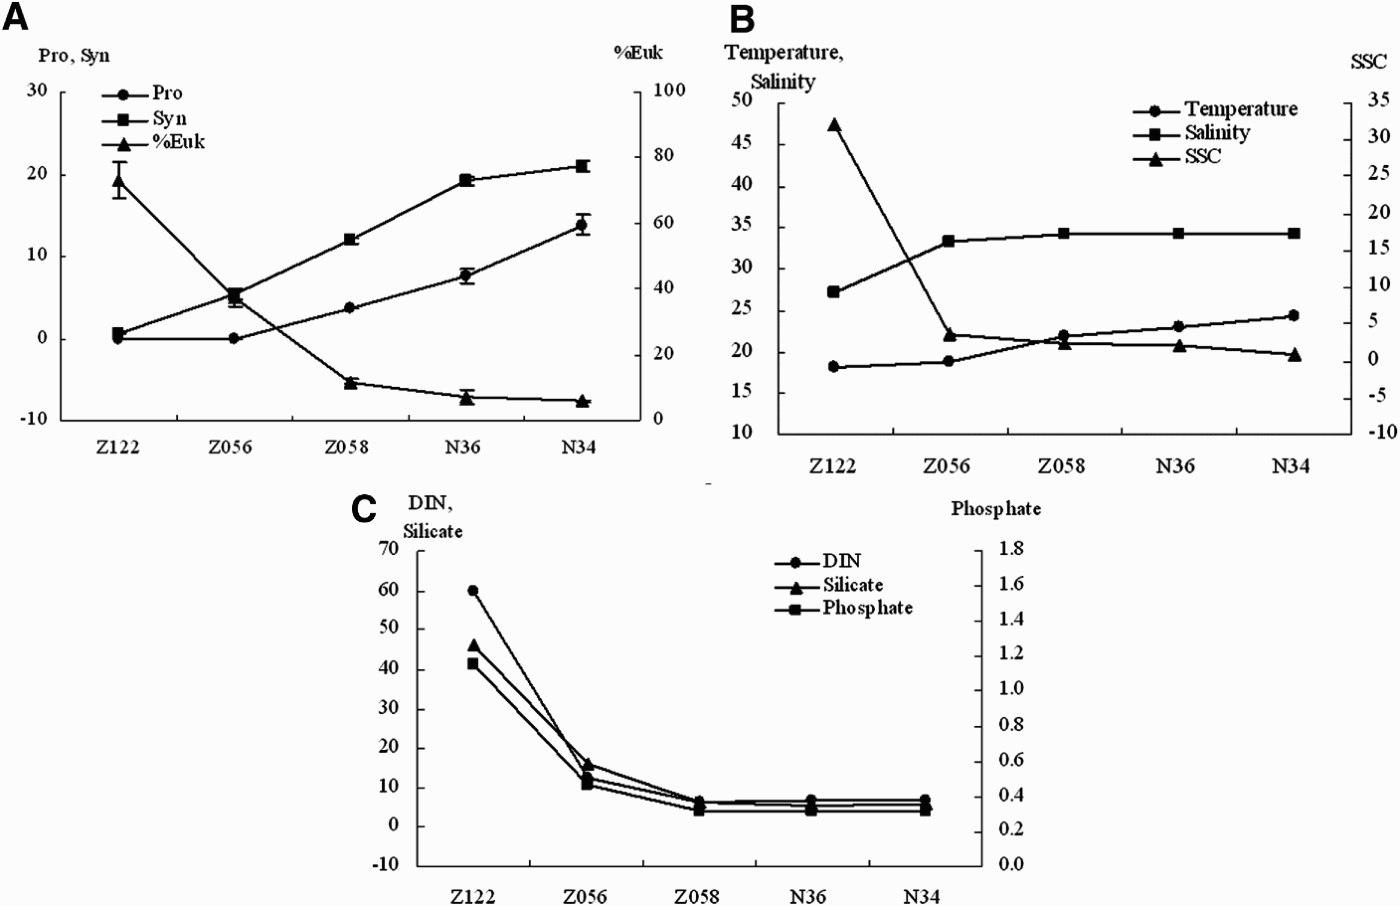
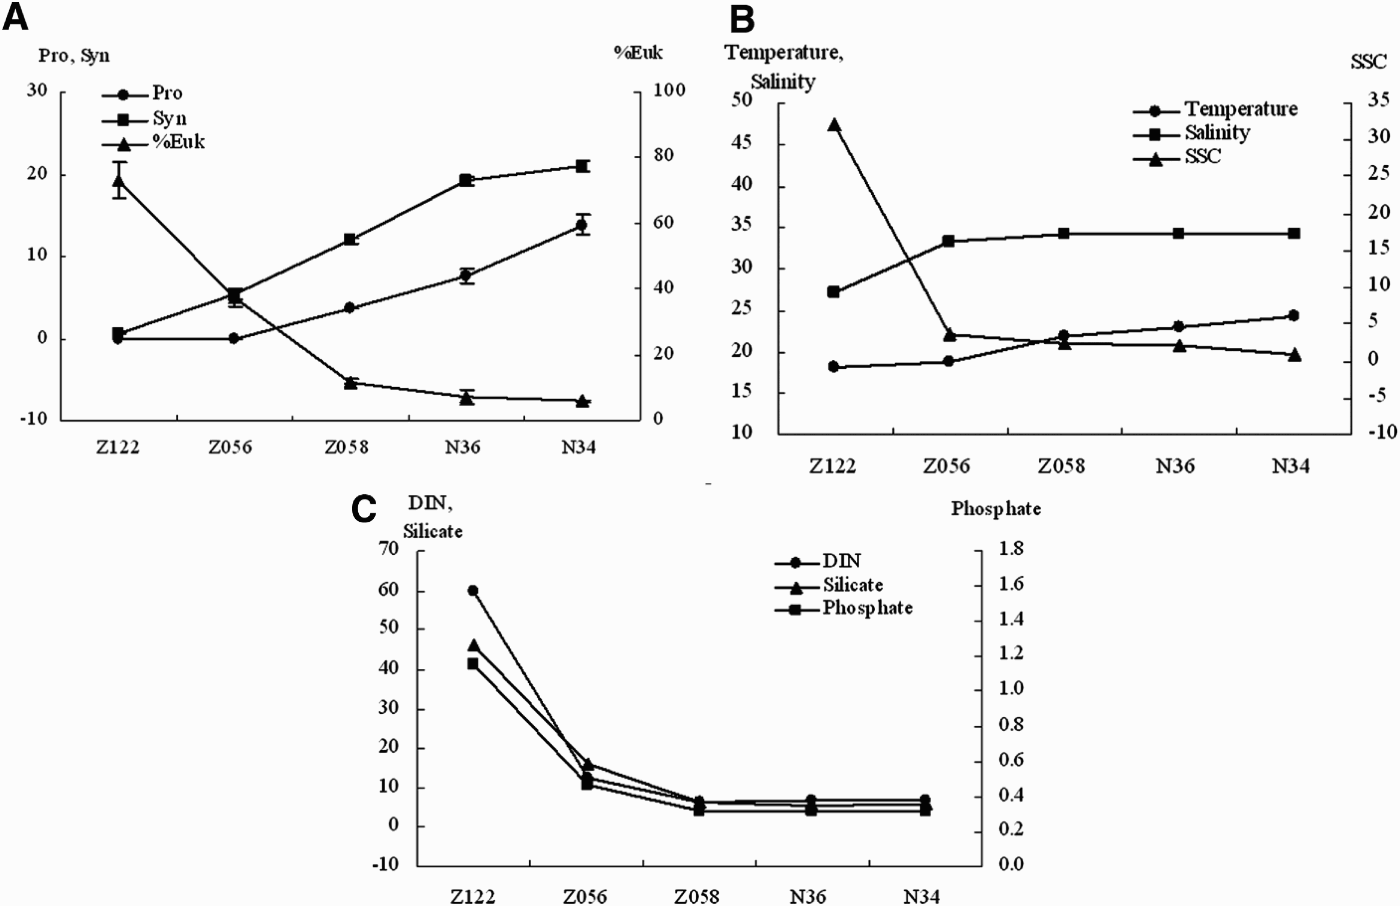
The cell abundance of Pro and Syn, abundance contribution of Euk (%Euk), and the surface temperature, salinity, SSC and nutrients along Transect 1 (cell abundance, 103 cells/ml; %Euk, %; temperature, °C; SSC, mg/l; DIN, PO43 and SiO32, μmol/l). Error bars represent standard deviations.
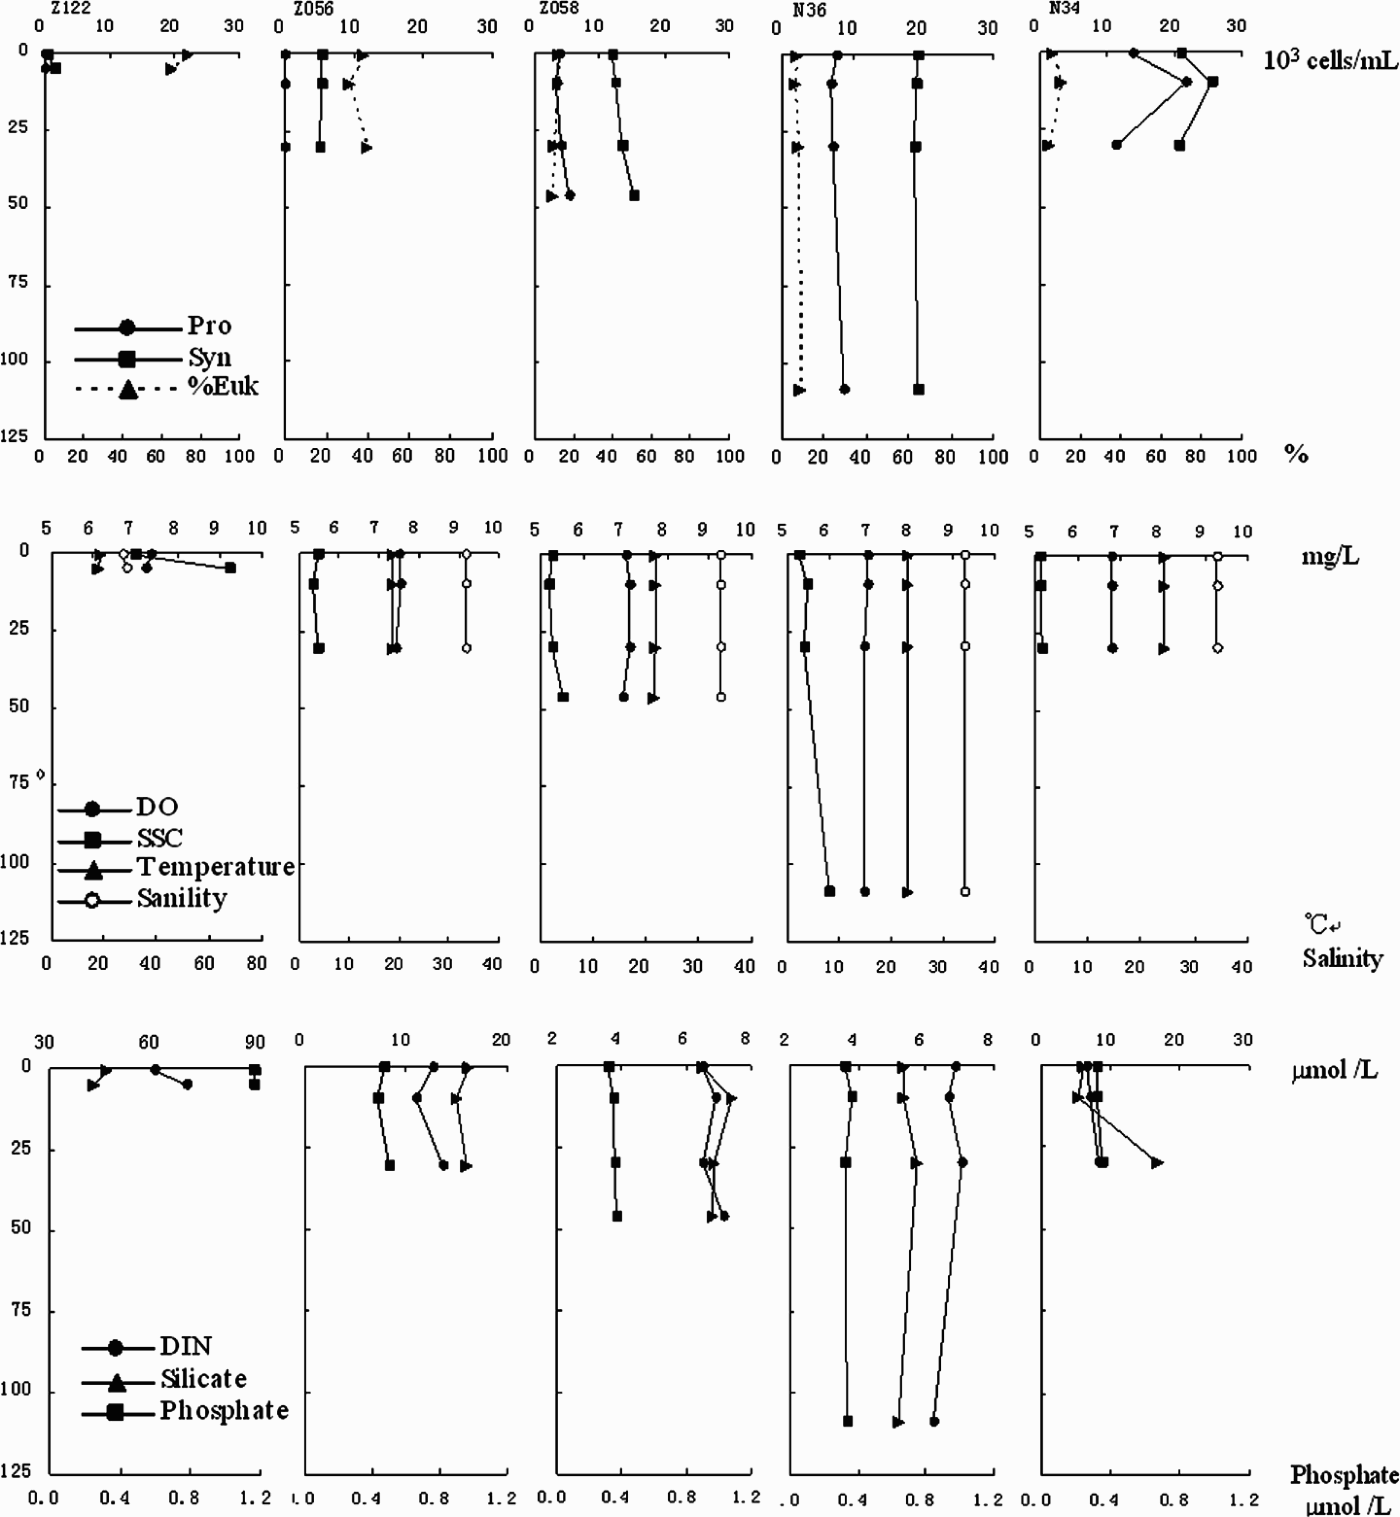
Vertical variation of cell abundance of Pro and Syn, %Euk, temperature, salinity, DO, SSC and nutrients along Transect 1. Water depth of the bottom layer at Station N34 is 503 m, far deeper than the euphotic zone and no Pico cell was found there.
Abundance and community structure of Pico
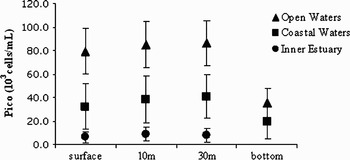
The average abundance of Pico decreased from the open waters to the inner estuary. However, within the stations, the vertical variation was not significant in the inner estuary and coastal waters, but the abundances were relatively low at the bottom layer in the open waters (Figure 5).
Average abundances of Pico in the inner estuary, coastal waters and open waters. Error bars represent standard deviations. Data of the inner estuary at 30 m on the x-axis were the average abundance of Pico in the bottom layer. Because of the disappearance of Pro in the bottom layer at the 7 stations in the open waters with the depth between 263 m and 835 m (below the euphotic zone), we excluded these stations when calculating the average abundance of Pro in the bottom layer for the open waters.

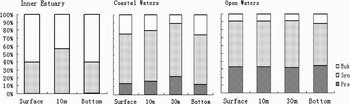
The abundances of Pro and Syn at the surface increased offshore, while the abundance of Euk was higher in the coastal waters than that in the inner estuary and the open waters (Figure 2). In the inner estuary, %Euk (as of total Pico) was the highest among the 3 groups of Pico (Figure 6). The maximum %Syn occurred at the 10 m layer, while Pro nearly disappeared in the inner estuary (Figure 6). Synechococcus was the dominant group in the coastal and open waters, the average %Syn was higher than 50% and their vertical variation was not significant. The average % Pro was the highest in the open waters (>30%), and was about 16% in the coastal waters. In the open waters, the maximum %Euk was observed at the surface and the bottom, and the minimum was at the 30 m layer.
Community structure of Pico in the inner estuary, the coastal waters and the open waters.

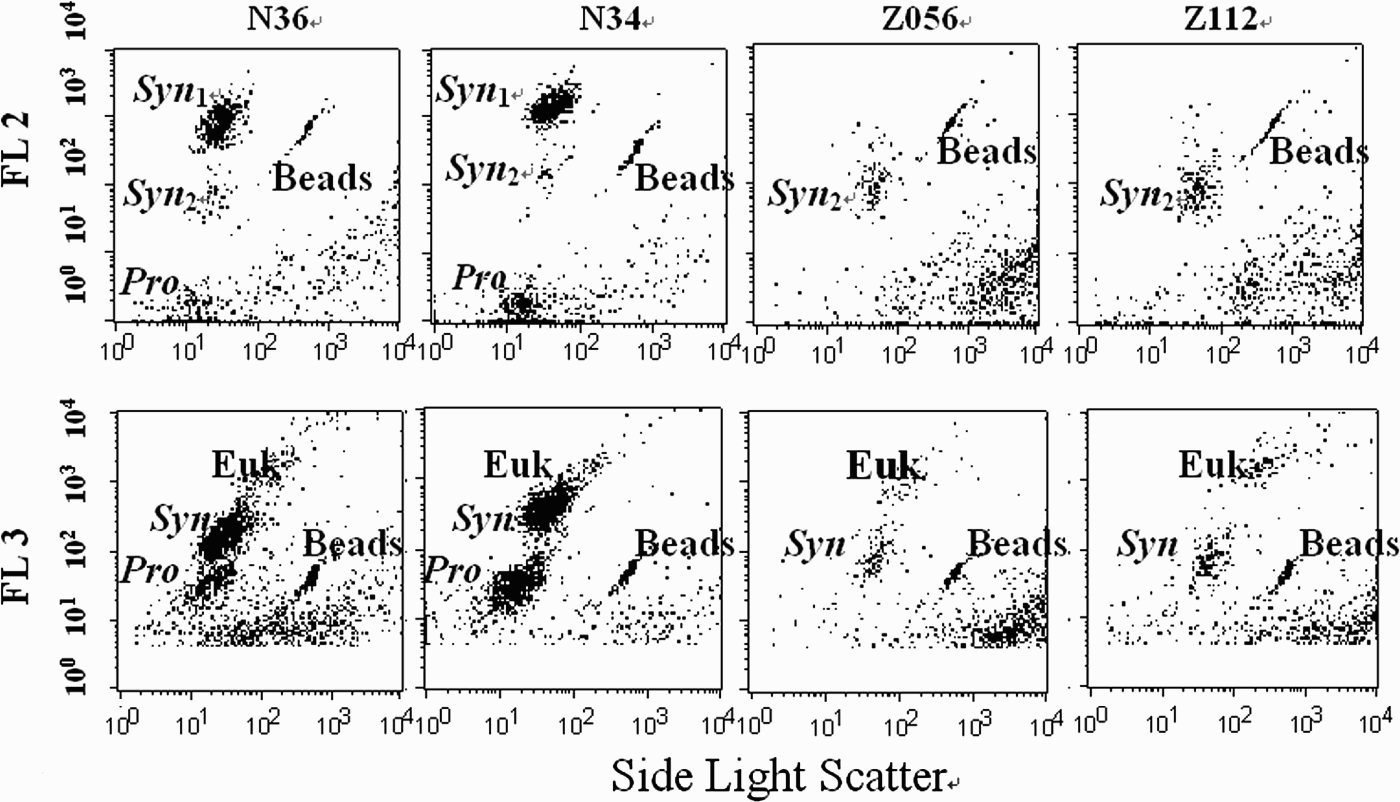
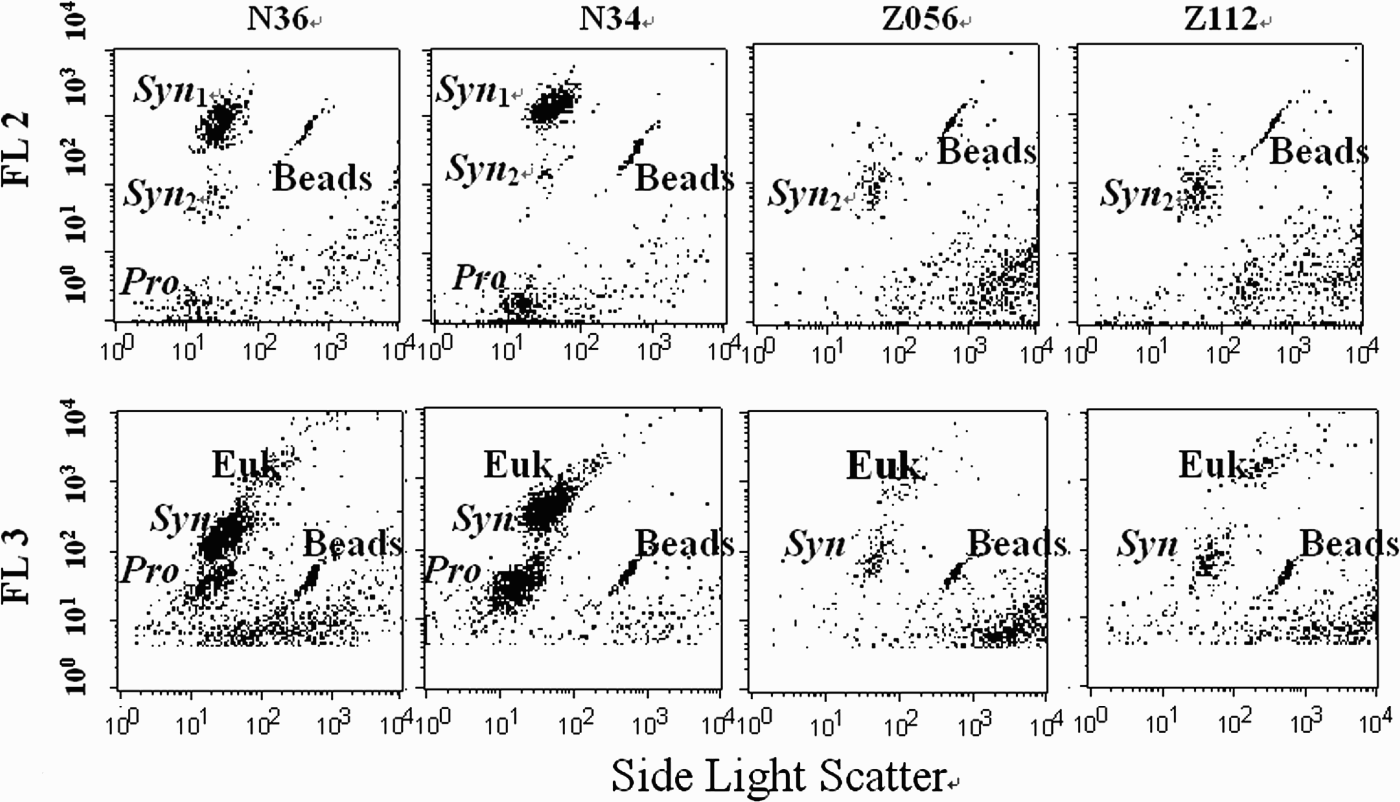
The cell abundances of Pro and Syn at the surface along Transect 1 showed an increasing trend from the inner estuary to the open waters, while %Euk decreased outwards (Figure 3). The vertical variation of cell abundances of Pro and Syn, %Euk and environmental factors were not significant (Figure 4). At the surface of open water stations along Transect 1, the high phycourobilin (PUB) to phycoerythrobilin (PEB) ratio strain and the low PUB/PEB ratio strain of Syn co-existed and the former was dominant (Figure 7; Stations N36 and N34). But in the inner estuary and the coastal waters, there was no high PUB/PEB ratio strain observed (Figure 7; Stations Z056 and Z112).
Flow cytometric analysis from the surface water along the Transect 1 at Stations N36, N34, Z056 and Z112. FL 2 features phycoerythrin (PE), and FL 3 features chlorophyll. Distribution of the high and low PUB/PEB ratio Syn strains (Syn 1 and Syn 2) are also shown (Jiao et al., Reference Jiao, Yang, Hong, Ma, Harada, Koshikawa and Watanabe2005). Beads: 0.994 µm YG fluoresbrite microspheres.
Relationship between Pico abundance and environmental factors
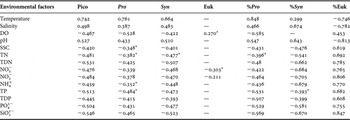
Surface cell abundances of Pico, Pro and Syn, %Pro and %Syn were positively correlated (P < 0.01) with temperature, salinity and pH (Table 1), whereas they had significant negative correlations with DO, SSC and nutrients. The correlations between Euk abundance and environmental factors were not as significant as Pro and Syn. However, %Euk had significant negative correlations with temperature, salinity and pH, and had significant positive correlations with DO, SSC and nutrients. The relationships between cell abundances of prokaryotic cells (Pro and Syn) and environmental factors were opposite to those between %Euk and environmental factors.
Pearson correlations1 between the environmental factors and absolute and relative cell abundance of Pico, Pro, Syn, and Euk2.

1 P < 0.001, N = 92 (except that the sample sizes of both ‘TN’ and ‘TP’ were N = 46); except * indicated P < 0.01 and — indicated the correlation was not significant (P > 0.01);
2 cell abundance, 103 cells/ml; %Euk,%; temperature, °C; DO, SSC, mg /l, nutrients, μmol/l.
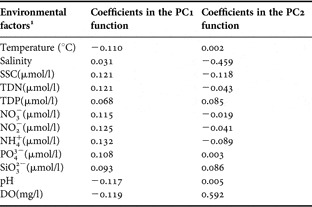
All the environmental factors (original variables) listed in Table 1 were entered into a principal component analysis. The first two principal components (Table 2) accounted for 84.6% of the total variance. The first component (PC1, accounted for 68.5 of the total variance) was mainly contributed by nutrients (positive), pH (negative), DO (–) and temperature (–) (Table 2), which indicated anthropogenic as well as natural influences in the PRE. The second component (PC2) mainly contributed by salinity (+) and DO (−) (Table 2).
Component score coefficient (eigenvectors) matrix for the study area.

1 ‘TN’ and ‘TP’ were excluded because they were only analysed at 46 stations and other factors were all recorded at the 92 stations.
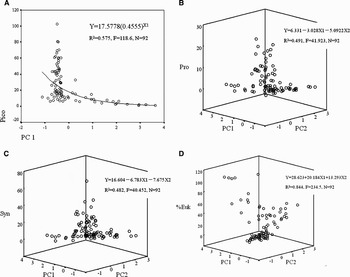
The regression analysis indicated that the relationship between the abundances of Pico and the environmental factors was a compound function (y = b0(b1)x) (Figure 8; Pico). All the changing trends of Pro abundances, Syn abundances and %Euk with environmental factors can be expressed by linear equations (Figure 8). The regression curve of total cell abundance of Pico was different from that for each group of Pico. The regressions indicated that the relationship between Pico and the environmental factors was complex (Figure 8). On the other hand, the differences of the coefficients between the equations of %Euk and prokaryotic cells (Pro and Syn) indicated that the effects of environmental factors on Euk were opposite to those on the prokaryotic cells.
Relationship between environmental factors and cell abundances of Pico, Pro, Syn (103cells/ml) and %Euk (%). X1 = PC1; X2 = PC2.

DISCUSSION
Dynamics of Pico
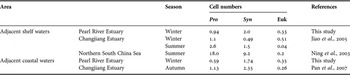
The seawater temperature in the PRE and its adjacent waters is higher than that in the Changjiang Estuary (a temperate estuary) (Jiao et al., Reference Jiao, Yang, Hong, Ma, Harada, Koshikawa and Watanabe2005; this study). But the concentrations of DIN and PO43 in the adjacent shelf waters of the PRE (6.3 µmol/l and 0.38 µmol/l respectively, Figures 2, 4 & 6) are similar to those in the Changjiang Estuary adjacent shelf waters (5.1 µmol/l and 0.37 µmol/l respectively; Jiao et al., Reference Jiao, Yang, Hong, Ma, Harada, Koshikawa and Watanabe2005). Thus it seems that the seawater temperature may be one of the major factors influencing the Pico abundance (Table 3) between the two estuaries (Jiao et al., Reference Jiao, Yang, Hong, Ma, Harada, Koshikawa and Watanabe2005; this study). Photosynthetic picoplankon was reported to be phosphorus limited in the Red Sea and Hiroshima Bay (Lee et al., Reference Lee, Seiki, Mukai, Takimoto and Okada1996; Li et al., Reference Li, Veldhuis and Post1996; Fuller et al., Reference Fuller, West, Marie, Yallop, Rivlin, Post and Scanlan2005). In the PRE, nutrients are rich due to the vertical mixing in winter and the serious eutrophication impacts on the inner estuary due to the low river discharge during the dry season (Harrison et al., Reference Harrison, Yin, Lee, Gan and Liu2008). The nutrient limitation to total Pico was not found in this study. Depth of the nitrate-cline was considered to be one of the factors affecting the vertical distribution of Pico. In summer, the depth of nitrate-cline affecting the vertical distribution of Pico in the northern SCS was about 50–100 m (Ning et al., Reference Ning, Cai, Li and Shi2003). The hydrographic data from the same cruise (reports of the National Project of Coastal Ocean Investigation and Assessment, SOA, 2007) show that the vertical mixing caused by the north-east monsoon in the investigated area was strong. The thermocline (more than 100 m depth) only existed in open waters below the depth of 200 m. The diffusion of the Pearl River diluted water was limited in the PRE that is less than 30 m in dpeth, and the halocline and pycnocline were not found in the shelf area. No effect of nitrate-cline was recorded in this study.
Abundances (×104 cells/ml) of 3 groups of Pico in the Pearl River Estuary and the Changjiang Estuary and their adjacent waters.

Prochlorococcus was absent in the inner estuary and the abundance of Pro increased offshore (Figures 2 & 6), which is similar to the previous findings in offshore oligotrophic regions (Campbell et al., Reference Campbell, Nolla and Vaulot1994; Buck et al., Reference Buck, Chavez and Campbell1996; Campbell et al., Reference Campbell, Landry, Constantinou, Nolla, Brown, Liu and Caron1998; Zubkov et al., Reference Zubkov, Sleigh, Tarran, Burkill and Leakey1998; Partensky et al., Reference Partensky, Hess and Vaulot1999; Pöder et al., Reference Põder, Maestrini, Balode, Lips, Béchemin, Andrushaitis and Purina2003; Jiao et al., Reference Jiao, Yang, Hong, Ma, Harada, Koshikawa and Watanabe2005; Pan et al., Reference Pan, Zhang, Zhang, Gasol and Chao2005, Reference Pan, Zhang and Zhang2007). Temperature is reported to be crucial to Pro (Olson et al., Reference Olson, Chisholm, Zettler, Altabet and Dusenberry1990; Moore et al., Reference Moore, Georicke and Chisholm1995; Campbell et al., Reference Cavender-Bares, Mann, Chisholm, Ondrusek and Bidigare1998; Jiao et al., Reference Jiao, Yang, Hong, Ma, Harada, Koshikawa and Watanabe2005). The maximum cell numbers of Pro were often found in areas with temperature between 26°C and 29°C (Partensky et al., Reference Partensky, Hess and Vaulot1999; Pan et al., Reference Pan, Zhang, Zhang, Gasol and Chao2005; Pan et al., Reference Pan, Zhang and Zhang2007). In this study, the maximum water temperature in the open waters was 25.3°C. %Pro exceeded %Syn only at Stations N58 and N60 (south-western part of the open water area; Figure 1) controlled by oceanic waters with high temperatures (the maximum surface water temperature was recorded at Station N58; Figure 2) and low SSC (<0.3 mg/l; Figure 2). The maximum %Pro of 77.7% was also recorded at Station N58 (30 m layer). In summer, the average %Pro in the open waters in the northern SCS could reach 90% while the average %Syn was only 8.7% (Ning et al., Reference Ning, Cai, Li and Shi2003). Prochlorococcus may be absent in the low-salinity waters (Chisholm et al., Reference Chisholm, Frankel, Goericke, Olson, Palenik, Waterbury, West-Johnsrud and Zettler1992; Chiang et al., Reference Chiang, Kuo, Chang, Wang and Gong2002; Jiao et al., Reference Jiao, Yang, Hong, Ma, Harada, Koshikawa and Watanabe2005; Pan et al., Reference Pan, Zhang, Zhang, Gasol and Chao2005, Reference Pan, Zhang and Zhang2007). In the PRE, the north-east monsoon winds in winter drive a south-eastward coastal current and the salinity in the inner estuary seldom reaches 32, even though river discharge is greatly reduced (Harrison et al., Reference Harrison, Yin, Lee, Gan and Liu2008). The present study recorded the low end surface water temperature and salinity of 17.8 and 31.9, respectively. These boundaries are comparable with those in the Changjiang Estuary and the East China Sea shelf (Jiao et al., Reference Jiao, Yang, Hong, Ma, Harada, Koshikawa and Watanabe2005; Pan et al., Reference Pan, Zhang, Zhang, Gasol and Chao2005, Reference Pan, Zhang and Zhang2007). Nutrients have been suggested to be playing a role in the distribution of Pro (Blanchot et al., Reference Blanchot, Rodier and Le Bouteiller1992; Campbell & Vaulot, Reference Campbell and Vaulot1993; Campbell et al., Reference Campbell, Landry, Constantinou, Nolla, Brown, Liu and Caron1998; Pan et al., Reference Pan, Zhang and Zhang2007). In the PRE and its adjacent waters, the nutrient limitation to Pro was not found. Prochlorococcus uses NO2 and urea as the nitrogen source, thus they are seldom limited by NO3 (Moore et al., Reference Moore, Post, Rocap and Chisholm2002; Pöder et al., Reference Põder, Maestrini, Balode, Lips, Béchemin, Andrushaitis and Purina2003). The strong competitive ability of Pro at low nutrient concentrations may reflect its lower cell quota for nutrients and higher surface-to-volume ratio (Cavender-Bares et al., Reference Cavender-Bares, Mann, Chisholm, Ondrusek and Bidigare1999; Pan et al., Reference Pan, Zhang and Zhang2007). In this study, the high boundary SSC for Pro was present at 9.5 mg/l, which was much lower than that in the Changjiang River estuary (72 mg/l; Pan et al., Reference Pan, Zhang and Zhang2007). Such difference might be a result of combined effect of other environmental factors such as low temperature and high nutrient level in the areas with SSC higher than 9.5 mg/l in the PRE in winter.
Compared with Pro, Syn is reported to be more nutrient-dependent and usually more abundant in winter when mixing enhances the availability of nutrients in the euphotic zone (Olson et al., Reference Olson, Chisholm, Zettler, Altabet and Dusenberry1990; Blanchot et al., Reference Blanchot, Rodier and Le Bouteiller1992; Campbell & Vaulot, Reference Campbell and Vaulot1993; Campbell et al., Reference Campbell, Liu, Nolla and Vaulot1997; Michele et al., Reference Michele, Olson and Chisholm2001; Jiao et al., Reference Jiao, Yang, Hong, Ma, Harada, Koshikawa and Watanabe2005). As a euryhaline group of Pico, Syn is more important in mesotrophic or coastal regions (Olson et al., Reference Olson, Chisholm, Zettler and Armbrust1988; Bustillos-Guzman et al., Reference Bustillos-Guzman, Claustre and Marty1995; Campbell et al., Reference Cavender-Bares, Mann, Chisholm, Ondrusek and Bidigare1998; Zubkov et al., Reference Zubkov, Sleigh, Tarran, Burkill and Leakey1998; Pan et al., Reference Pan, Zhang, Zhang, Gasol and Chao2005, Reference Pan, Zhang and Zhang2007). We also found in the present study that Syn dominated in the coastal and open waters (Figures 2 & 6). The abundance of Syn was higher in the PRE adjacent shelf waters (including the coastal waters and the open waters) than that in the Changjiang River estuary adjacent shelf waters in the same season (Table 3). There are multiple Syn strains which can be distinguished by pigment type. The high PUB/PEB ratio strain of Syn is considered as characteristic of oceanic water and the low PUB/PEB ratio strain is considered to indicate coastal water (Wood et al., Reference Wood, Horan, Muirhead, Phinney, Yentsch and Waterbury1985; Olson et al., Reference Olson, Chisholm, Zettler and Armbrust1988; Campbell et al., Reference Campbell, Landry, Constantinou, Nolla, Brown, Liu and Caron1998; Jiao et al., Reference Jiao, Yang, Hong, Ma, Harada, Koshikawa and Watanabe2005). The high PUB/PEB ratio strain of Syn was reported to be more temperature-dependent and better suited to successful competition at lower nutrient levels, and the latter was more nutrient-dependent and temperature-independent when temperature was relatively high (Jiao et al., Reference Jiao, Yang, Hong, Ma, Harada, Koshikawa and Watanabe2005). This is also supported by our results (Figure 7). In the inner estuary, the eutrophication was more serious due to the low river discharge in winter (Harrison et al., Reference Harrison, Yin, Lee, Gan and Liu2008), and the high PUB/PEB ratio strain of Syn was only observed in the coastal and open waters. Temperature could be a limiting factor on Syn growth during the cold season in the Changjiang River coastal or shelf areas (Chiang et al., Reference Chiang, Kuo, Chang, Wang and Gong2002; Chang et al., Reference Chang, Lina, Chen, Gong and Chiang2003; Jiao et al., Reference Jiao, Yang, Hong, Ma, Harada, Koshikawa and Watanabe2005). In our study area, Syn abundance was positively correlated with the surface water temperature (Table 1). In addition to temperature, nutrients may also be important in controlling the spatial distribution of Syn (Campbell et al., Reference Campbell, Liu, Nolla and Vaulot1997; Michele et al., Reference Michele, Olson and Chisholm2001; Chiang et al., Reference Chiang, Kuo, Chang, Wang and Gong2002, 2003; Jiao et al., Reference Jiao, Yang, Hong, Ma, Harada, Koshikawa and Watanabe2005). In surface Mediterranean waters during summer, both NO3 and PO43 were low in the oligotrophic regions, but Syn was only nitrogen limited (Vaulot et al., Reference Vaulot, Lebot, Marie and Fukai1996). In the East China Sea, NO3 concentration had a critical effect on the growth rate of Syn, but the effect was significant only when the water temperature was higher than 16°C (Chang et al., Reference Chang, Lina, Chen, Gong and Chiang2003). As the PRE and its adjacent waters are relatively nutrient-replete in winter due to the reduced river discharge and the vertical mixing, no nutrient limitation to Syn was found. Also Syn has wider adaptation to nitrogen concentration. Although inorganic nitrogen is important to Syn growth, Syn can use NO3 with low concentration efficiently and be dominant in the low nitrogen waters (Wyman et al., Reference Wyman, Gregory and Carr1985). Some studies indicate that Syn below the surface waters was affected by the transparency (Chiang et al., Reference Chiang, Kuo, Chang, Wang and Gong2002), but others show that the effect of light on the growth rate of Syn was not significant (Chang et al., Reference Chang, Lina, Chen, Gong and Chiang2003). It is reported that the Syn surpassed 104 cells/ml only when the SSC was lower than 5 mg/l (Vaulot & Ning, Reference Vaulot and Ning1988). In this study, the Syn could surpass 104 cells/ml even when the SSC was higher than 20 mg/l in the inner estuary. While the SSC was low in the coastal waters (average 4.4 mg/l) and in the open waters (usually < 3 mg/l), and the cell number of Syn was always higher than 104 cells/ml (Figures 2 & 3; SSC Syn).
Previous studies found that the Pro:Syn abundance ratio is between 1 and 5 in mesotrophic regions and 50–200 in oligotrophic environments at similar latitudes (e.g. Binder et al., Reference Binder, Chisholm, Olson, Frankel and Worden1996; Buck et al., Reference Buck, Chavez and Campbell1996; Partensky et al., Reference Partensky, Blanchot, Lantione, Neveux and Marie1996; Landry et al., Reference Landry, Kirshtein and Constantinou1996; Reckermann & Veldhuis, Reference Reckermann and Veldhuis1997; Campbell et al., Reference Cavender-Bares, Mann, Chisholm, Ondrusek and Bidigare1998). In this study, the average Pro:Syn abundance ratio was 0.22 (0 − 0.73) in the coastal waters and 0.74 (0.23 − 4.19) in the open waters. Only at Stations N58 and N60 the ratio were larger than 1. Therefore, most of the study area can be described as mesotrophic or eutrophic.
Picoeukaryotes were reported to be the most competitive among Pico in near-shore waters with abundant river-borne nutrients (Pan et al., Reference Pan, Zhang, Zhang, Gasol and Chao2005, Reference Pan, Zhang and Zhang2007). In the present study, Euk was dominant in the inner estuary, Daya Bay and Dapeng Bay, with more nutrient input. %Euk was lower than %Syn at most stations in the coastal waters (Figures 2 & 6). Temperature can also be a limiting factor to Euk in the Changjiang River estuary (Pan et al., Reference Pan, Zhang, Zhang, Gasol and Chao2005, Reference Pan, Zhang and Zhang2007; Jiao et al., Reference Jiao2006). However, in the PRE with relatively high surface temperature in winter, negative correlation was found between water temperature and %Euk (Table 1). Such a result indicated that temperature as governed by the coastal circulation (Harrison et al., Reference Harrison, Yin, Lee, Gan and Liu2008) could be one of the critical factors influencing the spatial pattern of the Pico community structure in the PRE. The composition of Euk was complicated, as molecular studies have brought to light the great diversity of picoeukaryotes (Díez et al., Reference Díez, Pedrós-Alió and Massana2001). In the East China Sea, the higher cell numbers of Euk in the coastal waters in winter was associated with the diatoms which prefer low temperature (Li, Reference Li2004; Jiao et al., Reference Jiao, Yang, Hong, Ma, Harada, Koshikawa and Watanabe2005). In this study, cell numbers of both Syn and Pro had significant negative correlations with the SiO32 concentration, while %Euk had significant positive correlation with the SiO32 concentration (Table 1). However, whether the correlations are associated with diatoms needs further studies. In the Changjiang River estuary, high SSC might lead to light limitation of Pico growth (Jiao et al., Reference Jiao2006; Pan et al., Reference Pan, Zhang and Zhang2007). In the PRE, however, %Euk had significant positive correlation with the SSC (Table 1), which might be due to the adaptation of Euk, relatively high light intensity in the subtropical estuary and the relatively low SSC (Pan et al., Reference Pan, Zhang and Zhang2007).
Dissolved oxygen is affected by the water temperature and salinity. In most cases, DO is high when the water temperature and salinity are low. In the study area, the average DO and the pH were high in the open waters during winter. Both DO and pH can be affected by the biological activities (e.g. photosynthesis and respiration). Although the cell numbers of both Syn and Pro, and %Euk at the surface water had significant correlations with DO and pH (Table 1), the relationship between Pico and DO or pH cannot be easily explained.
Niches of Pro, Syn and Euk
In our study, the absolute and relative abundances of different groups of Pico had significant correlations with all the environmental factors (Table 1). Furthermore, the correlations between the cell numbers of Pro and the environmental factors were consistent with those between the cell numbers of Syn and the environmental factors. But the correlations between %Euk and the environmental factors were opposite to those between the abundance of prokaryotic cells (Pro and Syn) and the environmental factors (Table 1), which has seldom been reported in other similar studies (e.g. Olson et al., Reference Olson, Chisholm, Zettler, Altabet and Dusenberry1990; Campbell et al., Reference Campbell, Nolla and Vaulot1994, Reference Campbell, Liu, Nolla and Vaulot1997, Reference Cavender-Bares, Mann, Chisholm, Ondrusek and Bidigare1998; Moore et al., Reference Moore, Georicke and Chisholm1995; Binder et al., Reference Binder, Chisholm, Olson, Frankel and Worden1996; Landry et al., Reference Landry, Kirshtein and Constantinou1996; Zubkov et al., Reference Zubkov, Sleigh, Tarran, Burkill and Leakey1998; Partensky et al., Reference Partensky, Hess and Vaulot1999; Michele et al., Reference Michele, Olson and Chisholm2001; Chiang et al., Reference Chiang, Kuo, Chang, Wang and Gong2002; Chang et al., Reference Chang, Lina, Chen, Gong and Chiang2003; Worden et al., Reference Worden, Nolan and Palenik2004; Fuller et al., Reference Fuller, West, Marie, Yallop, Rivlin, Post and Scanlan2005; Jiao et al., Reference Jiao, Yang, Hong, Ma, Harada, Koshikawa and Watanabe2005; Pan et al., Reference Pan, Zhang, Zhang, Gasol and Chao2005, Reference Pan, Zhang and Zhang2007). The differences between the regression functions of prokaryotic cells and Euk strongly suggested that the niches of prokaryotic cells and Euk were quite different (Figure 8). Thus the different linear relationships between different groups of Pico cells and environmental factors reveal a complex relationship between total Pico abundance and environmental factors.
Linking Pico community structures with hydrochemical conditions
In the temperate seas, Pro was found to be more competitive in the waters of warm, saline and oligotrophic current areas, such as the Kuroshio Current and the Taiwan Warm Water Currents (Jiao et al., Reference Jiao, Yang, Hong, Ma, Harada, Koshikawa and Watanabe2005; Pan et al., Reference Pan, Zhang, Zhang, Gasol and Chao2005, Reference Pan, Zhang and Zhang2007). On the other hand, river inputs might inhibit the growth of Pro (Chisholm et al., Reference Chisholm, Frankel, Goericke, Olson, Palenik, Waterbury, West-Johnsrud and Zettler1992; Jiao et al., Reference Jiao, Yang, Hong, Ma, Harada, Koshikawa and Watanabe2005). In the present study, the significant correlations between Pro and salinity indicated the impact of the Pearl River discharge and the coastal circulation on the spatial distribution of Pro. Synechococcus was reported to be abundant in the Changjiang River estuary affected by the river effluent plumes, coastal upwelling and shelf mixing waters with relatively replete nutrients (Chiang et al., Reference Chiang, Kuo, Chang, Wang and Gong2002; Jiao et al., Reference Jiao, Yang, Hong, Ma, Harada, Koshikawa and Watanabe2005; Pan et al., Reference Pan, Zhang, Zhang, Gasol and Chao2005). In the cold season, it appears to be more abundant in the warm current areas (Jiao et al., Reference Jiao, Yang, Hong, Ma, Harada, Koshikawa and Watanabe2005; Pan et al., Reference Pan, Zhang, Zhang, Gasol and Chao2005). Picoeukaryotes are usually dominant in the near-shore waters and nutrients are replete (Jiao et al., Reference Jiao, Yang, Hong, Ma, Harada, Koshikawa and Watanabe2005; Pan et al., Reference Pan, Zhang, Zhang, Gasol and Chao2005, Reference Pan, Zhang and Zhang2007). The results in this study are consistent with these previous findings. In the study area, Euk was the dominant group while Pro was not observed in the inner estuary, and Syn dominated the coastal and open waters. Such distribution pattern of the Pico community structure is affected by the river discharge and the north-eastward flowing Guangdong coastal current governing the water quality parameters such as temperature and salinity in winter (Harrison et al., Reference Harrison, Yin, Lee, Gan and Liu2008). The inner estuary and the open waters are extreme environments for Pro and Euk, respectively, because of more serious eutrophication due to small river discharge and low salinity related to the coastal circulation in the inner estuary, and strong influence of oceanic water in the open waters in winter. These observations further support the hypothesis that changes of Pico community structures from the inner estuary to the open water, are influenced by hydrochemical change.
ACKNOWLEDGEMENTS
This study was supported by the National Project of Coastal Environment Investigation and Assessment (908 01 ST07, 908 ZC I.02) and the Key Program of National Natural Science Foundation of China (No. 40531006). We thank the Chemical Analysis Laboratory of SCSEMC, SOA and the South China Sea Marine Engineering Surveying Center, SOA for the chemical and hydrological data. We are grateful to Dr Lin Junda, Dr Tom Church, Dr Han Lei and Professor Chen Qingchao for their valuable suggestions for the manuscript.