Introduction
The prevalence of diabetes has been rising faster in low- and middle-income countries than in higher-income countries (WHO, 2016). This is a worrying trend, as nearly 80% of the global diabetic population presently lives in the developing world (Katulanda et al., Reference Katulanda, Constantine, Mahesh, Sheriff, Seneviratne and Wijeratne2008). Due to population ageing and urbanization, the burden of diabetes in these countries is expected to rise even further (Duboz et al., Reference Duboz, Chapuis-Lucciani, Boëtsch and Gueye2012). The diabetes epidemic is rapidly expanding in India with 69.2 million people (8.7% of the population) living with diabetes in 2015 (WHO, 2016). The increasing trend of diabetes is a matter of concern because lack of proper treatment could lead to high levels of cardiovascular disease incidence and other related complications, overwhelming the limited health care system in India (Katulanda et al., Reference Katulanda, Constantine, Mahesh, Sheriff, Seneviratne and Wijeratne2008). Diabetes is an expensive chronic disease due to its multi-organ effects (Khalid et al., Reference Khalid, Khan, Saleem, Tahir and Mahmood2014). Inadequate facilities, lack of financial assistance and health education, illiteracy and prevailing poverty worsen the situation (Kapur et al., Reference Kapur, Björk, Nair, Kelkar and Ramachandran2004). According to WHO estimates, diabetes deaths in India could increase by 58% – from 51 million people in 2010 to 87 million by 2030 (Malik, Reference Malik2016).
A web search for ‘Diabetes’, ‘Prevalence’, ‘Socioeconomic determinants’ and ‘India’ identified 141 studies published in English between 1987 and 2017. Of the original studies conducted in the general population, most showed the diabetes prevalence across different countries in the world, and only a few reported the prevalence at a local level in India. Just one reported the prevalence of diabetes at state level, and one at district level, in the country. Most studies in India documented that higher socioeconomic status was associated with diabetes. One important finding from studies in India is that urbanization is a potential risk factor, with rapid economic development and changes in lifestyle. The present study is the first to offer a reliable set of disaggregated estimates of individuals with diabetes for the population aged 18 years and above in southern India in 2012–13.
Recent studies addressing the prevalence and determinants of diabetes in India can be broadly categorized into two groups: 1) those based on subnational samples (Mohan et al., Reference Mohan, Deepa, Deepa, Shanthirani, Farooq, Ganesan and Datta2006; Purty et al., Reference Purty, Vedapriya, Bazroy, Gupta, Cherian and Vishwanathan2009; Kalra et al., Reference Kalra, Kalra and Sharma2010; Bharati et al., Reference Bharati, Pal, Kar, Rekha, Yamuna and Basu2011, Nazir et al., Reference Nazir, Papita, Anbalagan, Anjana, Deepa and Mohan2012; Jose et al., Reference Jose, Manojan, Augustine, Nujum, Althaf and Seena2013; Salas et al., Reference Salas, Acosta, Ferri, Guerra, Huang and Uwakwe2016); and 2) those based on large population health surveys (Anjana et al., Reference Anjana, Pradeepa, Deepa, Datta, Sudha and Unnikrishnan2011, Reference Anjana, Deepa, Pradeepa, Mahanta, Narain and Das2017; Rao et al., Reference Rao, Bhatnagar and Murphy2011; Agrawal & Ebrahim, Reference Agrawal and Ebrahim2011; Corsi & Subramanian, Reference Corsi and Subramanian2012; Agrawal et al., Reference Agrawal, Millett, Subramanian and Ebrahim2014; Agrawal & Fledderjohann, Reference Agrawal and Fledderjohann2016; Akhtar & Dhillon, Reference Akhtar and Dhillon2017). While subnational-level studies have reported diabetes (either type 1 or type 2) prevalences of between 6% (Nazir et al., Reference Nazir, Papita, Anbalagan, Anjana, Deepa and Mohan2012) and 27% (Jose et al., Reference Jose, Manojan, Augustine, Nujum, Althaf and Seena2013) depending on the study design, geographical setting and socioeconomic characteristics of the sample, nationally representative surveys based on self-reported diabetes have revealed that the prevalence is below 2% (Agrawal & Ebrahim, Reference Agrawal and Ebrahim2011; Corsi & Subramanian, Reference Corsi and Subramanian2012). Most studies have confirmed that diabetes risk increases with increase in age and body mass index (BMI) (Agrawal & Ebrahim, Reference Agrawal and Ebrahim2011), socioeconomic status (Corsi & Subramanian, Reference Corsi and Subramanian2012) and physical inactivity (Gupta et al., Reference Gupta, Singh, Purty, Kar, Vedapriya, Mahajan and Cherian2010). A recent study examining the differentials and determinants of diagnosed diabetes prevalence in fifteen states inferred the presence of a large disparity across Indian states (Anjana et al., Reference Anjana, Deepa, Pradeepa, Mahanta, Narain and Das2017). This study indicated a higher prevalence of diabetes in low socioeconomic groups in urban areas in the more economically developed states of India.
No previous study has been found that has documented the burden of diabetes at district level using representative data of diagnosed diabetes among adults in southern India. Furthermore, no previous studies have conducted geospatial analyses of the burden of diabetes in India. Therefore, this study endeavoured to analyse the magnitude and disparity in diabetes prevalence at the district level in southern India – a region with a high prevalence of diabetes. Secondly, it investigated the spatial pattern and determinants of diabetes in the region using Moran’s I, Local Indicators of Spatial Association (LISA) maps and OLS and Spatial Lag regression models. The novelty of this study is that it was based on a recently conducted large-scale population-based survey (2012–13) where diabetes information was collected based on both self-reporting of diabetic status by respondents and diagnosis by the interviewers. Furthermore, it attempted to identify districts with high rates of diabetes prevalence to facilitate intervention at district level rather than focusing on individual level. Therefore, unlike previous studies, it adopted a macro-level approach.
Methods
Data
Data were obtained from the District Level Household and Facility Survey-4 (DLHS-4) conducted in India in 2012–13 (IIPS, 2014). This was a cross-sectional survey covering 23 states and union territories (UTs) of India but excluded the socioeconomically less-developed states in north–central and eastern India (Assam, Jammu & Kashmir, Lakshadweep, Gujarat, Dadra and Nagar Haveli). The survey employed a multi-stage stratified systematic sampling method for representative sampling in each district. The analysis in the present study was restricted to the southern region of India for two reasons. First, the prevalence of diabetes is high in south Indian states, and it was considered so that focused attention could be given to understand the differentials and determinants of diabetes prevalence in that region. Secondly, the DLHS-4 does not provide data on the most populous and geographically contiguous northern (Jammu & Kashmir, Rajasthan, Uttarakhand, Uttar Pradesh), central (Madhya Pradesh, Chhattisgarh) and eastern states (Bihar, Jharkhand, Orissa, Assam) of India. Therefore, data from 105 districts covering six states, namely, Andhra Pradesh, Karnataka, Goa, Kerala, Tamil Nadu and Telangana, and one UT (Puducherry) of southern India were considered for analysis.
Measures and independent variables
Clinical, anthropometric and biochemical (CAB) tests were conducted in the DLHS-4 to collect information on the heights and weights of all household members, the haemoglobin condition of all household members aged 6 months or older and the fasting blood sugar levels of those aged 18 years or over. Following WHO guidelines, adults were categorized as having diabetes if their fasting blood glucose level was 126 mg/dl or above (WHO, 2016). Pregnant women were excluded from the present analysis because of the risk of gestational diabetes – a temporary state resulting from hormonal changes during pregnancy. The final sample size was 264,435 respondents aged 18 years or above. The prevalence rates of diabetes for the districts of southern India were calculated. The ‘prevalence of diagnosed diabetes’ was the ratio of the number of persons who had a fasting blood sugar level of 126 mg/dl or above at the time of the CAB tests, to the total number of persons who had undergone the fasting blood sugar test. The ‘prevalence of self-reported diabetes’ was calculated by dividing the number of persons who reported having been diagnosed with diabetes by the total number of sampled persons.
In the regression analysis, independent variables were included considering data availability, study context and available online studies. The final list of independent variables was based on the Multicollinearity Condition Number (MCN) in the regression output. Since the inclusion of any of the three variables ‘proportion of overweight/obese individuals’, ‘proportion of female population’ and ‘proportion of people aged 60 years and above’ led the MCN to be more than 30, these variables were dropped. The Jarque-Bera test was employed for normality assumption of errors and showed a significant result. However, it was ignored as the sample size was large enough. Furthermore, the Koenker–Bassett test for heteroskedasticity showed significant results indicating the absence of heteroskedasticity.
As indicated in earlier research in India and other countries, the proportion of people belonging to the ‘rich’ and ‘richer’ wealth index quintiles was expected to have a significant association with diabetes prevalence. Minority caste and religion were included with the expectation of finding a negative association with diabetes prevalence. In addition, the proportion of urban population was considered because a previous study in Sri Lanka found that urban residents had a higher chance of developing diabetes (Katulanda et al., Reference Katulanda, Constantine, Mahesh, Sheriff, Seneviratne and Wijeratne2008). The proportion of people with secondary education and higher was expected to have a negative relationship with diabetes prevalence and was thus included. Lifestyle factors (proportion of former smokers, former alcohol drinkers and tobacco chewers) were included because Sung et al. (Reference Sung, Hsiao, Chang, Lin and Yueh2016) observed that, within the first 2 years after quitting, ex-smokers were even more likely to be newly diagnosed with diabetes than current smokers, and furthermore, studies have shown that alcohol consumption could increase insulin sensitivity hence lowering the risk of diabetes (Rimm et al., Reference Rimm, Chan, Stampfer, Colditz and Willett1995; Wannamethee et al., Reference Wannamethee, Shaper, Perry and Alberti2002). Therefore, ex-drinkers could have a higher chance of developing diabetes.
Missing values have been found in several previous studies (Masconi et al., Reference Masconi, Matsha, Echouffo-Tcheugui, Erasmus and Kengne2015). The simplest way to handle missing data is through complete-case analysis, but this often results in a reduction in sample size, as well as inconsistent estimators, and consequently loss of statistical power and an increase in standard error (Nielsen, Reference Nielsen2001; Masconi et al., Reference Masconi, Matsha, Echouffo-Tcheugui, Erasmus and Kengne2015). Missing values could be efficiently dealt with through the process of imputation, resulting in valid tests and consistent estimators (Nielsen, Reference Nielsen2001). Imputation replaces missing values with estimates obtained through relationships between and within variables. Therefore, in this study, Conditional Mean Imputation was used, i.e. a regression imputation known to be one of the most efficient procedures (Masconi et al., Reference Masconi, Matsha, Echouffo-Tcheugui, Erasmus and Kengne2015). Age and sex of the respondents were used in the imputation process.
Analyses
Since the age structures of districts varied widely, age-standardized diabetes prevalence was calculated using India’s age structure from the 2011 Census of India (Registrar General of India, 2011) as ‘standard’. This revealed the variation in diabetes prevalence at district level after eliminating the effect of age structure. Finally, to estimate the magnitude of the diabetes burden in absolute numbers, diabetes prevalence was multiplied by the population-exposed data (18 years and above) from the 2011 Census of India for the southern states. All the maps were prepared using ArcGIS 10.
To examine the spatial autocorrelation in diabetes prevalence across districts, Univariate Local Moran’s I (the autocorrelation among neighbouring values) was computed. This was used to determine if there was any clustering of similar prevalence of diabetes across the districts situated near each other (Getis & Ord, Reference Getis and Ord1992). The value of Moran’s I ranged from −1 (perfect dispersion) to +1 (perfect clustering) showing the strength of spatial dissimilarity or similarity with the bordering districts. The local Moran statistic for areal unit i is given as:
 $${I_i} = {z_i}\sum\nolimits_j^{} {} {w_{ij}}{z_j}$$
where zi is the original variable, xi is in ‘standardized form’ or ‘deviation form’ and wij is the spatial weight. The summation Σ is across each row i of the spatial weights matrix (Briggs Henan University, 2010). The first law of geography by Tobler states that ‘Everything is related to everything else, but near things are more related than distant things,’ (Miller, Reference Miller2004). In spatial statistics this means closer things have more influence than things that are further away, and spatial weights are measures of that influence. Therefore, the first step in analysing spatial autocorrelation is to compose a spatial weight matrix consisting of information on neighbourhood districts for each locale (Aljoufie et al., Reference Aljoufie, Brussel, Zuidgeest and van Maarseveen2013). A first-order rook contiguity method was considered because the spatial composition of districts has been seen to be more consistent with rook contiguity spatial weights (Aljoufie et al., Reference Aljoufie, Brussel, Zuidgeest and van Maarseveen2013), which means the districts share common borders (Stieve, Reference Stieve2012). Moran’s I is the test for spatial autocorrelation examining the existence of any clustering of similar prevalence in the study area, while Local Indicators of Spatial Association (LISA) show the location of significant clustering or spatial outliers (Stieve, Reference Stieve2012). The spatial analysis was performed using GeoDa software to assess the spatial autocorrelation and local spatial clustering of similar prevalence of diabetes between neighbouring districts. Through a permutation procedure of 999 Monte Carlo replications, the significance test statistic was performed against the null hypothesis of no spatial autocorrelation (Aljoufie et al., Reference Aljoufie, Brussel, Zuidgeest and van Maarseveen2013). The cluster maps show the local spatial significant clustering of diabetes prevalence at the district level by the type of spatial correlation: red for high–high associations, dark blue for low–low associations, light blue for low–high and pink for high–low associations. Depending on the significance level, LISA significant maps represent districts with various shades of green.
To examine the determinants of diabetes prevalence at district level, first Ordinary Least Squares (OLS) regression analysis considering the district as a unit of analysis was carried out. Then the Spatial Lag (SL) model available in GeoDa was used to examine the relationship between diabetes prevalence and the independent variables of the districts (Anselin, Reference Anselin2005).
The SL model can be mathematically expressed as:
 $$y = \rho {W_y} + X\beta + \varepsilon $$
where y is a vector of observations on the dependent variable, Wy is a spatially lagged dependent variable for weights matrix W, X is a matrix of observations on the explanatory variables, ε is a vector of independent and identically distributed (i.i.d.) error term and ρ and β are parameters (Anselin, Reference Anselin2005).
According to Anselin (Reference Anselin2005), the appropriate measures of fit for this spatial regression model are the Akaike Information Criterion (AIC), the Log-Likelihood and Schwarz Criterion (SC), so comparing the R 2 with the OLS results would not hold true.
Results
Inter-state variation in diagnosed and self-reported diabetes prevalence
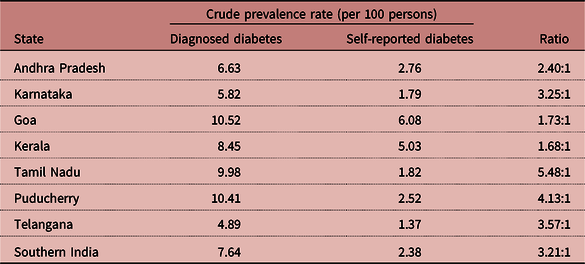
Table 1 presents the interstate variation in diagnosed and self-reported diabetes prevalence for individuals aged 18 years and over in the six southern states and one union territory of southern India. The prevalence patterns among the states/UT were different for diagnosed and self-reported diabetes. The overall diagnosed diabetes prevalence in southern India was 7.64%, while it was 2.38% for reported diabetes prevalence. Wide inter-state variation was found, with Goa (10.52%; 6.08%) and Telangana (4.89%; 1.37%) having the highest and the lowest diagnosed and reported diabetes prevalences, respectively. The highest variation between diagnosed and reported prevalence was found in Tamil Nadu (5.48:1), and the lowest in Kerala (1.68:1).
Interstate variation in diagnosed and self-reported diabetes prevalence rates for adults aged 18 years and over in southern India, 2012–2013

Source: Computed from DLHS-4 data files.
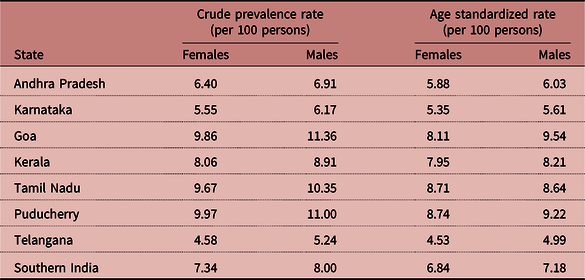
Table 2 presents the age-standardized prevalence of diagnosed diabetes by sex. This varied from 9.22% in Puducherry to 4.99% in Telangana in the male population, and from 8.74% in Puducherry to 4.53% in Telangana for females. The diagnosed diabetes prevalence was higher in males than females in all states except Tamil Nadu.
Crude and age-standardized prevalence rates of diagnosed diabetes for adults aged 18 years and over in southern India, 2012–2013

Standard population: Age, sex-specific Indian population aged 18 years and above from Census of India, 2011.
Source: Computed from DLHS-4 data files.
Spatial patterns of diagnosed diabetes prevalence
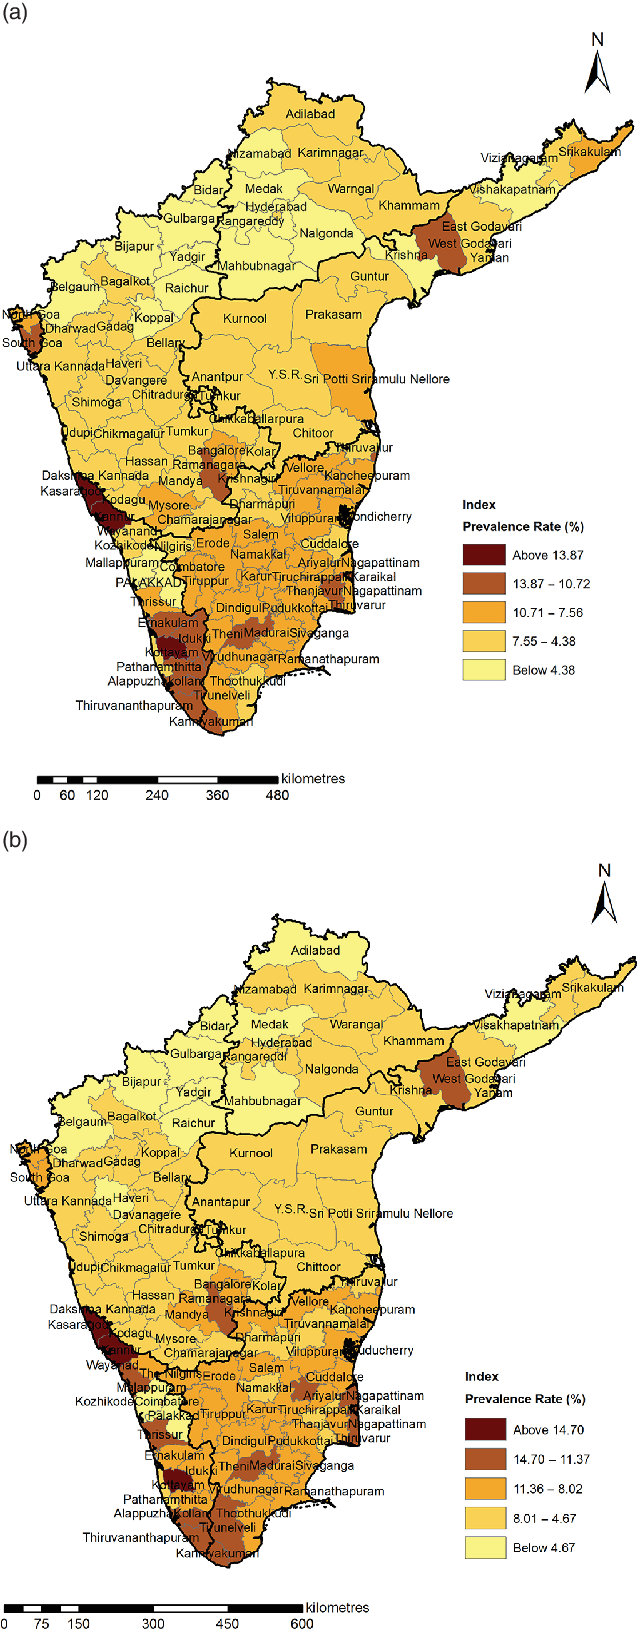
Figure 1 presents the district-level variation in diagnosed diabetes prevalence showing the geographical distribution of the disease for female (Figure 1a) and male (Figure 1b) adults aged 18 years and over. For the choropleth mapping, five classes were categorized: >Mean+2SD, Mean+2SD to Mean+SD, Mean+SD to Mean, Mean to Mean–SD, <Mean–SD. The figure shows wide inter-district variations in diagnosed diabetes prevalence, showing clearly that the south of southern India had a higher prevalence of diagnosed diabetes, as indicated by darker shades. Lower diagnosed diabetes prevalence was mostly confined to the northern section, which is delineated by lighter shades on the maps. Among the 105 selected districts, Kannur and Palakkad in Kerala had the highest and lowest prevalences of diagnosed diabetes, respectively, for both females and males. Kasaragod and Kottayam stand out as having higher diagnosed diabetes prevalences for both sexes. The diagnosed diabetes prevalence of women exceeded that of men in 36 districts. A small number of districts had a difference of 2% or higher between the sexes (Thiruvarur, South Goa, Pathanamthitta, Namakkal and Kancheepuram) and Chennai had the highest difference of all, at 4.08%.
Prevalence rates of diagnosed diabetes by district in a) females and b) males aged 18 years and over in southern India, 2012–2013.

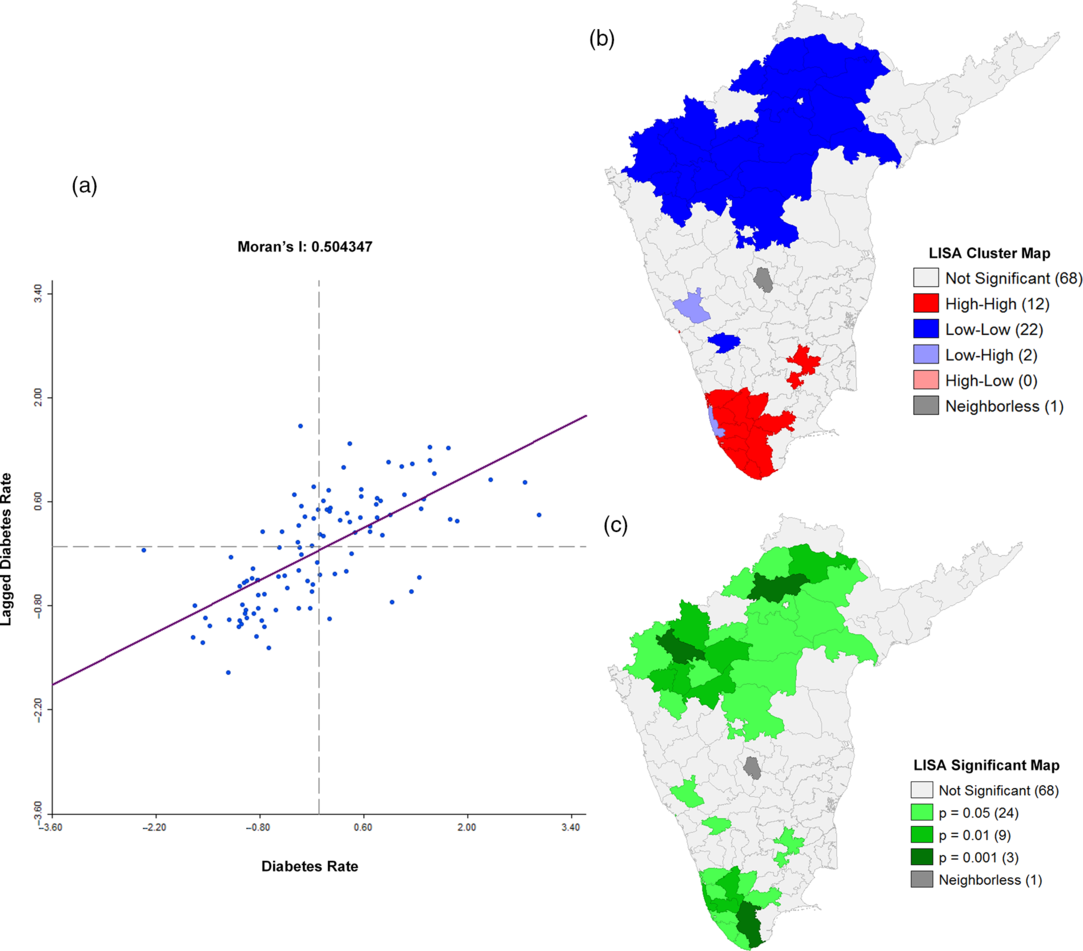
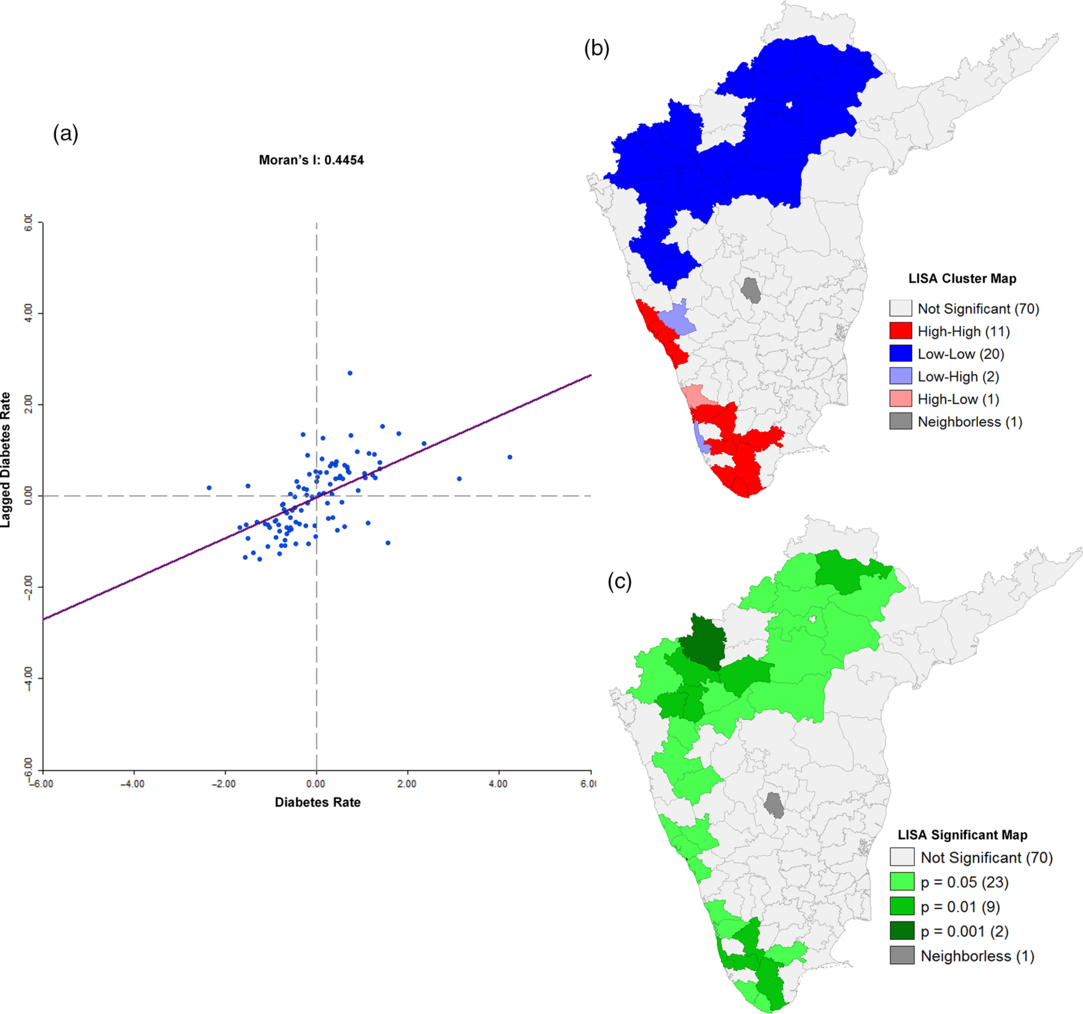
Figures 2 and 3 show the clustering of diagnosed diabetes prevalence for females and males, respectively, using univariate local Moran’s I scatter plots and LISA maps. The scatter plots show the diagnosed diabetes prevalence on the x-axis and the spatially lagged prevalence (weighted mean of neighbouring diagnosed diabetes prevalence) on the y-axis (Aljoufie et al., Reference Aljoufie, Brussel, Zuidgeest and van Maarseveen2013). Here, the dependent variable (diagnosed diabetes prevalence) shows its association with the prevalence of diagnosed diabetes in its nearby location. The slope represents the Moran’s I components of spatial autocorrelation consisting of four quadrants: high–high (upper right) and low–low (lower left) represent positive spatial autocorrelation, meaning spatial clustering; low–high (upper left) and high–low (lower right) represent a negative spatial autocorrelation, meaning spatial outliers (Aljoufie et al., Reference Aljoufie, Brussel, Zuidgeest and van Maarseveen2013). A high–high (or low–low) association suggests clustering of districts with high (low) prevalence of diabetes. A high–low association means that districts with a high prevalence are surrounded by districts with a low prevalence and vice versa, as seen in the cluster maps.
a) Moran’s I scatter plot, (b) LISA cluster map and (c) LISA significant map for diagnosed diabetes prevalence rates in females aged 18 years and over in southern India, 2012–2013.

a) Moran’s I scatter plot, (b) LISA cluster map and (c) LISA significant map for diagnosed diabetes prevalence rates in males aged 18 years and over in southern India, 2012–2013.

Moran’s I showed a positive and statistically significant relationship between districts for diagnosed diabetes prevalence for both females and males. Figures 2 and 3 indicate that adjoining districts have similar characteristics of higher or lower prevalence, implying spatial clustering. The Moran I values in these figures signify moderate autocorrelation in the study area. There is greater clustering of diagnosed diabetes prevalence among females (more districts fall into the upper-right and lower-left quadrants of Figure 2a) than among males (see Figure 3a). Clusters of higher diagnosed diabetes prevalence in parts of Kerala and Tamil Nadu can be identified. In the northern part of southern India, covering a large patch of Karnataka, Andhra Pradesh and Telangana, clusters of lower prevalence in females and males can be seen, whereas only a few tracts of spatial outliers can be observed in the two figures.
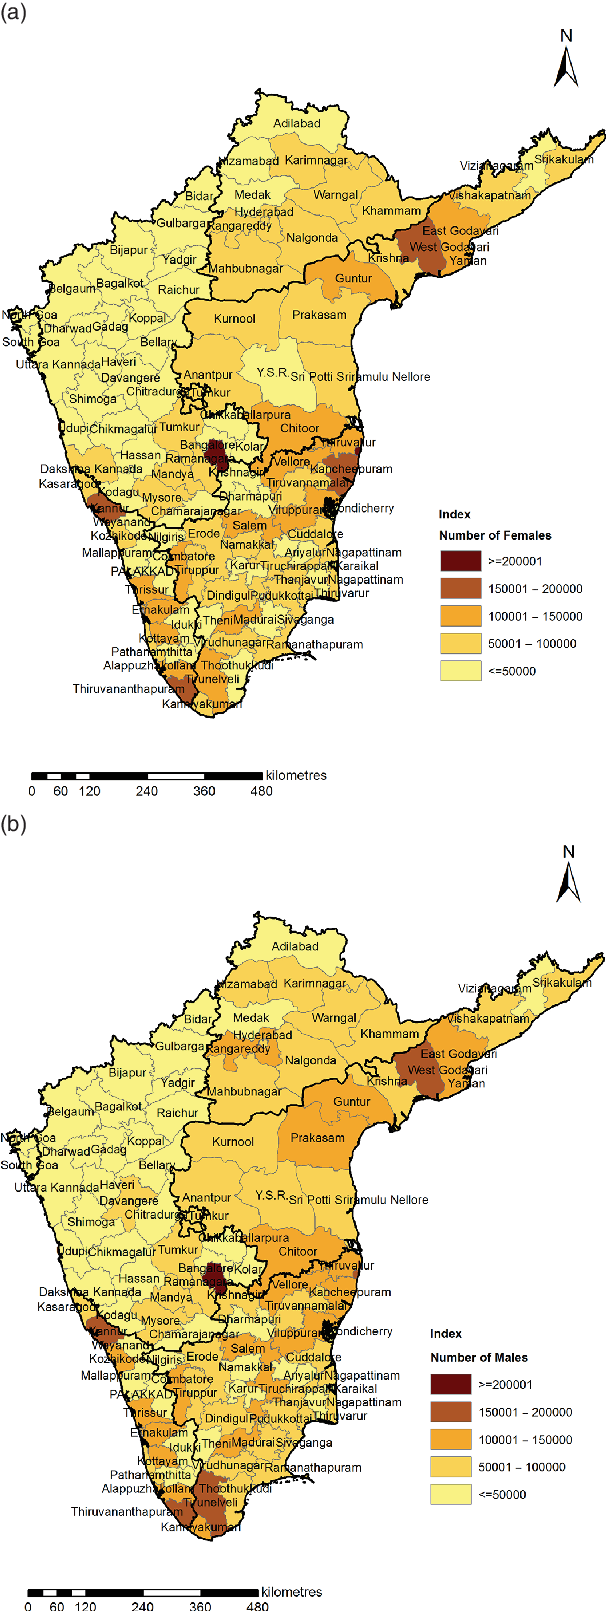
The two maps presented in Figure 4 depict the estimated number of females and males with diagnosed diabetes. Southern India had 14.15 million individuals aged 18 years and over with diabetes in 2012–13. The south and the east of the region had a comparatively higher estimated number than the northern part. Bangalore has the highest number of individuals with diabetes (approximately 0.62 million), and Palakkad has the lowest. Thiruvananthapuram and West Godavari also had higher numbers of persons with diabetes.
Number of a) females and b) males aged 18 years and over with diagnosed diabetes in southern India, 2012–13. Estimated from Census 2011 and DLHS-4.

Descriptive statistics
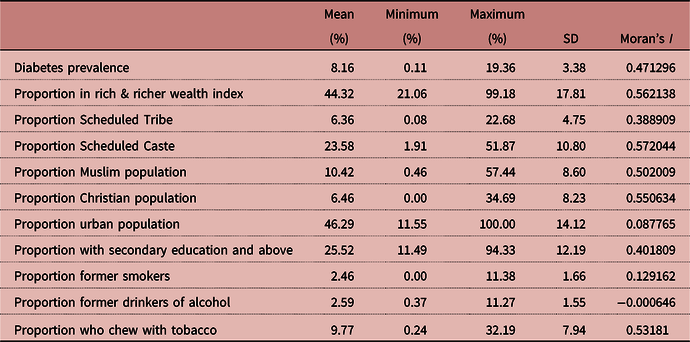
Table 3 presents the descriptive statistics of the dependent and independent variables for the 105 districts of southern India. The mean prevalence of diagnosed diabetes was 8.16%, with a minimum of 0.11% in Palakkad and a maximum of 19.36% in Kasaragod. The highest variation was found in the proportion of urban population, with a maximum percentage of 100% found in two districts of Puducherry, namely Yaman and Mahe; Chennai of Tamil Nadu; and Hyderabad of Telangana, while only 11.55% of urban population is found in Wayanad, Kerala. Larger variations were also found in other variables, such as the proportion of people in the ‘rich and richer’ wealth index categories, as well as persons with secondary level education and higher. On the other hand, the overall mean proportions of Scheduled Tribes and Christians were less than 7%, ten districts having less than 1%. Only South Goa was home to more than 20% Scheduled Tribe population. Less than 1% of the Christian population was found in 24 districts, while ten of the 105 districts held more than 20% of the Christian population. Former smokers and former consumers of alcohol accounted for less than 3% of the total population in the selected districts. Moran’s I statistics (last column of Table 3) show the spatial autocorrelation among neighbouring values. The variables proportion of rich and richer wealth index, Scheduled Caste, Muslim and Christian population and tobacco chewers had reasonably moderate spatial autocorrelation, suggesting a decent spatial pattern for diagnosed diabetes prevalence and its determinants. The result suggests that there is fair scope for bias in the standard error and estimates without spatial dependence.
Descriptive statistics and Moran’s I for dependent and independent variables across 105 districts of southern India, DLHS-4, 2012–2013

Source: Computed from DLHS-4 data files.
OLS and SL models
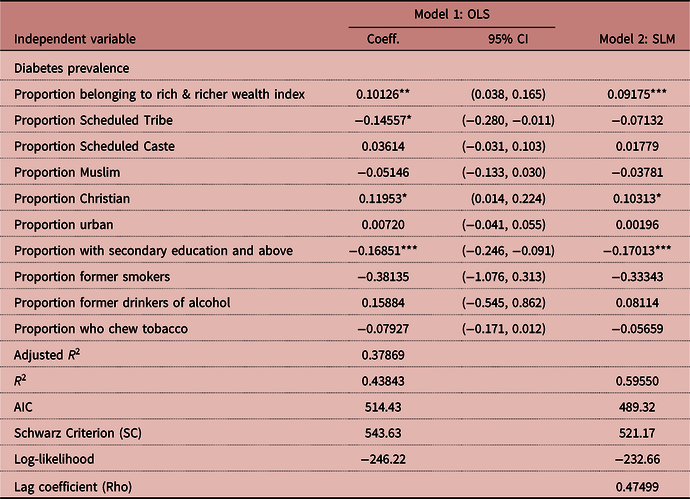
The results of the regression models assessing the association between diagnosed diabetes prevalence and background variables are presented in Table 4. District-level data were used, where the dependent variable was district-level diagnosed diabetes prevalence. The OLS method examined the association between the dependent variable and a set of independent variables. Since spatial data were used, the possibility of spatial dependence amongst errors was examined as the presence of this makes the OLS estimate inefficient. In the OLS result, both the Lagrange Multiplier (lag) and Lagrange Multiplier (error) test were found to reject the null hypothesis of spatial dependence. Therefore, Robust LM (lag) and Robust LM (error) tests were done, resulting in the Robust LM (lag) test being significant. Thus, Spatial Lag model was carried out.
Results of the regression analyses assessing diabetes prevalence by independent variables across districts of southern India, DLHS-4, 2012–2013

***p < 0.001; **p < 0.01; *p < 0.05.
Source: Computed from DLHS-4 data files.
A highly significant negative relationship was found between the proportion of people with secondary or higher education and diagnosed diabetes prevalence in both models. In the OLS and SL model, the proportion of people with rich and richer wealth index is positively associated with diagnosed diabetes prevalence rate. The proportion of Christians showed a positive relationship with diabetes prevalence (p<0.05) in both models. The R 2 in the OLS model indicated that nearly 43% of the variation among the covariates was explained by the independent variables. Simultaneously, the Rho value (0.47499) of the SL model reflected spatial dependence showing the positive moderate significant autocorrelation among the prevalence of diagnosed diabetes in the districts and the error terms. A relative increase (Table 4) in Log-Likelihood (−246.22 to −232.66) and decrease in AIC (from 514.43 to 489.32) and SC (from 543.63 to 521.17) for the OLS model, exhibited an improved fit for the SL model with the data (Anselin, Reference Anselin2005).
Discussion
This study aimed to identify districts in India with high rates of diabetes prevalence to facilitate intervention at the district level, to provide a macro- rather than individual-level picture. The results demonstrated that, compared with self-reported diabetes, rates of diagnosed diabetes were high in the Indian states/UT included in the study. It also created a detailed map of the specific geographic patterns of diagnosed diabetes prevalence across 105 districts in southern India – a region with a high prevalence of diabetes.
Extreme diversity was observed in the levels of diagnosed diabetes prevalence by district, varying from below 1% to nearly 20%. This information is crucial for policy formulation and interventions for diabetes in India, particularly in areas with a high burden of the disease. The study estimated the number of people aged 18 and over with diagnosed diabetes in the study region in 2012–13. Furthermore, using OLS and SL models, the determinants of diagnosed diabetes prevalence were investigated at district level. The strength of this study was that it is based on data from a fairly recent large-scale survey with information on both self-reported and diagnosed diabetes prevalence. The interesting findings were as follows:
First, compared with self-reported diabetes, diagnosed diabetes prevalences were higher in all studied states/UT. It can therefore be deduced that the prevalences of reported diabetes have been underestimated due to under-reporting, lack of knowledge and access to health care facilities (Agrawal & Ebrahim, Reference Agrawal and Ebrahim2011). The symptoms of type 2 diabetes have a slow onset, and some people might not even experience any symptoms, meaning that someone with type 2 diabetes could live with it for up to 10 years before they are formally diagnosed (International Diabetes Federation, 2016).
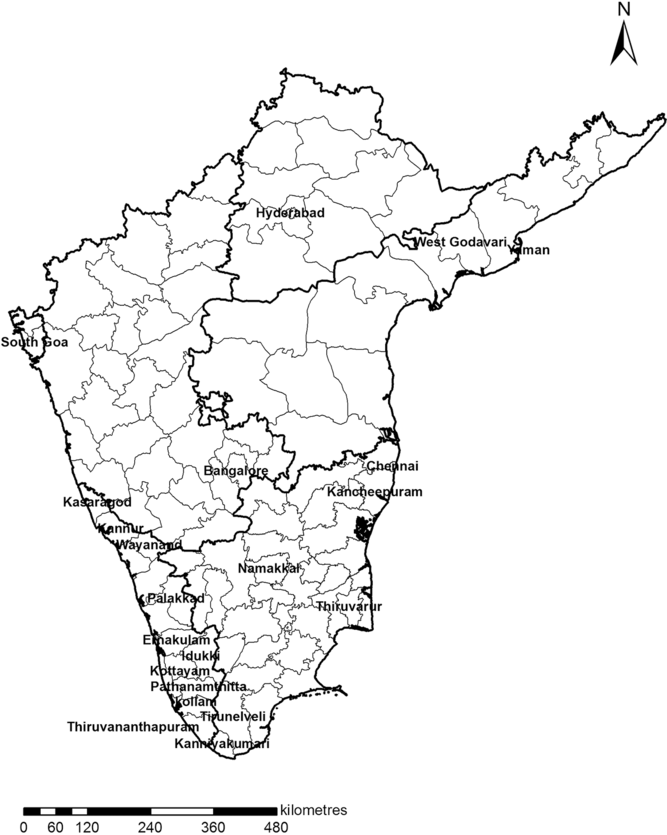
Secondly, high diabetes prevalence was found in southern India. The progressive stage of the demographic transition in southern India might have led to an increase in the proportion of elderly population due to falls in mortality and fertility, and an increase in the life expectancy (Ramachandran et al., Reference Ramachandran, Snehalatha, Mary, Mukesh, Bhaskar and Vijay2006). The diabetes prevalence found in this study seems to be comparable with those of some previous small-scale studies and one national-level study (Purty et al., Reference Purty, Vedapriya, Bazroy, Gupta, Cherian and Vishwanathan2009; Nazir et al., Reference Nazir, Papita, Anbalagan, Anjana, Deepa and Mohan2012; Anjana et al., Reference Anjana, Deepa, Pradeepa, Mahanta, Narain and Das2017). Goa and Puducherry had the highest prevalence of diabetes in the southern region of India, perhaps due to their highly urbanized nature and the lifestyle changes that accompany the process of urbanization. Consistent with results from a previous study (Agrawal & Ebrahim, Reference Agrawal and Ebrahim2011), Goa was found to have the highest prevalence of self-reported diabetes. The diagnosed diabetes prevalences across districts were found to be highest in the south of the study area. Three of the highest prevalence districts, namely Kannur, Kasaragod and Kottayam, are located in Kerala (Figure 5). A possible reason for the higher prevalence in this belt could be the presence of a higher proportion of elderly population living in Kerala. Besides, with its low death rate, the state is also undergoing the advanced stage of epidemiological transition, which might have brought about changes in the disease profile of this state (Vijayakumar et al., Reference Vijayakumar, Arun and Kutty2009). The high prevalence could also be ascribed to changes in food habits, increased life expectancy and urbanization (Ramachandran et al., Reference Ramachandran, Jali, Mohan, Snehalatha and Viswanathan1988). Perhaps the stages of urbanization, changes in occupation structure and the epidemiological and nutritional transition (Vijayakumar et al., Reference Vijayakumar, Arun and Kutty2009) have not been homogenous across all districts, resulting in inter-district variation in the prevalence of diagnosed diabetes. It could also be due to differences in educational attainment and urbanization, or to lifestyle factors such as smoking and alcohol consumption (Table 3).
Locator of southern India showing places named in study.

Thirdly, the spatial analysis showed that there was a moderate autocorrelation of diagnosed diabetes prevalence in the study area for 2012–13, with the cluster maps indicate clustering of similar prevalences of diagnosed diabetes. Clusters of higher diagnosed diabetes prevalence were observed in the southern region of southern India, whereas an extensive part of the northern part had clusters of lower prevalence for both females and males. Compared with females, there was less spatial clustering in males. The cluster that needs intervention for high diabetes prevalence, for both females and males, was formed by Kanniyakumari, Thiruvananthapuram, Kollam, Kottayam, Ernakulam, Idukki and Tirunelveli (Figure 5). Bangalore, the capital city of Karnataka, had the highest number of persons with diagnosed diabetes, probably due to the size of its population (Figure 5).
Finally, the proportion of people with secondary or higher education at district level was negatively associated with district-level diagnosed diabetes prevalence. This finding is consistent with previous studies in developed (Dinca-Panaitescu et al., Reference Dinca-Panaitescu, Dinca-Panaitescu, Bryant, Daiski, Pilkington and Raphael2011; Pintaudi et al., Reference Pintaudi, Lucisano, Gentile, Bulotta, Skovlund and Vespasiani2015) and developing (Duboz et al., Reference Duboz, Chapuis-Lucciani, Boëtsch and Gueye2012) countries, indicating that low education is positively related to diabetes. The proportion of people belonging to the rich and richer wealth index had a positive association with diagnosed diabetes prevalence, perhaps due to improved economic condition, raised standards of living and sedentary jobs (Pan et al., Reference Pan, Yang, Li and Liu1997; Ramachandran et al., Reference Ramachandran, Snehalatha, Baskar, Mary, Kumar and Selvam2004). Also, in developing countries like India, rich people may not be well educated, and may possibly be unaware of the health risks that can result from changes in lifestyle (Chen et al., Reference Chen, Song, Hu and Brunner2012).
Since this study highlighted the high prevalence of diabetes in southern India, it is necessary to address this epidemic before the situation worsens. The promotion of self-care, health awareness, proper diabetes education and opting for healthy lifestyles could delay the onset of the disease, or help diabetes management to avoid further health complications (Kapur et al., Reference Kapur, Björk, Nair, Kelkar and Ramachandran2004). As self-reported diabetes prevalence was found to be much lower than diagnosed prevalence, this indicates a lack of awareness of, and poor access to, health facilities by adults in southern India. The late realization of knowledge of having diabetes and its improper treatment could result in serious life-threatening complications. The higher the degree of complications, the higher the cost of treatment, as well as the loss of productivity at work (Kapur et al., Reference Kapur, Björk, Nair, Kelkar and Ramachandran2004). Accordingly, it is important to raise awareness to enable the timely detection of diabetes. A higher prevalence of diabetes among adults threatens both the economic productivity of the country and the income-earning ability of individuals (WHO, 2014). As the cost of diabetic care is usually high in India, expenses related to diabetes may affect a family’s ability to afford other essentials such as education and food for other household members. With 14.15 million diabetics, southern India needs massive awareness programmes to prevent diabetes, or postpone its onset to a later age. Government and non-governmental stakeholders should emphasize the creation of mass awareness of healthy lifestyles to reduce the prevalence of diabetes.
Although this study was based on India’s most socioeconomically advanced states, the findings are also relevant to the rest of India. With changing age structures and epidemiological scenarios, it is possible that the prevalence of diabetes will increase in the rest of India in the absence of appropriate intervention. More research is also essential among Indian adult to better understand the lifestyles that elevate the risk of diabetes. A significant limitation of this study was its inability to distinguish between type 1 and type 2 diabetes due to the absence in these data in DLHS-4. However, as the study only considered the over-18 population there was less chance of type 1 diabetes among the study respondents. A further limitation was that, since the inclusion of any of the three variables BMI, sex and age led to a Multicollinearity Condition Number >30, these variables were dropped from the analysis. Furthermore, some important factors that could have been potential determinants of diabetes could not be included in the study due to the data unavailability, i.e. family history of diabetes, waist circumference, physical activity, dietary habits, and the presence of anxiety. However, the study findings could usefully inform evidence-based interventions at the local level in India.
Acknowledgments
An earlier version of this paper was presented in the 14th International Conference on Urban Health (ICUH) 2017 held on 26–29th September 2017 in Coimbra, Portugal. The scholarship awarded to SB by ICUH organizers is gratefully appreciated. The authors sincerely thank Dr Biswajit Mondal and Mr Ismail Haque for assisting in the geospatial analysis and regression analysis, respectively.
Funding
This study was based on publicly available data and received no specific grant from any funding agency, commercial entity or not-for-profit organization.
Conflicts of Interest
The authors have no conflicts of interest to declare.
Ethical Approval
The authors assert that all procedures contributing to this work comply with the ethical standards of the relevant national and institutional committees on human experimentation and with the Helsinki Declaration of 1975, as revised in 2008.
Author Contributions
Planning and conceptualization: NS, SB; analysis: SB, RS, NS; interpretation: SB, NS, RS; writing: NS, SB.