
1. Introduction
The motion of a viscous liquid droplet on a solid substrate, which contradicts the non-slip condition, has attracted much interest from scientists for a long time (de Gennes Reference de Gennes1985; de Gennes, Brochard-Wyart & Quéré Reference de Gennes, Brochard-Wyart and Quéré2004). The exploration of the dynamic phenomena (specifically, the difference between the dynamic and static contact angles and the existence of the dynamic contact angle hysteresis) led to a significant progress in interfacial science.
The dynamics of a liquid droplet on the surface of another liquid (‘liquid lens’) attracted still less attention. Its analysis was started in the context of spreading (Suciu, Smigelschi & Ruckenstein Reference Suciu, Smigelschi and Ruckenstein1970; Bacri, Debrégeas & Brochard-Wyart Reference Bacri, Debrégeas and Brochard-Wyart1996), wetting (Joanny Reference Joanny1987) and dewetting (Brochard Wyart, Martin & Redon Reference Brochard Wyart, Martin and Redon1993).
In the case of a slender droplet, the description of the droplet dynamics can be significantly simplified using the longwave approximation, which allows one to diminish the number of dependent and independent variables of the problem. The sharp-interface description (Kriegsmann Reference Kriegsmann1999; Kriegsmann & Miksis Reference Kriegsmann and Miksis2003; Huth et al. Reference Huth, Jachalski, Kitavtsev and Peschka2015) includes an evolution equation for the triple line motion. There exists also another approach, which allows one to get rid of the boundary and matching conditions characteristic for the sharp-interface approach, the droplet on the liquid substrate is considered as a two-layer film. The latter approach is similar to the precursor model developed in the case of a droplet on a solid substrate (Fisher & Golovin Reference Fisher and Golovin2005; Pototsky et al. Reference Pototsky, Bestehorn, Merkt and Thiele2005; Craster & Matar Reference Craster and Matar2006; Jachalski et al. Reference Jachalski, Huth, Kitavtsev, Peschka and Wagner2013; Pototsky, Oron & Bestehorn Reference Pototsky, Oron and Bestehorn2019). The latter model describes the droplet on the liquid substrate as a two-layer film. The same equations are used in the whole region, but outside the droplet, where the top layer is ultrathin, the corresponding disjoining pressure is taken into account. This approach was formerly applied for the description of the droplet formation due to a monotonic instability of a two-layer film caused by intermolecular forces in the isothermal case (Fisher & Golovin Reference Fisher and Golovin2005) and non-isothermal case (Pototsky et al. Reference Pototsky, Bestehorn, Merkt and Thiele2005; Nepomnyashchy & Simanovskii Reference Nepomnyashchy and Simanovskii2006, Reference Nepomnyashchy and Simanovskii2007, Reference Nepomnyashchy and Simanovskii2009).
In applications (e.g. in microfluidic devices) it can be necessary to move a droplet in a controllable way. The simplest way to influence the dynamics of a droplet is a temperature inhomogeneity that creates a Marangoni flow. Let us mention the basic publications devoted to the thermocapillary migration of droplets under the action of a spatial inhomogeneity of temperature. Typically, the droplet is advected by the thermocapillary motion in the liquid layer in the direction opposite to the surface temperature gradient, but there is a contribution to the droplet velocity due to the thermocapillary stresses on the droplet interfaces and due to the shear in the substrate liquid (Greco & Grigoriev Reference Greco and Grigoriev2009). The direction of motion can be different depending on the details of the generated convective flow (Rybalko, Magome & Yoshikawa Reference Rybalko, Magome and Yoshikawa2004) and the droplet shape (Yakshi-Tafti, Cho & Kumar Reference Yakshi-Tafti, Cho and Kumar2010). Moreover, by the laser heating of a droplet, the direction of motion can change periodically with time (Rybalko et al. Reference Rybalko, Magome and Yoshikawa2004; Song et al. Reference Song, Moon, Lee, Kim and Pak2014). Let us mention also experiments on droplet evaporation where the buoyancy-thermocapillary convection caused by the evaporative cooling creates hydrothermal waves (Buffone Reference Buffone2019) and leads to the droplet disintegration (Keiser et al. Reference Keiser, Bense, Colinet, Bico and Reyssat2017).
Recently, Nepomnyashchy & Simanovskii (Reference Nepomnyashchy and Simanovskii2021) considered the influence of a spatially homogeneous heating or cooling of the liquid substrate on the stability of a floating droplet. A number of instability modes leading to droplet oscillations, droplet decomposition or the substrate layer's rupture were revealed.
In the present paper, the dynamics of a droplet on a liquid substrate under the action of a spatial temperature modulation is studied. We show that spatial temperature inhomogeneity can significantly change the shape of the droplet and lead to the complete suppression of droplet oscillations.
The structure of the paper is as follows. The formulation of the problem is given in § 2. Droplet oscillations generated by an oscillatory Marangoni instability in the case of the homogeneous cooling as well as the action of spatial modulation of temperature in the horizontal plane on nonlinear structures are presented in § 3. Section 4 contains some concluding remarks. A brief description of the thermocapillary flow generated by the deflection of interfaces, the discussion of the flows created by interfacial tensions, gravity and disjoining pressures, the list of dimensional parameters of the system and an estimate of the value of the non-dimensional Hamaker constant used in the simulation are given in appendices.
2. Formulation of the problem
Let us consider a droplet of liquid 2 placed between liquid substrate 1 and gas 3 (see figure 1a). The angles between interfaces are determined by the balance of interfacial tensions  $\sigma _{ij}$ of interfaces separating fluids
 $i$ and
 $j$ on the triple line (Neumann conditions, Neumann Reference Neumann1894). An equilibrium droplet (‘partial wetting’) is possible only if the spreading coefficient,
 $S=\sigma _{31}-\sigma _{12}-\sigma _{23},$ is negative (see Langmuir Reference Langmuir1933). If
 $\sigma _{12}+\sigma _{23}<\sigma _{31}$, the separation of fluids 1 and 3 by a film of fluid 2 diminishes the energy of the system. If the Hamaker constant
 $A_2$ characterizing the interaction of fluids 1 and 3 through the film of fluid 2 is negative, a macroscopic layer of liquid 2 is created (‘complete wetting’). However, if it is positive, the minimum of energy corresponds to an ultrathin film of a definite thickness
 $H_{\infty }$ (‘pseudo-partial wetting’), see figure 1(b) (Burton et al. Reference Burton, Huisman, Alison, Rogerson and Taborek2010), hence the droplet coexists with an ultrathin film.
Geometric configuration of the region and coordinate axes.

Macroscopically, both cases are identical. Therefore, in the case of pseudo-partial wetting, the film can be considered as an ‘interface’ with a certain effective surface tension  $\tilde {\sigma }_{31}$. At the same time, in both cases the approach can be applied where the sharp interface is replaced by a precursor film of liquid 2 separating liquid 1 from gas 3 (Craster & Matar Reference Craster and Matar2006; Jachalski et al. Reference Jachalski, Huth, Kitavtsev, Peschka and Wagner2013). The latter approach, which allows us to significantly simplify the description of the contact line dynamics, is applied in the present paper.
Following Craster & Matar (Reference Craster and Matar2006), we assume that outside the droplet, liquid 1 is separated from the gas phase by an ultrathin precursor film of liquid 2. In the absence of the droplet, the equilibrium thickness of layer 1 is  $H_1^0$, while the thickness of the precursor film is
 $H_{\infty }$. The temperature of the solid substrate is
 $T_s(x,y)$, the temperature of the gas is
 $T_g$. Later on, we use subscript
 $i$ for variables referring to the
 $i$th liquid. The
 $i$th fluid has density
 $\rho _i$, dynamic viscosity
 $\eta _i$ and heat conductivity
 $\kappa _i$. Assuming that the temperature differences in the system are not too large, we disregard the dependence of liquid parameters on the temperature, with the only exception. Because the Marangoni convection, which is the subject of the present research, is caused by the dependence of surface tension coefficients on the temperature, that dependence has to be taken into account. The surface tension coefficients on the lower and upper surfaces of the droplets,
 $\sigma _1$ and
 $\sigma _2$, are assumed to be linear functions of temperature
 $T$:
 $\sigma _1=\sigma _1^0-\alpha _1 (T-T_g)$,
 $\sigma _2=\sigma _2^0-\alpha _2 (T-T_g)$, where
 $\alpha _1=-{\rm d}\sigma _1/{\rm d}T$ and
 $\alpha _2=-{\rm d}\sigma _2/{\rm d}T$ are constants. We consider only the case where the thicknesses of the layer and the droplet are so small that the buoyancy convection is negligible compared with the thermocapillary convection. Therefore, we can disregard the dependence of the density on the temperature and the buoyancy force. The gravity acceleration is
 $g$, and the heat exchange coefficient at the liquid/gas interface is
 $q$.
The full mathematical description of the presented problem is rather complex. It includes the system of nonlinear equations governing the viscous flow and the heat transfer with nonlinear boundary conditions on the unknown interfaces between fluids (see appendix A.1), as well as Neumann's expressions for contact angles on the contact line (Neumann Reference Neumann1894). Those technical difficulties can be partially eliminated in the case where the characteristic scales of the motion in vertical and horizontal directions are significantly different (Oron, Davis & Bankoff Reference Oron, Davis and Bankoff1997). In that case, the longwave asymptotic approach can be applied. There are several conditions for the applicability of that approach. First, the surface tension has to be strong, so that any shortwave deformation of the interfaces are suppressed. The analysis (see Oron et al. Reference Oron, Davis and Bankoff1997) shows that the ratio of the characteristic thickness of the system in the vertical direction to the characteristic scale of the interfacial deformations in the horizontal direction is  $O(\epsilon )$,
 $\epsilon \ll 1$, if the surface tension is
 $O(\epsilon ^{-1/2})$. Also, the droplet has to be slender due to a small negative spreading coefficient or because of the action of gravity. In that case, the velocity, pressure and temperature fields are enslaved to the interfacial deformations (see Pototsky et al. Reference Pototsky, Bestehorn, Merkt and Thiele2005). That circumstance allows us to reduce the difficult nonlinear problem to a closed system of evolution equations for variables that describe the shape of interfaces (see (A39a,b)–(A41) in appendix A.4). Thus, the mathematical formulation of the problem is significantly simplified, while all the essential physical effects are retained.
The sketch of the derivation of those equations is given in Appendix A. Here we take (A39a,b)–(A41) as the basic mathematical problem and reformulate it in the non-dimensional form. The equilibrium thickness of the lower layer,  $H_1^0,$ is chosen as the vertical length scale. The choice of the horizontal scale
 $L^*$ is arbitrary (Nepomnyashchy & Simanovskii Reference Nepomnyashchy and Simanovskii2012). Below we choose
 $L^*$ large compared with
 $H_1^0$ but small compared with the horizontal size of the computational region and the characteristic size of the droplet. We choose
 \begin{equation} t^*=\frac{\eta_1(L^*)^4}{\sigma_1^0(H_1^0)^3} \end{equation}
as a time scale and
 \begin{equation} p^*=\frac{\sigma_1^0H_1^0}{(L^*)^2} \end{equation}
as a pressure scale.
Let us describe the non-dimensional parameters of the problem.
The heat transfer at the free boundary is characterized by the Biot number,
 \begin{equation} Bi=\frac{qH_1^0}{\kappa_2}. \end{equation}
Generally, one can expect that this parameter is rather small. However, the effective Biot number can be significantly enhanced by some physical processes, e.g. the evaporation (see Haut & Colinet Reference Haut and Colinet2005). Below we do not assume that the Biot number is small.
The action of gravity is determined by the Bond number,
 \begin{equation} Bo=\frac{g\rho_1(L^*)^2}{\sigma_1^0}. \end{equation}
We define the local Marangoni number as
 \begin{equation} M(X,Y)=\frac{\alpha_1(T_s (X,Y)-T_g)}{\sigma_1^0}\left(\frac{L^*}{H_1^0}\right)^2, \end{equation}
which is a function of  $X$ and
 $Y$ rather than a number. Also, we shall use the mean Marangoni number
 \begin{equation} \bar{M}= \frac{\alpha_1(\bar{T}_s-T_g)}{\sigma_1^0}\left(\frac{L^*}{H_1^0}\right)^2, \end{equation}
where  $\bar {T}_s$ is a characteristic mean temperature of the substrate.
Following Fisher & Golovin (Reference Fisher and Golovin2005), we define  $\eta =\eta _1/\eta _2$ and
 $\sigma =\sigma _2^{(0)}/\sigma _1^{(0)}$. Also, we define
 $\kappa =\kappa _1/\kappa _2$,
 $\alpha =\alpha _2/\alpha _1$ and
 $\rho =\rho _2/\rho _1$ (Nepomnyashchy & Simanovskii Reference Nepomnyashchy and Simanovskii2012).
The temporal evolution of the surface deformations is governed by the volume conservation equations. In the non-dimensional, the governing equations (A39a,b) become
 \begin{equation} h_{1\tau}+\boldsymbol{\nabla}\boldsymbol{\cdot}({\boldsymbol q}_1^T+{\boldsymbol q}_1^P)=0,\quad h_{2\tau}+\boldsymbol{\nabla}\boldsymbol{\cdot}({\boldsymbol q}_2^T+{\boldsymbol q}_2^P)=0. \end{equation}
Here  $\tau$ is the non-dimensional time,
 \begin{gather} {\boldsymbol q}_1^T=g_{11}\boldsymbol{\nabla} a+g_{12}\boldsymbol{\nabla} b,\quad {\boldsymbol q}_2^T=g_{21}\boldsymbol{\nabla} a+g_{22}\boldsymbol{\nabla} b, \end{gather}
 \begin{gather} a=M(1-Bi h_1d),\quad b=Md\kappa, \end{gather}
 \begin{gather} g_{11}={-}\frac{1}{2}h_1^2,\quad g_{12}={-}\frac{1}{2}\alpha h_1^2, \end{gather}
 \begin{gather} g_{21}={-}\frac{1}{2}(2h_2-h_1)h_1,\quad g_{22}={-} \left[\frac{1}{2}\alpha\eta h_2^2+\frac{1}{2}\alpha(1-\eta)(2h_2-h_1)h_1\right], \end{gather}
 \begin{gather} d=[\kappa+Bih_1+Bi\kappa(h_2-h_1)]^{{-}1}; \end{gather}
 \begin{gather} {\boldsymbol q}_1^P=f_{11}\boldsymbol{\nabla} p_1+f_{12}\boldsymbol{\nabla} p_2,\quad {\boldsymbol q}_2^P=f_{21}\boldsymbol{\nabla} p_1+f_{22}\boldsymbol{\nabla} p_2, \end{gather}
 \begin{gather} p_1={-}\nabla^2h_1-\sigma\nabla^2h_2+Boh_1+Bo\rho(h_2-h_1)+{\rm \pi}_1(h_1,h_2), \end{gather}
 \begin{gather} p_2={-}\sigma\nabla^2h_2+Bo\rho h_2+{\rm \pi}_2(h_1,h_2); \end{gather}
 \begin{gather} f_{11}={-}\frac{1}{3}h_1^3,\quad f_{12}={-}\frac{1}{2}h_1^2(h_2-h_1), \end{gather}
 \begin{gather} f_{21}=\frac{1}{6}h_1^3-\frac{1}{2}h_1^2h_2,\quad f_{22}={-}(h_2-h_1)\left[\frac{1}{2}h_1 (2h_2-h_1)+\frac{\eta}{3}(h_2-h_1)^3\right]. \end{gather}
Note that
 \begin{equation} f_{21}=f_{11}+f_{12},\quad f_{22}=f_{12}-h_1(h_2-h_1)^2- \frac{\eta}{3}(h_2-h_1)^3. \end{equation}
In the case of a droplet on a liquid substrate, the thickness of the liquid layer 1 is macroscopic, while  $h_2-h_1$ is microscopic in the region of the precursor; therefore, one can take the non-dimensional disjoining pressure
 ${\rm \pi} _1$ (see (A32)) equal to zero. In the expression for
 ${\rm \pi} _2$, one can keep only the last term,
 $a_2/(h_2-h_1)^3$, where
 $a_2$ is the non-dimensional Hamaker constant (C1). In order to avoid the rupture of the precursor and keep its equilibrium thickness equal to
 $h_{\infty }=H_{\infty }/H_1^0$, we apply the following modified expression for the disjoining pressure:
 \begin{equation} {\rm \pi}_2=\frac{a_2}{(h_2-h_1)^3} \left[1-\left(\frac{h_{\infty}}{h_2-h_1}\right)^3\right]. \end{equation}
This corresponds to the minimum of the free energy of the film thickness at  $h_2-h_1=h_{\infty }$ (for details, see Craster & Matar Reference Craster and Matar2006; Pototsky et al. Reference Pototsky, Oron and Bestehorn2019).
Let us estimate the physical values of parameters needed for the observation of the phenomena described in the paper. Let us choose the following values of parameters:  $\eta _1=2.55\times 10^{-2}$ kg m
 $^{-1}$ s
 $^{-1}$,
 $H_1^0=5\times 10^{-6}\,{\rm m}$,
 $\sigma _1=7.6\times 10^{-3}\,{\rm N}\,{\rm m}^{-1}$, and take
 $L^*=5\times 10^{-5}\,{\rm m}$. Applying the definition of the Marangoni number (2.5), we find that the value
 $M=-4$ used in our computations corresponds to the temperature difference
 $T_g-T_s=1K$.
Note that time scale (2.1) is equal to  $1.7\times 10^{-1}\,{\rm s}$. Thus, the typical dimensional frequency of droplet oscillations observed in simulations is equal to
 $1.8\times 10^{-4}$ –
 $2.6\times 10^{-4}\,{\rm s}^{-1}$.
3. Numerical simulations
In the present section we discuss the nonlinear regimes observed in the case of a one-dimensional modulation of the local Marangoni number,
 \begin{equation} M(X)=\bar{M}\left(1+\delta_X\sin\frac{ 2{\rm \pi} X}{L}\right)=\bar{M}-\Delta_X\sin\frac{2{\rm \pi} X}{L}, \end{equation}
where  $\bar {M}<0$,
 $\delta _X>0$,
 $\Delta _X=|\bar {M}|\delta _X$.
3.1. Thermocapillary convection by homogeneous cooling
Let us describe briefly the results of the investigation of stability (i) in the system of two infinite liquid layers (Nepomnyashchy, Simanovskii & Legros Reference Nepomnyashchy, Simanovskii and Legros2012), and (ii) that of a droplet floating on a homogeneously cooled liquid substrate,  $\Delta _X=0$.
In the case of infinite layers, the evolution of small interface distortions  $\tilde {h}_j(t)\exp ({\rm i}kX)$, where
 $k$ is the disturbance wavenumber, is governed by the linear problem
 \begin{equation} \frac{{\rm d}\tilde{h}_j}{{\rm d}\tau}=\sum_{l=1}^2A_{jl}(k)\tilde{h}_l,\quad j=1,2, \end{equation}
where matrix  $A$ describes the hydrodynamic and thermal interaction between the deformations of interfaces through the flows and temperature field distortions. In a contradistinction to the isothermal case where that matrix can be transformed to a symmetric one, hence it has only real eigenvalues (Pototsky et al. Reference Pototsky, Bestehorn, Merkt and Thiele2005), in the non-isothermal case that matrix is asymmetric, due to the asymmetry of the interaction mediated by the thermocapillary flows, which are generated by the temperature inhomogeneities at the interfaces, hence, the eigenvalues can be complex. The analysis shows that in a certain interval of the values of the Biot number,
 $Bi_-< Bi< Bi_+$, an oscillatory instability takes place.
Let us emphasize that in a two-layer system the Marangoni convection can develop for either way of heating and cooling, depending on the system parameters and the wavenumber of the disturbance (Simanovskii & Nepomnyashchy Reference Simanovskii and Nepomnyashchy1993). For the system under consideration, there exists a certain value  $Bi_c$,
 $Bi_-< Bi_c< Bi_+$, such that the instability develops as
 $T_s>T_g$, if
 $Bi< Bi_c$, and as
 $T_s< T_g$, if
 $Bi>Bi_c$. The expressions for
 $Bi_-$,
 $Bi_+$ and
 $Bi_c$ have been obtained by Nepomnyashchy & Simanovskii (Reference Nepomnyashchy and Simanovskii2007).
The instability threshold is determined by the minimum admissible disturbance wavenumber: the larger the region, the lower the instability threshold.
In the case of a droplet on a liquid substrate, one has to take into account that in the absence of gravity, a liquid layer with a deformable interface is subject to a monotonic Marangoni instability for arbitrary small  $M>0$, i.e. for arbitrary weak heating from below (Scriven & Sternling Reference Scriven and Sternling1964). That instability is not saturable, and it leads to the rupture of the substrate layer. When a temperature gradient across the substrate layer is applied, the temperature on both droplet interfaces becomes inhomogeneous. The temperature disturbance caused by the droplet acts as ‘a seed’ of instability. Therefore, in the presence of the temperature gradient, one can expect the existence of a stable configuration containing a droplet on a layer flat on the infinity only if
 $M<0$, i.e. by cooling from below.
In the latter case, for sufficiently small values of  $|M|$, the thermocapillary convection in the droplet and the substrate is stationary and axisymmetric. With an increase of cooling from below, the droplet can become oscillatory unstable, if
 $Bi$ is within that appropriate interval indicated above. The instability corresponds to azimuthal wavenumber
 $m=1$, and it creates periodic oscillations characterized by the symmetry
 \begin{equation} h_j(X,Y,\tau+T/2)=h_j(L-Y,L-X,\tau),\quad j=1,2, \end{equation}
where  $T$ is the period of oscillations. At higher values of
 $|M|$, the intensive Marangoni convection leads to a significant change of the droplet shape: a trough near the centre of the droplet is developed, the components with
 $m>1$ become visible. The change in the droplet's shape is irreversible: by the decrease of
 $|M|$, the new shape of the droplet is retained. With a further decrease of
 $M$ convection becomes so intensive that the droplet is spread over the liquid substrate forming a liquid layer.
3.2. The influence of temperature modulation on the droplets
Let us consider now the case  $\Delta _X\neq 0$.
A moderate inhomogeneity of cooling changes the stationary shape of the interfaces of both liquid substrate and floating droplet. In the absence of the droplet the stationary shape of the substrate surface under the action of the inhomogeneous cooling (3.1) would be determined by the equation
 \begin{equation} g_{11}\frac{\partial a}{\partial X}+f_{11}\frac{\partial p_1}{\partial X}=0, \end{equation}
which is obtained by the corresponding reduction ( $h_2=h_1$,
 $\alpha =0$) of (2.8a,b). In the limit of strong cooling, when the thermocapillary contribution into the flow rate prevails, the substrate is stationary when the surface temperature
 $a$ is constant, which gives the expression for the substrate surface shape,
 \begin{equation} h_1(X)=\frac{1}{\widetilde{Bi}}\left(\frac{M(X)}{a}-1\right),\quad \widetilde{Bi}=\frac{Bi}{\kappa}=\frac{qH_1^0}{\kappa_1}. \end{equation}
Note that  $M(X)< a<0$. Thus, the substrate is thicker where cooling is stronger.
In the case of a two-layer system, the approximation of constant interface temperature,  $a={\rm const.}$ and
 $b={\rm const.}$, gives the following expressions for interface shapes:
 \begin{equation} h_1(X)=\frac{\kappa(M(X)-a)}{b Bi},\quad h_2(X)-h_1(X)=\frac{a-b}{b Bi}. \end{equation}
Let us emphasize however that formulae (3.6a,b) cannot be directly applied in the case of a floating droplet, where  $h_1$ and
 $h_2$ depend on both coordinates
 $X$ and
 $Y$. In the latter case, the shape of the interfaces has to be obtained numerically. Below we describe the results of simulations performed for the system of two immiscible liquids, fluorinert FC70 (liquid 1) and silicon oil 10 (liquid 2), formerly used in microgravity experiments (see, e.g. Géoris et al. Reference Géoris, Hennenberg, Lebon and Legros1999). That liquid system is characterized by the following set of parameters (Nepomnyashchy & Simanovskii Reference Nepomnyashchy and Simanovskii2012):
 $\eta =3.04$,
 $\kappa =0.522$,
 $\alpha =2$,
 $\rho =0.482$,
 $\sigma =2.6$ (the list of dimensional parameters is presented in Appendix B). The coefficients in (2.19) have been taken as
 $h_{\infty }=0.01$ and
 $a_2=3\times 10^{-6}$ (see Appendix C). Equations (2.7a,b)–(2.15) were discretized by central differences for spatial derivatives and solved using an explicit scheme with periodic boundary conditions in the computational region
 $L\times L = 240\times 240$ on the grid
 $80\times 80$. The verification of numerical computations was carried out by means of trial simulations on the grids
 $100\times 100$ and
 $120\times 120$; no qualitative changes have been observed. Some additional convergence tests can be found in figure 4 of Nepomnyashchy & Simanovskii (Reference Nepomnyashchy and Simanovskii2015), where one can see that the lines of
 $h_{max}(X,Y,\tau )$ obtained on different grids are almost indistinguishable. The steady and periodic oscillatory states have been obtained by simulations during at least
 $10^6$ non-dimensional time units. The change of the fields
 $h_j$,
 $j=1,2$, was less than
 $0.1\,\%$ in all the simulations. The time step typically changed between 0.00125 and 0.005, which is significantly below the linear scheme stability boundary. The simulations done with different time steps did not reveal any qualitative changes.
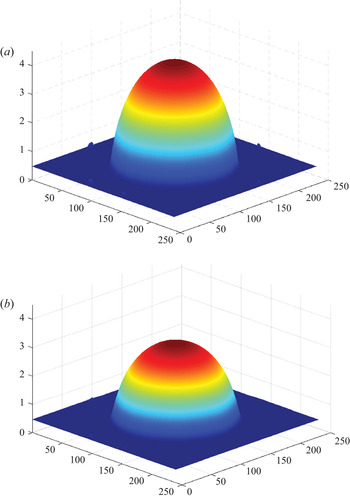
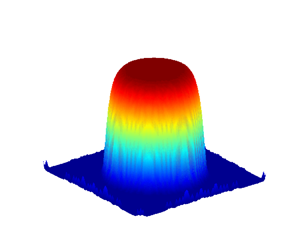
Let us describe the results of numerical simulations at  $\bar {M}=-2$. On the first step, we performed numerical simulations with
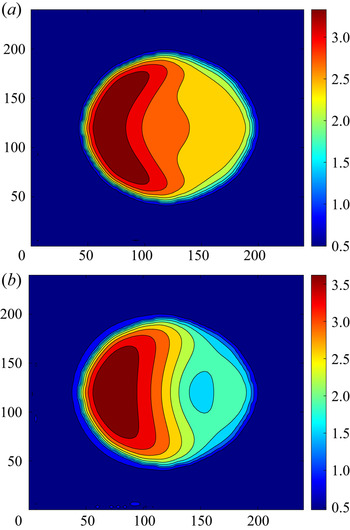
 $\Delta _X=0$ (see Nepomnyashchy & Simanovskii Reference Nepomnyashchy and Simanovskii2021) and obtained a round stationary droplet shown in figure 2. Then we switched on a horizontal temperature modulation,
 $\Delta _X=0.5$.
The stationary shapes of (a) interface  $h_2(X,Y)$ and (b) interface
 $h_1(X,Y)$ for
 $M=-2$,
 $Bo=0$,
 $Bi=20$,
 $\tau =10^6$.

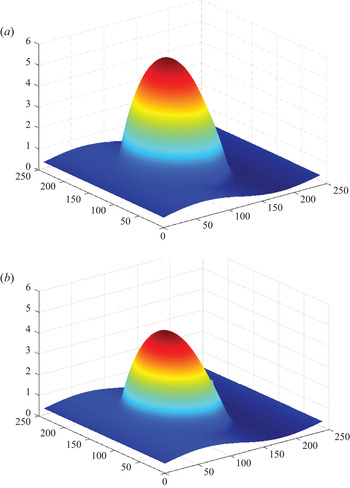
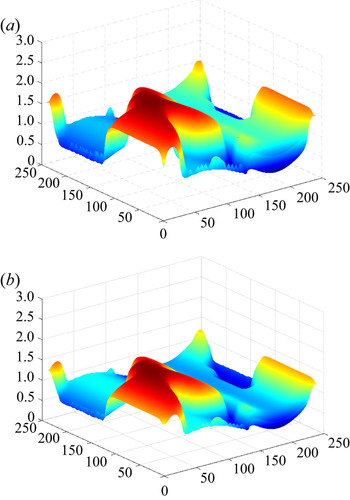
According to (3.1), the substrate temperature is lower than its mean value  $\bar {T}_s$ in the left part of the computational region,
 $0< X< L/2$, and it is higher than
 $\bar {T}_s$ for
 $L/2< X< L$. Hence, a thermocapillary flow in the substrate is directed leftward in the central part of the computational region,
 $L/4< X<3L/4$, while in the regions
 $0< X< L/4$ and
 $3L/4< X< L$ it is directed rightward. Therefore, the substrate becomes thicker in the region
 $0< X< L/2$ and thinner in the region
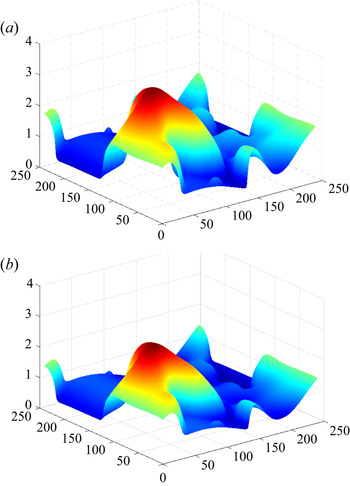
 $L/2< X< L$. That deformation of the liquid substrate surface is clearly seen in figure 3.
The shapes of (a)  $h_2(X,Y,\tau )$ and (b)
 $h_1(X,Y,\tau )$ for
 $\bar {M}=-2$,
 $\Delta _X=0.5$,
 $Bo=0$,
 $Bi=20$,
 $\tau =1\times 10^6$.

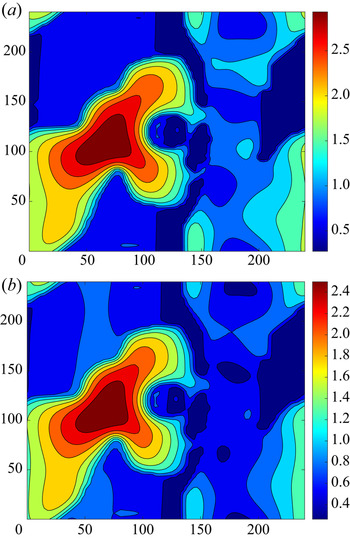
The modulation (3.1) of the local Marangoni number violates the rotational symmetry of the problem. The Marangoni stresses acting on the droplet's interfaces in different directions are not balanced anymore. Under the action of the thermocapillary flow in the substrate directed leftward, the liquid in the droplet moves to the left changing its shape and height. Finally, we get the steady droplet with the maximum, shifted to the left part of the computational region (see figure 3), where the local value of  $|M|$ is higher (i.e. into the cooler part of the region).
Let us consider in more detail the stages of the evolution of the initially round droplet (see figure 2) under the action of the temperature modulation at a larger value of the average Marangoni number ( $\bar {M}=-2.5$;
 $\Delta _X=0.5$). In the absence of the modulation that value of
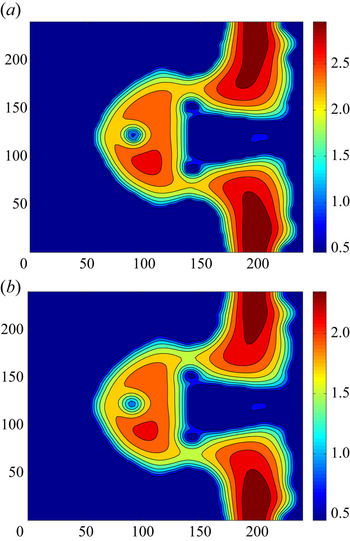
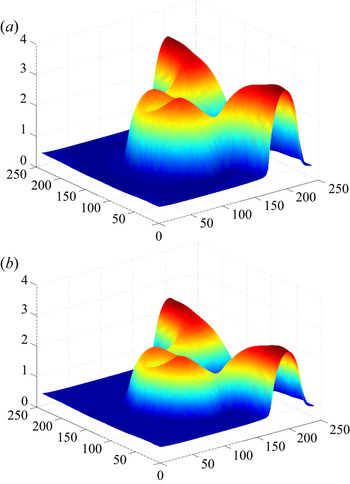
 $\bar {M}$ is beyond the oscillatory instability threshold. On the early stages, the liquid in the droplet moves slowly leftward; see figures 4(a,b). One can see a visible change of the droplet's shape between figures 4(a) and 4(b). The division of the droplet and the creation of the satellite is presented in figures 4(c) and 4(d). At
 $\tau \geq 10\,000$, the further evolution of the droplet and the equilibration takes place. A snapshot of the fields of (a)
 $h_2(X,Y,\tau )$ and (b)
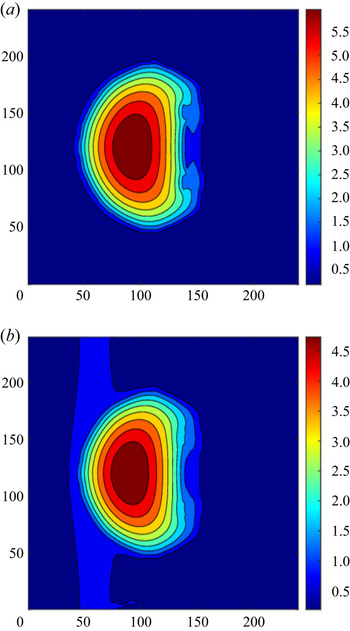
 $h_1(X,Y,\tau )$ at the equilibrium stage is shown in figure 5. One can see that the droplet becomes significantly shorter in the
 $X$-direction. The inhomogeneity of the local Marangoni number enhances the threshold value of
 $|\bar {M}|$ of the oscillatory instability: at
 $\bar {M}=-2.5$, the oscillatory instability is not developed though the value of
 $|M(X)|$ in the region, where the droplet is located, is even higher than 2.5. As explained above, the instability threshold of longwave oscillatory instability depends on the wavelength of the disturbance: the smaller the wavelength, the higher the threshold, due to enhanced dissipative factors. Apparently, the decrease of the horizontal size of the droplet hinders the development of oscillations. Again, the shapes of the liquid surfaces outside the droplet are also changed under the action of the thermocapillary stresses: the thickness of the substrate is higher in the region of higher
 $|M(X)|$ (see figure 5).
The fields of  $h_2(X,Y,\tau )$ for
 $\bar {M}=-2.5$,
 $\Delta _X=0.5$,
 $Bo=0$,
 $Bi=20$; (a)
 $\tau =100$; (b)
 $\tau =1000$; (c)
 $\tau =4000$; (d)
 $\tau =10\,000$.

A snapshot of the fields of (a)  $h_2(X,Y,\tau )$ and (b)
 $h_1(X,Y,\tau )$ for
 $\bar {M}=-2.5$,
 $\Delta _X=0.5$,
 $Bo=0$,
 $Bi=20$,
 $\tau =1\times 10^6$.

Now, let us consider the action of the spatial temperature modulation on the oscillatory flows. As the initial condition, we take the fields of  $h_1$ and
 $h_2$ corresponding to the oscillatory regime with
 $\bar {M}=-2.5$;
 $\Delta _X=0$. With the growth of
 $\Delta _X$ (at
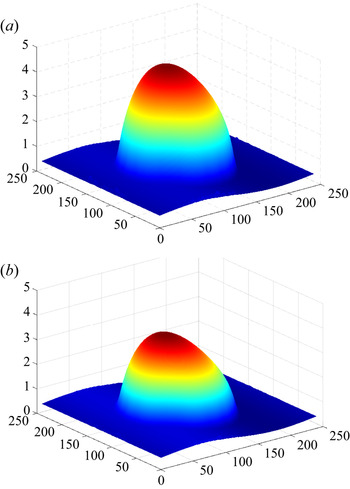
 $\Delta _X \geq 0.25$), the oscillations are suppressed. The shape of the steady droplet with the maximum shifted to the left part of the computational region is presented in figure 6.
The shapes of (a)  $h_2(X,Y,\tau )$ and (b)
 $h_1(X,Y,\tau )$ for
 $\bar {M}=-2.5$,
 $\Delta _X=0.25$,
 $Bo=0$,
 $Bi=20$,
 $\tau =1\times 10^6$ obtained with initial conditions corresponding to an oscillatory regime.

When the spatial temperature modulation is switched off, the oscillations are restored, but the change of the droplet shape is irreversible. Let us take the steady state presented in figure 6 as an initial condition and switch off the modulation (we put  $\Delta _X=0$). We observe oscillations of a droplet shown in figure 7. Because the problem is not symmetric with respect to translations along the axis
 $X$, relation (3.3) is violated, hence, the adjacent maximum values of
 $h_{max,m}$,
 $m=1,2$, are not equal. Oscillations presented in figure 7 have period
 $T=34\,210$. Since we consider the region with periodic boundary conditions, one can see the appearance of a finger that moves ‘vertically’ (i.e. along the region with the maximum value of the Marangoni number) and meets the fingers of the neighbour drops at the boundary of the computational region (see figures 8 and 9).
The oscillations of  $h_{max,2}(\tau )$ (solid line) and
 $h_{max,1}(\tau )$ (dashed line) for
 $\bar {M}=-2.5$,
 $\Delta _X=0,$
 $Bo=0$,
 $Bi=20$.

A snapshot of the fields of (a)  $h_2(X,Y,\tau )$ and (b)
 $h_1(X,Y,\tau )$ for
 $\bar {M}=-2.5$,
 $\Delta _X=0,$
 $Bo=0$,
 $Bi=20$,
 $\tau =1\times 10^6$.

The shapes of (a)  $h_2(X,Y,\tau )$ and (b)
 $h_1(X,Y,\tau )$ for
 $\bar {M}=-2.5$,
 $\Delta _X=0$,
 $Bo=0$,
 $Bi=20$,
 $\tau =1\times 10^6$.

Let us take now  $\bar {M}=-4$. With the growth of
 $\Delta _X$ (at
 $\Delta _X=0.1$), the periodic oscillations with an essentially different adjacent maxima develop in the system (see figure 10); the period of oscillations
 $T=49\,760$. The snapshots of the fields of (a)
 $h_2(X,Y,\tau )$ and (b)
 $h_1(X,Y,\tau )$ at different instants of time, corresponding to adjacent maxima are presented in figures 11 and 12. The small and big maxima of
 $h_{max,j}(\tau )$
 $j=1,2$, correspond to different spatial points.
The oscillations of  $h_{max,2}(\tau )$ (solid line) and
 $h_{max,1}(\tau )$ (dashed line) for
 $\bar {M}=-4$,
 $\Delta _X=0.1$,
 $Bo=0$,
 $Bi=20$.

A snapshot of the fields of (a)  $h_2(X,Y,\tau )$ and (b)
 $h_1(X,Y,\tau )$ for
 $\bar {M}=-4$,
 $\Delta _X=0.1$,
 $Bo=0$,
 $Bi=20$,
 $\tau =807\,730$.

A snapshot of the fields of (a)  $h_2(X,Y,\tau )$ and (b)
 $h_1(X,Y,\tau )$ for
 $\bar {M}=-4$,
 $\Delta _X=0.1$,
 $Bo=0$,
 $Bi=20$,
 $\tau =832\,850$.

With an increase of  $\Delta _X$ (
 $\Delta _X=0.25$), the oscillations of
 $h_{max,m}$,
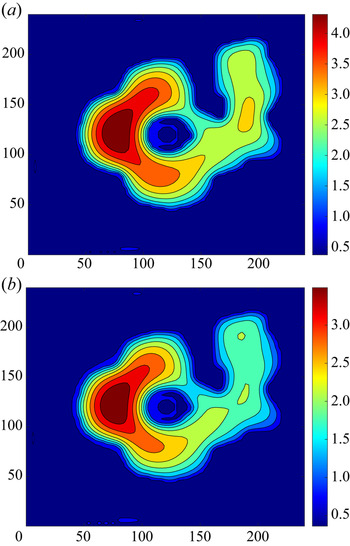
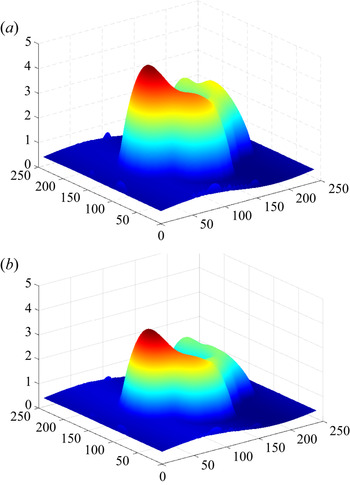
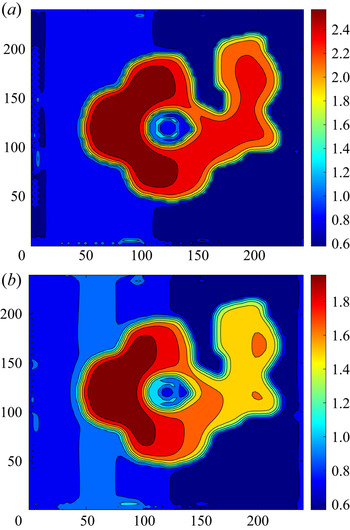
 $m=1,2$, become of a rather complex form (see figure 13). The main droplet is destroyed into separate parts (see figures 14–16). One can see some kind of recombination of the droplet parts during an oscillatory process (figures 14 and 15). With an increase of modulation (
 $\Delta _X=0.5$), the values of
 $h_{max,m}$,
 $m=1,2$, essentially decrease (see figure 17). Probably, it can be explained by the fact that during the droplet's motion to its new place some liquid is left in the ‘tail’, therefore, the ‘main’ droplet becomes smaller. The droplet has a rather complex shape (see figures 18 and 19).
The oscillations of  $h_{max,2}(\tau )$ (solid line) and
 $h_{max,1}(\tau )$ (dashed line) for
 $\bar {M}=-4$,
 $\Delta _X=0.25$,
 $Bo=0$,
 $Bi=20$.

A snapshot of the fields of (a)  $h_2(X,Y,\tau )$ and (b)
 $h_1(X,Y,\tau )$ for
 $\bar {M}=-4$,
 $\Delta _X=0.25$,
 $Bo=0$,
 $Bi=20$,
 $\tau =1\times 10^6$.

A snapshot of the fields of (a)  $h_2(X,Y,\tau )$ and (b)
 $h_1(X,Y,\tau )$ for
 $\bar {M}=-4$,
 $\Delta _X=0.25$,
 $Bo=0$,
 $Bi=20$,
 $\tau =1\,003\,500$.

The shapes of (a)  $h_2(X,Y,\tau )$ and (b)
 $h_1(X,Y,\tau )$ for
 $\bar {M}=-4$,
 $\Delta _X=0.25$,
 $Bo=0$,
 $Bi=20$,
 $\tau =1\times 10^6$.

The oscillations of  $h_{max,2}(\tau )$ (solid line) and
 $h_{max,1}(\tau )$ (dashed line) for
 $\bar {M}=-4$,
 $\Delta _X=0.5$,
 $Bo=0$,
 $Bi=20$.

For sufficiently large values of  $|\bar {M}|$ and
 $\Delta _X$, irregular oscillations have been obtained.
3.3. The influence of gravity on the droplet dynamics
Now, let us consider the action of gravity on the droplets. If we take the round stationary droplet obtained with  $\bar {M}=-2$;
 $\Delta _X=0;$
 $Bo=0$ as the initial condition (see figure 2), under the action of gravity (
 $Bo=0.1$) the droplet is essentially flattened (see figure 20).
A snapshot of the fields of (a)  $h_2(X,Y,\tau )$ and (b)
 $h_1(X,Y,\tau )$ for
 $\bar {M}=-4$,
 $\Delta _X=0.5$,
 $Bo=0$,
 $Bi=20$,
 $\tau =1\times 10^6$.

The shapes of (a)  $h_2(X,Y,\tau )$ and (b)
 $h_1(X,Y,\tau )$ for
 $\bar {M}=-4$,
 $\Delta _X=0.5$,
 $Bo=0$,
 $Bi=20$,
 $\tau =1\times 10^6$.

The shapes of (a)  $h_2(X,Y,\tau )$ and (b)
 $h_1(X,Y,\tau )$ for
 $\bar {M}=-2$,
 $\Delta _X=0$,
 $Bo=0.1$,
 $Bi=20$,
 $\tau =1\times 10^6$.

Let us take as an initial condition the state presented in figure 4(a) ( $\bar {M}=-2.5$;
 $\Delta _X=0.5$;
 $Bo=0$). At
 $Bo=0.1$, an essentially flattened droplet moves to the left side of the computational region. The intermediate stages of the transition process are presented in figures 21(a) and 21(b). One can compare figures 21(a) and 4(b); 21(b) and 4(c). The isolines and the shapes of the interfaces, corresponding to the final equilibrium state are shown in figures 22 and 23 (cf. for example, figures 22 and 5). For the larger values of
 $|\bar {M}|$, under the action of gravity the stationary droplets are also flattened significantly (see figures 24 and 25).
The fields of  $h_2(X,Y,\tau )$ for
 $\bar {M}=-2.5$,
 $\Delta _X=0.5$,
 $Bo=0.1$,
 $Bi=20$; (a)
 $\tau =1000$; (b)
 $\tau =4000$.

A snapshot of the fields of (a)  $h_2(X,Y,\tau )$ and (b)
 $h_1(X,Y,\tau )$ for
 $\bar {M}=-2.5$,
 $\Delta _X=0.5$,
 $Bo=0.1$,
 $Bi=20$,
 $\tau =1\times 10^6$.

The shapes of (a)  $h_2(X,Y,\tau )$ and (b)
 $h_1(X,Y,\tau )$ for
 $\bar {M}=-2.5$,
 $\Delta _X=0.5$,
 $Bo=0.1$,
 $Bi=20$,
 $\tau =1\times 10^6$.

A snapshot of the fields of (a)  $h_2(X,Y,\tau )$ and (b)
 $h_1(X,Y,\tau )$ for
 $\bar {M}=-4$,
 $\Delta _X=0.25$,
 $Bo=0.25$,
 $Bi=20$,
 $\tau =1\times 10^6$.

The shapes of (a)  $h_2(X,Y,\tau )$ and (b)
 $h_1(X,Y,\tau )$ for
 $\bar {M}=-4$,
 $\Delta _X=0.5$,
 $Bo=0.25$,
 $Bi=20$,
 $\tau =1\times 10^6$.

4. Conclusions
The dynamics of a droplet on a liquid substrate in the case of an inhomogeneous cooling from below has been investigated. The problem is studied numerically in the framework of longwave amplitude equations.
A number of phenomena have been observed. The non-homogeneous cooling creates a disbalance of thermocapillary stresses that leads to the redistribution of the liquids in the droplet and in the substrate: they become thicker in the colder region and thinner in the hotter region. The oscillatory instability of a two-liquid system formerly found for liquid layers takes place also in the case of a slender droplet floating on the liquid substrate. That instability manifests itself as a periodic or irregular change of the droplet shape. The gravity flattens the droplet and freezes the droplet's shape suppressing the oscillations.
While some non-stationary phenomena were formerly observed in droplets under laser heating (Rybalko et al. Reference Rybalko, Magome and Yoshikawa2004; Song et al. Reference Song, Moon, Lee, Kim and Pak2014) and by evaporative cooling (Buffone Reference Buffone2019), the oscillations predicted in the present paper have not yet been observed in experiments.
Funding
This research was supported by the Israel Science Foundation (grant no. 843/18).
Declaration of interests
The authors report no conflict of interest.
Appendix A. Derivation of the evolution equations for deformations of interfaces
In this appendix we describe briefly the way of the derivation of the evolution equations for interfaces from the original system of equations and boundary conditions.
A.1. Original boundary value problem
For the sake of simplicity, on the first stage we disregard the gravity and the disjoining pressures.
The complete system of nonlinear equations governing Marangoni convection is written in the following form (Simanovskii & Nepomnyashchy Reference Simanovskii and Nepomnyashchy1993):
 \begin{gather} \frac{\partial {\boldsymbol v}_j}{\partial t}+({\boldsymbol v}_j\boldsymbol{\cdot}\boldsymbol{\nabla}){\boldsymbol v}_j={-}\frac{1}{\rho_j}\boldsymbol{\nabla} p_j+\nu_j\Delta {\boldsymbol v}_j, \end{gather}
 \begin{gather} \frac{\partial T_j}{\partial t}+{\boldsymbol v}_j\boldsymbol{\cdot}\boldsymbol{\nabla} T_j=\chi_j\Delta T_j, \end{gather}
 \begin{gather} \boldsymbol{\nabla}\boldsymbol{\cdot} {\boldsymbol v}_j=0,\quad j=1,2. \end{gather}
Here,  ${\boldsymbol v}_j$ and
 $p_j$ are the velocity and the difference between the overall pressure and the atmospheric pressure in the
 $m$th liquid, correspondingly. The boundary conditions on the rigid boundary are
 \begin{equation} {\boldsymbol v}_1=0,\quad T_1=T_s(x,y);\quad {\rm at}\ z=0. \end{equation}
On the deformable interface  $z=H_1$, the following boundary conditions hold: the balance of normal stresses,
 \begin{equation} p_2-p_1+2\sigma_1K_1 =\left[-\eta_1\left(\frac{\partial v_{1i}}{\partial x_k}+\frac{\partial v_{1k}}{\partial x_i}\right)+\eta_2\left(\frac{\partial v_{2i}}{\partial x_k}+\frac{\partial v_{2k}}{\partial x_i}\right)\right]n_{1i}n_{1k};\quad i,k=1,2,3; \end{equation}
the balance of tangential stresses,
 \begin{align} &\left[-\eta_1\left(\frac{\partial v_{1i}}{\partial x_k}+\frac{\partial v_{1k}}{\partial x_i}\right)+\eta_2\left(\frac{\partial v_{2i}}{\partial x_k}+\frac{\partial v_{2k}}{\partial x_i}\right)\right]\tau_{1i}^{(l)}n_{1k}\nonumber\\ &\quad -\alpha_1\tau_{1i}^{(l)}\frac{\partial T_1}{\partial x_i}=0,\quad l=1,2;\ i,k=1,2,3; \end{align}
the continuity of the velocity field,
 \begin{equation} {\boldsymbol v}_{1}={\boldsymbol v}_{2}; \end{equation}
the kinematic equation for the interface motion,
 \begin{equation} \frac{\partial H_1}{\partial t}+v_{1x}\frac{\partial H_1}{\partial x}+v_{1y}\frac{\partial H_1}{\partial y}=v_{1z}; \end{equation}
the continuity of the temperature field,
 \begin{equation} T_1=T_2; \end{equation}
and the balance of normal heat fluxes,
 \begin{equation} \left(\kappa_1\frac{\partial T_1}{\partial x_i}-\kappa_2\frac{\partial T_2}{\partial x_i}\right)n_{1i}=0. \end{equation}
We disregard the viscosity of the gas, which is small compared with the liquids’ viscosities, and impose the following boundary conditions on the deformable interface  $z=H_2$:
 \begin{gather} -p_2+2\sigma_2K_2 ={-}\eta_2\left(\frac{\partial v_{2i}}{\partial x_k}+\frac{\partial v_{2k}}{\partial x_i}\right) n_{2i}n_{2k}, \end{gather}
 \begin{gather} -\eta_2\left(\frac{\partial v_{2i}}{\partial x_k}+\frac{\partial v_{2k}}{\partial x_i}\right) \tau_{2i}^{(l)}n_{2k}- \alpha_2\tau_{2i}^{(l)}\frac{\partial T_3}{\partial x_i}=0,\quad l=1,2, i,k=1,2,3, \end{gather}
 \begin{gather} \frac{\partial H_2}{\partial t}+v_{2x}\frac{\partial H_2}{\partial x}+v_{2y}\frac{\partial H_2}{\partial y}=v_{2z}. \end{gather}
In the formulae presented above,  $K_1$ and
 $K_2$ are the mean curvatures,
 ${\boldsymbol {n}_1}$ and
 ${\boldsymbol {n}_2}$ are the normal vectors and
 $\boldsymbol {\tau }_1^{(l)}$ and
 $\boldsymbol {\tau }_2^{(l)}$ are the tangential vectors of the lower and upper interfaces. In the quantities with two subscripts, the first subscript corresponds to the number of the liquid (
 $m=1,2$) and the second subscript determines the number of the Cartesian coordinate (
 $i,k=1,2,3$;
 $x_1=x$,
 $x_2=y$,
 $x_3=z$). The usual summation convention is applied. For a heat flux on the liquid–gas interface, we use an empirical condition,
 \begin{equation} \kappa_2\frac{\partial T_2}{\partial x_i} n_{2i}={-}q(T_2-T_g), \end{equation}
where  $q$ is the heat exchange coefficient which is assumed to be constant.
Below we assume that the dependence of interfacial tensions on the temperature is relatively weak and can be neglected in the boundary conditions for normal stresses (but not in those for tangential stresses where it is the source of a thermocapillary motion).
A.2. Longwave approach: scaling
We assume that the characteristic spatial scale of the temperature modulation of the substrate is much larger than the thickness of the layer, i.e. the temperature modulation depends on the scaled coordinates  $\tilde {X}=\epsilon x$ and
 $\tilde {Y}=\epsilon y$,
 $\epsilon \ll 1$, rather than on
 $x$ and
 $y$. Later on, we denote the vectors
 $(\tilde {X},\tilde {Y})$ as
 $\tilde {\boldsymbol {X}}$ and
 $(\partial /\partial \tilde {X},\partial /\partial \tilde {Y})$ as
 $\widetilde {\boldsymbol {\nabla }}$.
We intend to apply the longwave approach for studying the instability phenomena. That is possible if the physical system is subject to a longwave instability rather than a shortwave Marangoni instability leading to creation of short-scale hexagonal cells. There exist several types of longwave Marangoni instabilities. For instance, the characteristic horizontal scale of patterns is large near the instability threshold in the case of a small Biot number (Sivashinsky Reference Sivashinsky1982; Knobloch Reference Knobloch1990). Another kind of Marangoni instability, which is characterized by a large wavelength near the threshold, develops in thin films or under microgravity conditions (Scriven & Sternling Reference Scriven and Sternling1964).
Below we apply the formal asymptotic expansions of variables in powers of  $\epsilon$. The appropriate scaling of variables for a long-scale flow governed by system (A1)–(A14) is as follows:
 \begin{equation} (v_{jx},v_{jy})=\epsilon{\boldsymbol V}_j+o(\epsilon),\;v_{jz}=\epsilon^2W_j+o(\epsilon^2),\quad p_j=P_j+o(\epsilon^2);\ m=1,2. \end{equation}
The appropriate rescaling of time is  $\tilde {\tau }=\epsilon ^2t$.
A.3. Thermocapillary flow generated by deformations of interfaces
Solving the system of equations and boundary conditions at the leading order in  $\epsilon$, we obtain expressions for the temperature fields,
 \begin{gather} T_1({ \tilde{\boldsymbol{X}}},z,\tilde{\tau})=T_s({ \tilde{\boldsymbol{X}}})-(T_s({ \tilde{\boldsymbol{X}}})-T_g)D({ \tilde{\boldsymbol{X}}},\tilde{\tau})q\kappa_2z; \end{gather}
 \begin{gather} T_2({ \tilde{\boldsymbol{X}}},z,\tilde{\tau})=T_s({ \tilde{\boldsymbol{X}}})-(T_s({ \tilde{\boldsymbol{X}}})-T_g)D({ \tilde{\boldsymbol{X}}},\tilde{\tau})q[(\kappa_2-\kappa_1)H_1({ \tilde{\boldsymbol{X}}},\tilde{\tau})+\kappa_1z], \end{gather}
where
 \begin{equation} D({ \tilde{\boldsymbol{X}}},\tilde{\tau})=[\kappa_1\kappa_2+q(\kappa_2-\kappa_1)H_1({ \tilde{\boldsymbol{X}}},\tilde{\tau})+q\kappa_1H_2({ \tilde{\boldsymbol{X}}},\tilde{\tau})]^{{-}1}. \end{equation}
Therefore, the temperature on the interface between liquids is
 \begin{equation} A({\tilde{\boldsymbol{X}}},\tilde{\tau})=T_1(\tilde{X},H_1(\tilde{X},\tilde{\tau})= T_s({\tilde{\boldsymbol{X}}})- (T_s({\tilde{\boldsymbol{X}}})-T_g)D({\tilde{\boldsymbol{X}}},\tilde{\tau})q\kappa_2 H_1({\tilde{\boldsymbol{X}}},\tilde{\tau}); \end{equation}
hence,
 \begin{equation} A-T_g=(T_s-T_g)(1-q\kappa_2H_1D), \end{equation}
and the temperature on the upper surface is
 \begin{equation} B({\tilde{\boldsymbol{X}}},\tilde{\tau})=T_2(\tilde{X},H_2(\tilde{X},\tilde{\tau}))= T_s({\tilde{\boldsymbol{X}}})- (T_s({\tilde{\boldsymbol{X}}})\!-\!T_g)D({\tilde{\boldsymbol{X}}})q [(\kappa_2\!-\!\kappa_1)H_1({\tilde{\boldsymbol{X}}})+ \kappa_1H_2({\tilde{\boldsymbol{X}}})]; \end{equation}
hence,
 \begin{equation} B-T_g=(T_s-T_g)\kappa_1\kappa_2D. \end{equation}
The horizontal components of the flow velocities  ${\boldsymbol V}_m^T$ (
 $m=1,2$) generated by the thermocapillary stresses are
 \begin{gather} {\boldsymbol V}_1^T={-}\left(\frac{\alpha_1}{\eta_1}\widetilde{\boldsymbol{\nabla}}A+ \frac{\alpha_2}{\eta_1}\widetilde{\boldsymbol{\nabla}}B\right)z, \end{gather}
 \begin{gather} {\boldsymbol V}_2^T={-}\frac{\alpha_1}{\eta_1}H_1\widetilde{\boldsymbol{\nabla}}A- \alpha_2\left(\frac{z-H_1}{\eta_2}+\frac{H_1}{\eta_1}\right) \widetilde{\boldsymbol{\nabla}}B, \end{gather}
and the flow rates produced by the thermocapillary effect are
 \begin{gather} {\tilde{\boldsymbol{Q}}}_1^T=\int_0^{H_1}{\boldsymbol V}_1\,{\rm d}z=G_{11} \widetilde{\boldsymbol{\nabla}}(\alpha_1 A)+G_{12} \widetilde{\boldsymbol{\nabla}}(\alpha_2 B), \end{gather}
 \begin{gather} \tilde{\boldsymbol{Q}}_2^T=\int_0^{H_1}{\boldsymbol V}_1\,{\rm d}z+\int_{H_1}^{H_2}{\boldsymbol V}_2\,{\rm d}z=G_{21}\widetilde{\boldsymbol{\nabla}}(\alpha_1A) +G_{22} \widetilde{\boldsymbol{\nabla}}(\alpha_2B), \end{gather}
where
 \begin{gather} G_{11}={-}\frac{H_1^2}{2\eta_1},\quad G_{12}={-} \frac{H_1^2}{2\eta_1}, \end{gather}
 \begin{gather} G_{21}={-}\frac{H_1(2H_2-H_1)}{2\eta_1},\quad G_{22}={-}\frac{1}{2\eta_1\eta_2}[H_2^2\eta_1+ (2H_2-H_1)H_1(\eta_2-\eta_1)]. \end{gather}
The evolution of a heated two-layer film under the action of the thermocapillary effect is governed by the closed system of equations
 \begin{equation} H_{1\tilde{\tau}}+\widetilde{\boldsymbol{\nabla}}\boldsymbol{\cdot}{\boldsymbol Q}_1^T=0,\quad H_{2\tilde{\tau}}+\widetilde{\boldsymbol{\nabla}}\boldsymbol{\cdot}{\boldsymbol Q}_2^T=0. \end{equation}
A.4. Flows created by interfacial tensions, gravity and disjoining pressures
We do not intend to impose any restrictions on the values of the Marangoni and Biot numbers. Even far from the instability threshold, the longwave approach is justified if the interfacial tensions are strong. In the case of infinite horizontal layers, the linear stability theory predicts that the disturbances are unstable for wavenumbers  $k^2< k_m^2$, where
 $k_m^2$ is inversely proportional to the interfacial tensions. Therefore, following Fisher & Golovin (Reference Fisher and Golovin2005), we retain the Laplacian pressures at the leading order of the asymptotic expansions.
The Laplacian, hydrostatic and disjoining pressures form together the following fields of pressures in a two-layer film:
 \begin{gather} P_1={-}\varSigma_1\widetilde{\nabla}^2H_1-\varSigma_2\widetilde{\nabla}^2H_2+\rho_1gH_1+ \rho_2g(H_2-H_1) +\varPi_1(H_1,H_2), \end{gather}
 \begin{gather} P_2={-}\varSigma_2\widetilde{\nabla}^2H_2+\rho_2gH_2+\varPi_2(H_1,H_2). \end{gather}
Note that though  $\widetilde {\nabla }^2H_j=O(\epsilon ^2)$ for longwave deformations, the Laplacian pressures are included (see the explanation above). Formally, that corresponds to
 $k^2\sim k_m^2\sim \varSigma _1^{-1}\sim \varSigma _2^{-1}=O(\epsilon ^2)$. If only the van der Waals intermolecular forces are taken into account, then disjoining pressure can be written as
 \begin{gather} \varPi_1(H_1,H_2)=\frac{A_0-A_1-A_2}{6{\rm \pi} H_2^3}+\frac{A_1}{6{\rm \pi} H_1^3}, \end{gather}
 \begin{gather} \varPi_2(H_1,H_2)=\frac{A_0-A_1-A_2}{6{\rm \pi} H_2^3}+\frac{A_2}{6{\rm \pi}(H_2-H_1)^3}. \end{gather}
Here  $A_0$,
 $A_1$ and
 $A_2$ are Hamaker constants characterizing the interactions between the solid substrate and the gas across the two layers, between the solid substrate and an infinite layer of liquid 2 across liquid 1, and between the gas phase and an infinite layer of liquid 1 across liquid 2, correspondingly (see Fisher & Golovin Reference Fisher and Golovin2005).
The pressure gradients create flows with the flow rates
 \begin{equation} \tilde{\boldsymbol{Q}}_1^P=F_{11}\widetilde{\nabla}P_1+F_{12}\widetilde{\nabla}P_2,\,\tilde{\boldsymbol{Q}}_2^P=F_{21}\widetilde{\boldsymbol{\nabla}}P_1+F_{22}\widetilde{\boldsymbol{\nabla}}P_2, \end{equation}
where pressures  $P_1$ and
 $P_2$ are determined by expressions (A30), (A31), and the mobility functions are
 \begin{gather} F_{11}={-}\frac{1}{3\eta_1}H_1^3;\quad F_{12}={-}\frac{1}{2\eta_1}H_1^2(H_2-H_1); \end{gather}
 \begin{gather} F_{21}=\frac{1}{6\eta_1}H_1^3-\frac{1}{2\eta_1}H_1^2H_2; \end{gather}
 \begin{gather} F_{22}={-}(H_2-H_1)\left[\frac{1}{2\eta_1}H_1(2H_2-H_1)- \frac{1}{3\eta_2}(H_2-H_1)^2\right]. \end{gather}
Finally, we obtain the following evolution equations:
 \begin{equation} H_{1\tilde{\tau}}+\widetilde{\boldsymbol{\nabla}}\boldsymbol{\cdot}(\tilde{\boldsymbol{Q}}_1^T+\tilde{\boldsymbol{Q}}_1^P)=0,\quad H_{2\tilde{\tau}}+\widetilde{\boldsymbol{\nabla}}\boldsymbol{\cdot}(\tilde{\boldsymbol{Q}}_2^T+\tilde{\boldsymbol{Q}}_2^P)=0. \end{equation}
The asymptotic expansions and rescaling of the variables have allowed us to calculate the total flow rates and derive the closed equations governing the temporal evolution of the interface shapes. Now we can return to original variables and rewrite (A38a,b) as
 \begin{gather} \frac{\partial H_1}{\partial t}+\boldsymbol{\nabla}\boldsymbol{\cdot}{\boldsymbol Q}_1=0,\quad \frac{\partial H_2}{\partial t}+\boldsymbol{\nabla}\boldsymbol{\cdot}{\boldsymbol Q}_2=0, \end{gather}
 \begin{gather} {\boldsymbol Q}_1=G_{11}\boldsymbol{\nabla}(\alpha_1 A)+G_{12}\boldsymbol{\nabla}(\alpha_2 B)+F_{11}\boldsymbol{\nabla} P_1+F_{12}\boldsymbol{\nabla} P_2, \end{gather}
 \begin{gather} {\boldsymbol Q}_2=G_{21}\boldsymbol{\nabla}(\alpha_1 A)+G_{22}\boldsymbol{\nabla}(\alpha_2 B)+F_{21}\boldsymbol{\nabla} P_1+F_{22}\boldsymbol{\nabla} P_2, \end{gather}
where the coefficients  $G_{ij}$ and
 $F_{ij}$ are determined by formulae (A27), (A28), (A35)–(A37).
In the main text of the paper, we use (A39a,b)–(A41) as the basic equations governing the problem.
Appendix B. The list of dimensional parameters
The system of liquids under consideration was used in microgravity experiments (see, e.g. Géoris et al. Reference Géoris, Hennenberg, Lebon and Legros1999), and its physical parameters are well known:  $\eta _1=2.55\times 10^{-2}$ kg m
 $^{-1}$ s
 $^{-1}$,
 $\eta _2=8.40\times 10^{-3}$ kg m
 $^{-1}$ s
 $^{-1}$,
 $\kappa _1=7.00\times 10^{-2}$ J m
 $^{-1}$ s
 $^{-1}$ K
 $^{-1}$,
 $\kappa _2=0.134$ J m
 $^{-1}$ s
 $^{-1}$ K
 $^{-1}$,
 $\rho _1=1.94\times 10^3$ kg m
 $^{-3}$,
 $\rho _2=0.935\times 10^3$ kg m
 $^{-3}$,
 $\sigma _1^0=7.6\times 10^{-3}$ N m
 $^{-1}$,
 $\sigma _2^0=1.97\times 10^{-2}$ N m
 $^{-1}$,
 $\alpha _1=3\times 10^{-5}$ N m
 $^{-1}$ K
 $^{-1}$,
 $\alpha _2=6\times 10^{-5}$ N m
 $^{-1}$ K
 $^{-1}$.
Appendix C. Estimate of parameter  $a_2$

The non-dimensional Hamaker constant  $a_2$ can be calculated using the formula (Nepomnyashchy & Simanovskii Reference Nepomnyashchy and Simanovskii2007)
 \begin{equation} a_2=\frac{A_2(L^*)^2}{6{\rm \pi}\sigma_1^0(H_1^0)^4}, \end{equation}
where  $A_2$ is the corresponding dimensional Hamaker constant which is typically of the order of
 $10^{-19}\,{\rm N}\,{\rm m}$. Let us consider a film with
 $H_1^0=5\times 10^{-6}\,{\rm m}$ with a typical value of the surface tension
 $\sigma _1^0=7\times 10^{-3}\,{\rm N}\,{\rm m}^{-1}$, and choose
 $L^*=5\times 10^{-5}\,{\rm m}$. Then formula (C1) gives
 $a_2=3\times 10^{-6}$.