I. INTRODUCTION
The instrumented indentation technique (or nanoindentation) has become a ubiquitous tool for the characterization of mechanical properties of materials at micro- and nano-scales. It can provide resolution of the load and penetration of depth down to micro-Newtons and nanometers. Reference Oliver and Pharr1,Reference Oliver and Pharr2 Early applications lead to direct mechanical characterization of thin film systems and materials under confined conditions, and current applications can be found across multiple disciplines. Reference Cheng and Cheng3–Reference Bei, Lu and George6 In a typical indentation test, by precisely controlling the movement of indenters, the depth of penetration and the applied load are simultaneously recorded as an experimental load–displacement curve (frequently termed P–h curve), from which many mechanical properties of test specimens can be extracted. The most common use is for the measurement of hardness and stiffness. Reference Oliver and Pharr1,Reference Oliver and Pharr2 In addition, other elastic or plastic mechanical properties, such as hardening exponents, Reference Dao, Chollacoop, Van Vliet, Venkatesh and Suresh4,Reference Bucaill, Stauss, Felder and Michler7 fracture behavior, Reference Lee, Jang, Lee, Choi, Lee and Kwon8,Reference Lee, Gao, Johanns and Pharr9 creep deformation, Reference Bower, Fleck, Needleman and Ogbonna10–Reference Goodal and Clyne12 and residual stresses, Reference Suresh and Giannakopoulos13–Reference Sebastiani, Bemporad, Carassiti and Schwarzer15 can also be evaluated.
Spherical indentation tests have several advantages over sharp indentations (i.e., conical and pyramidal indenters) and thus have been used extensively for probing various mechanical properties of a wide variety of materials recently. Reference Swadener, Taljat and Pharr14,Reference Swadener, Pharr, Vinci, Kraft, Moody, Besser and Shaffer16–Reference Choi, Yoo, Kim, Seok, Wang and Jang20 Unlike the self-similar deformation fields in sharp indenters, the plastic deformation field under spherical indentations changes gradually. For spherical indentations, the P–h curves have both the initial elastic response and the subsequent elasto-plastic behavior, whereas sharp indentation responses will be elasto-plastic immediately from the beginning. This enables spherical instrumented indentation to investigate many material properties that cannot be obtained by sharp indentation. For example, by solely using a single spherical indentation test, plastic properties of materials can be determined. Reference Cao and Lu17,Reference Jiang, Zhang, Feng and Liang19,Reference Lee, Lee and Pharr21–Reference Lee, Kim and Lee23 In contrast, for sharp indentations, either the stress–strain relation cannot be uniquely determined or multiple-indenter tests are needed. Reference Cheng and Cheng3,Reference Lan and Venkatesh24,Reference Hyun, Kim, Lee and Lee25 For another example, the evident elastic-plastic transition in spherical indentations makes it ideal in investigating elastic behavior and incipient plasticity at small scales, marked by pop-ins on the P–h curve in both crystalline materials Reference Montagne, Tromas, Audurier and Woirgard26–Reference Li, Bei, Morris, George and Gao29 and amorphous metals. Reference Bei, Lu and George6,Reference Bei, Lu, Shim, Chen and George30,Reference Choi, Zhao, Yoo, Kim, Suh, Ramamurty and Jang31 Also, spherical indentations can be used to study the size effects in that hardness changes with respect to indenter tip radii Reference Swadener, Pharr, Vinci, Kraft, Moody, Besser and Shaffer16,Reference Swadener, George and Pharr32 as well as a newly discovered different type of size effect in which the pop-in stresses increase with decreasing indenter tip radii. Reference Shim, Bei, George and Pharr28,Reference Morris, Bei, Pharr and George33 All these applications with spherical instrumented indentation, however, rely upon a knowledge of the correct indenter tip radius. If the incorrect indenter tip radii were used, all subsequent calculations would become erroneous.
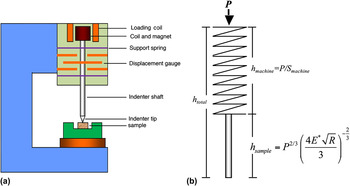
In practice, the uncertainty of the nominally measured tip radii offered by providers, which originate from difficulties in measurements at small scales, leads researchers to avoid using these values directly. A routinely adopted method, which is believed to be able to give correct R values, is to use the Hertzian elastic fitting, Reference Oliver and Pharr2,Reference Field and Swain34 in which the load P should be proportional to R 1/2 h 3/2 with h being the depth of penetration if the load–displacement curve is entirely elastic. Clearly the correctness of the indenter tip radius obtained this way relies on accurate measurement of both the load and displacement. Experimentally, the displacement measured by the displacement gauge [as shown in Fig. 1(a)] actually consists of two parts: the penetration into the sample, h sample, and the deflection of the loading frame, h machine, so that h total = h sample + h machine. The loading frame may be modeled as a spring with h machine = P/S machine, where S machine is the machine stiffness, as schematically shown in Fig. 1(b). The Hertzian theory merely considers the relation between the depth of penetration and load. In other words, when the load frame deflection is large enough, e.g., approaching the same order of magnitude as the depth of penetration, the Hertzian theory would become invalid on the experimental P–h curve when treating the displacement reading as solely from the contact response. As a result, the indenter tip radii determined using the direct Hertzian fitting become incorrect. This occurs particularly at high loads or indenting on stiff materials. It should also be noted that the machine stiffness may vary as a function of the applied load.
(a) Schematic illustration of the instrumented indentation system (reproduced after Oliver and Pharr Reference Oliver and Pharr1 ) and (b) schematic diagram showing that the experimentally measured displacement is the sum of the loading frame deflection, h machine, and the penetration into the sample, h sample, i.e., h total = h sample + h machine.

The purpose of the present work is to develop a method that is capable of determining the correct indenter tip radius under any conditions and simultaneously evaluating the machine stiffness quantitatively. This is achieved by simply incorporating the machine stiffness into the Hertzian theory and testing two materials with known material stiffness. The tip radius values obtained from our approach are compared with those from the routinely used method (i.e., direct Hertzian fitting), and differences are carefully examined. The machine stiffness is systematically analyzed for various indenters and loads, which provide insights in identifying when the direct Hertzian fitting is suitable for deriving indenter tip radii and when is not.
II. METHOD
The classic Hertzian contact solution is applicable for elastic half-spaces indented by indenters described by parabolae of revolution or for elastic bodies with initial separation gaps described by parabolae of revolution. Reference Johnson35,Reference Gao and Pharr36 The indentation load, P, is related to the indentation depth, h elastic, (or more rigorously, the approaching of faraway reference points on the two elastic solids in contact) by
 $$P = {4 \over 3}E^* \sqrt R h_{{\rm{elastic}}}^{{3 \mathord{\left/ {\vphantom {3 2}} \right. \kern-\nulldelimiterspace} 2}} \quad ,$$
where R is the indenter radius and the reduced modulus
 ${E^*}$
is given by
 $${1 \over {{E^*}}} = {{1 - {\rm{\nu }}_s^2} \over {{E_s}}} + {{1 - {\rm{\nu }}_i^2} \over {{E_i}}}\quad ,$$
for isotropic elastic materials with E and ν being the Young’s modulus and Poisson’s ratio, respectively. The subscripts s and i denote the sample and indenter, respectively. For anisotropic elastic materials, Eq. (1) holds true but the representation in Eq. (2) is significantly complicated. The indentation modulus plays a critical role in procedures that determine material hardness such as the Oliver–Pharr approach. Reference Oliver and Pharr1,Reference Oliver and Pharr2
This paper is built upon the notion that the displacement data as obtained from the instrumented indentation technique have the contributions from the contact response as in Eq. (1), the deflection of the loading apparatus due to the finite machine stiffness (S machine = P/h machine), and the uncertainty in identifying the onset of contact, as shown in Fig. 1(b). Since a constant machine stiffness, S default, is predefined in the data processing software prior to testing, the reported displacement reading differs from that measured by the displacement gauge by
 $${h_{{\rm{reported}}}} = {h_{{\rm{total}}}} - {P \over {{S_{{\rm{default}}}}}}\quad ,$$
where h total is the total displacement measured from the gauge in Fig. 1(a), and h reported is the reported displacement reading from the data processing software. If solely considering the displacement measured by the gauge, we have
 $${h_{{\rm{total}}}} = {P \over {{S_{{\rm{machine}}}}}} + {P^{2/3}}{({4 \over 3}{E^*}\sqrt R )^{ - 2/3}} + {h_0}\quad ,$$
in which the first term on the right hand side is the deflection of the loading frame and the second term is due to the contact response, as schematically shown in Fig. 1(b). S machine is the overall machine stiffness to be determined, which in principle is a complicated function of the load, P. A constant h 0 is introduced to account for the uncertainty of onset of contact. Combining Eqs. (3) and (4) gives
 $${h_{{\rm{reported}}}} = {P \over {{S_{{\rm{machine}}}}}} - {P \over {{S_{{\rm{default}}}}}} + {P^{2/3}}{({4 \over 3}{E^*}\sqrt R )^{ - 2/3}} + {h_0}\!\quad .$$
Our method to determine R and S machine is based on indentation tests on two different materials with known moduli. Thus, taking the difference of the following two equations,
 $${h_{{\rm{reported,I}}}} = {P \over {{S_{{\rm{machine}}}}}} - {P \over {{S_{{\rm{default}}}}}} + {P^{2/3}}{({4 \over 3}E_{\rm{I}}^*\sqrt R )^{ - 2/3}} + {h_{0,{\rm{I}}}}\quad ,$$
 $${h_{{\rm{reported,II}}}} = {P \over {{S_{{\rm{machine}}}}}} - {P \over {{S_{{\rm{default}}}}}} + {P^{2/3}}{({4 \over 3}E_{{\rm{II}}}^*\sqrt R )^{ - 2/3}} + {h_{0,{\rm{II}}}}\quad ,$$
we get
 $${h_{{\rm{reported,I}}}} - {h_{{\rm{reported,II}}}} =\, {P^{2/3}}{({4 \over 3}\sqrt R )^{ - 2/3}}(E_{\rm{I}}^{* - 2/3} - E_{{\rm{II}}}^{* - 2/3}) + ({h_{0,{\rm{I}}}} - {h_{0,{\rm{II}}}})\quad .$$
Provided with E* of these two materials, we can find the indenter radius by a linear fitting between h
reported,I − h
reported,II and
 $P^{{2 \mathord{\left/ {\vphantom {2 3}} \right. \kern-\nulldelimiterspace} 3}} $
. It is obvious that the success of this method relies on the assumption that the machine stiffness is only a function of the applied load, and the subtraction between the two sets of P–h curves should be conducted at the same load. Subsequently, with a known indenter radius, we can plot
 ${h_{{\rm{reported}}}} - {P^{2/3}}{({4 \over 3}{E^*}\sqrt R )^{ - 2/3}} + P/{S_{{\rm{default}}}}$
against P, which will lead us to determine S
machine and h
0 as in Eq. (5).
III. EXPERIMENTAL
Instrumented indentation tests were carried out on a MTS XP Nanoindenter (MTS Nano Instruments, Oak Ridge, TN) using diamond spherical indenters (E = 1141 GPa, ν = 0.07) with nominal tip radii of 2.55, 5.0, 8.3, 9.0, 50.0, and 100.0 μm and sapphire spherical indenters (E = 433 GPa, ν = 0.2) with nominal tip radii of 100.0 and 250.0 μm, respectively. The nominal indenter tip radii were provided by the manufacturer. During all tests, a machine stiffness of 9.1 N/μm was preselected in the current nanoindenter, according to manufacturer suggestions for routine hardness and modulus measurement using a Berkvoich diamond indenter. Fused silica (E = 73 GPa, ν = 0.17) and sapphire (E = 433 GPa, ν = 0.2) were selected for indentation tests because of their substantially different indentation moduli. This enables us to obtain two sets of P–h data having radically distinctive penetration depth at the same load, and consequently, the calculation will be more reliable in Eq. (8). Moreover, the reduced modulus to hardness ratio E
r/H for those two materials is small, having
 $E_{\rm{r}}^{{\rm{sp}}}/{H^{{\rm{sp}}}}$
= 13.9 and
 $E_{\rm{r}}^{{\rm{fs}}}/{H^{{\rm{fs}}}}$
= 6.14 for sapphire and fused silica, respectively. All tests were limited to the elastic region by using the continuous stiffness mode with a constant rate of
 $\dot P/P$
= 0.05 s−1 and the displacement oscillation is 1 nm. We select those experiment conditions to reduce the possibility of the loss contact problem.
Reference Pharr, Strader and Oliver37,Reference Durst, Franke, Bohner and Gokin38
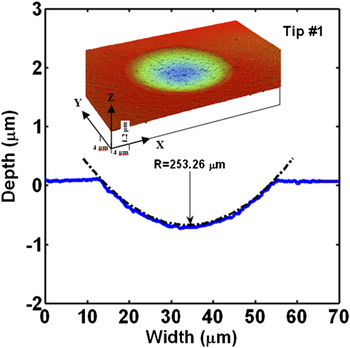
On a given specimen, about 9 indents were made by each indenter, and the indents were placed far enough apart to avoid interference. The indenter radii and machine stiffness were determined by the averaged results from these tests. In addition, indentations on a tin sample were also made with each indenter for measuring the indentation impressions using a white light interferometer. Because of the extreme low value of hardness in tin and almost no elastic recovery after indenting, it is believed that the residual impression left on the sample surface accurately reflects the shape of the indenter tip. 2D and 3D profiles of the impressions were acquired using a Wyko NT 9100 white light interferometer (Bruker Corporation, Tucson, AZ), as shown in the inset of Fig. 2. Subsequently, the indenter radius was extracted by fitting the 2D profile to a spherical cap. This procedure was repeated multiple times to obtain the average and standard deviation values reported in Table I. It is worth noting that under current resolution, the optical profiler can only accurately measure an indenter radius larger than 50 μm.
Line scan and three-dimensional view of the indentation impression on tin characterized by a white light interferometer, from which the indenter tip radius can be determined. Dash curve represents the spherical tip with a radius of 253 μm.

Indenter tip radii provided by the manufacturer (denoted as nominal), measured by the optical image of the indentation impressions on tin, derived by fitting to Eq. (1) and by our subtraction method in Eq. (8) using two materials (sapphire and fused silica). The corresponding machine stiffness can be fitted to the form of
 ${S_{{\rm{machine}}}} = {S_0} + kP$
.

n/a, not available.
As listed in Table I, of a total of 8 indenters, indenters with tip radii equal to or greater than 50 μm are marked as large indenters including Tip #1, Tip #2, Tip #3, and Tip #4, whereas those smaller than 50 μm are marked as small indenters, consisting of Tip #5, Tip #6, Tip #7, and Tip #8. The nominal tip radius is generally considered inaccurate and the “actual indenter tip radius” is routinely derived from direct Hertzian fitting to the experimental P–h data. Reference Oliver and Pharr2,Reference Swadener, George and Pharr32,Reference Field and Swain34 In the present work, both the Hertzian theory in Eq. (1) and the modified Hertzian model in Eq. (5) were applied to determine the indenter tip radii, and the differences were examined. These methods are compared with the optical profile measurements.
IV. RESULTS
A. Determination of indenter radius R
Results from the indenter Tip #2 (nominal radius = 100 μm) are used for illustrative purpose and processes for other tips are essentially the same. All the final results are given in Table I. Typical P–h reported curves on the fused silica and sapphire with Tip #2 are plotted in Fig. 3(a). Deformations in all cases are limited to the elastic region, as confirmed by the full unloading path that collapses onto the loading path. This helps to avoid difficulties in identifying the elastic–plastic transition points in the plastically deformed materials and ensure applicability of the Hertzian theory to all data. Due to the large difference in indentation moduli, sapphire and fused silica have distinct displacements, h fs and h sp, at the same loads and this large difference enables quality of data for the fitting in Eq. (8).
Determination of the indenter tip radius. (a) Experimental P–h
reported data on sapphire and fused silica using the Tip #2 indenter, shown by symbols. Direct Hertzian fitting is shown by the black solid curves and the Hertzian solutions with indenter radii obtained from our subtraction method are given by the red dashed curve. (b) The subtraction method is used to fit h
fs − h
sp (fs: fused silica; sp: sapphire) to
 $P^{{2 \mathord{\left/ {\vphantom {2 3}} \right. \kern-\nulldelimiterspace} 3}} $
as in Eq. (8). The slope can be used to determine the indenter tip radius.

We first directly use the Hertzian theory to fit the experimental P–h
reported curves (i.e., implicitly assuming S
default as the machine stiffness) to get tip radii, as indicated by the black dashed curves in Fig. 3(a). All calculations yield smaller indenter tip radii compared with the nominal radii, as listed in Table I. These fittings are seemingly reasonable, but we will show that the results are significantly different from both the optical profiler measurement and our subtraction method. Also such a fitting gives different tip radii for the two materials, which clearly indicate the invalidity of this method. In the subtraction method in Eq. (8), data points (P, h
fs) and (P, h
sp) at the same loads on Fig. 3(a) are used. The linear fitting between h
fs − h
sp and
 $P^{{2 \mathord{\left/ {\vphantom {2 3}} \right. \kern-\nulldelimiterspace} 3}} $
in Fig. 3(b) clearly demonstrates the success of our method in Eq. (8). Note that several data points are plotted on Fig. 3(b); the fitting curves are obtained from all the data points in the designated load range. The tip radius can be determined from the slope, which equals to
 $\left( {{4 \over 3}\sqrt R } \right)^{ - {2 \mathord{\left/ {\vphantom {2 3}} \right. \kern-\nulldelimiterspace} 3}} \left( {E_{\mathop{\rm I}\nolimits} ^* ^{ ^- {^{2 \mathord{\left/ {\vphantom {2 3}} }\right. \kern-\nulldelimiterspace} 3}} - E_{{\mathop{\rm II}\nolimits} }^* ^{ {^{-2 \mathord{\left/ {\vphantom {2 3}} \right. \kern-\nulldelimiterspace} 3}} } \right)$
. The fitted intercept corresponds to
 ${h_{0,{\mathop{\rm I}\nolimits} }} - {h_{0,{\mathop{\rm II}\nolimits} }}$
, which reflects the difference in the uncertainty of onset of contact for these two materials, and can be positive and negative.
The indenter tip radii obtained from the above procedure can be found in Table I. For large indenters, the subtraction method gives indenter radii that are very close to the optical profile measurements but deviates significantly from the direct Hertzian fitting. Thus, it is concluded that the subtraction method gives correct tip radius values, whereas routinely determined radii by the direct Hertzian fitting tend to be underestimated at least for large indenters. The error could be as large as 25%, and using tip radii obtained by the direct Hertzian fitting may lead to incorrect conclusions in practice. For smaller indenters, tip radii obtained by both direct Hertzian fitting and subtraction method are similar, as shown in Table I. Although confirmation by the optical profile measurement is not feasible for these cases, the agreement of these two methods suggests that the Hertzian fitting is applicable for finding the indenter tip radius but only for small indenters. The subtraction method developed in this work is rather universal. The critical condition (i.e., how low the load and displacement may be) regarding the validity of the direct Hertzian fitting is discussed in Sec. V.
B. Determination of machine stiffness, S machine
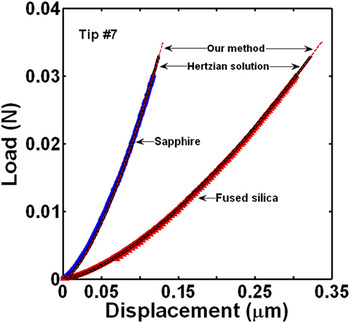
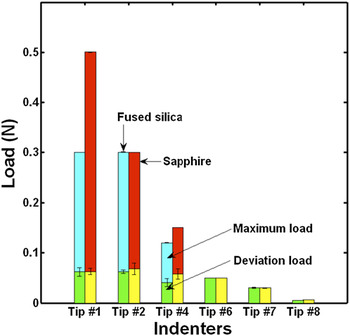
To examine the significance of the machine stiffness, the Hertzian solutions for two materials, with correct indenter tip radii obtained from our subtraction method, are plotted to compare with the experimental P–h reported curves. As representatively shown in Fig. 3(a) for the indenter Tip #2, the Hertzian solutions given by the red dashed curves collapse onto the experimental P–h reported curves at the initial loading stage and then deviate to lower displacements, and this deviation becomes increasingly significant with the increase of the indentation load. The coincidence of the Hertzian solutions with experimental curves at low loads in Fig. 3(a) indicates that the displacement resulting from the deflection of the loading frame is smaller than the contact response. With a further increase of the applied load, a significant amount of extra displacement results as shown by the P/S machine term in Eq. (5), which cannot be accounted for by the predefined machine stiffness. Consequently, the Hertzian solutions deviate from the experimental curves beyond a critical load, being roughly 0.05 N for Tip #2. For convenience, the region below this critical load is termed “coincidence region,” whereas that above this load is termed “deviation region.” A similar behavior is found for all other large indenters. For small indenters, the Hertzian solutions overlap nicely with the experimental data throughout all loads, as representatively shown by the indenter Tip #7 in Fig. 4. In other words, small indenters only have “coincidence region” because deformation in these cases is restricted to low loads. The predefined machine stiffness can account for deformation of the loading frame at low load levels, and hence, only a negligibly small deviation is observed. To find out a critical load when the deviation begins and the predefined machine stiffness is no longer applicable, critical loads are systematically analyzed, as shown in Fig. 5. This critical deviation load is found to be around 0.05 N.
Load–displacement curves using the small tip-radius indenter (Tip #7). Symbols represent experiment P–h reported curves. Direct Hertzian fitting by using Eq. (1) is shown by the black solid curves and the Hertzian solutions with indenter radii obtained from our subtraction method are given by the red dashed curve. Note that the black solid curves overlap the red dashed curve.

Maximum indentation loads and deviation loads for various indenters. The deviation load denotes load where the Hertzian solutions deviate noticeably from experimental P–h reported curves, as shown in Fig. 3(a). For small indenters, negligibly tiny deviation occurs, and the maximum loads equal to the deviation loads. The deviation load is around 0.05 N for the large indenters.

The machine stiffness can be quantitatively evaluated from Eq. (5) after obtaining the correct indenter tip radius, R, from the subtraction method. The parameter h 0 was found to be on the order of nanometers, one or two orders of magnitude smaller than the used displacement. Calculated machine stiffness at selected load ranges for various indenter tips is presented in Table I. For all four indenter tips, it is found that the machine stiffness increases approximately linearly with the applied load, as representatively demonstrated for the Tip #2 indenter in Fig. 6. This linear dependence of the machine stiffness on the applied load can be described with a linear relationship, S machine = kP + S 0, with k and S 0 being fitting parameters as summarized in Table I. With the load range extending upward and downward, it resembles more like a power law relationship. For small indenters, because the Hertzian solution almost overlaps with experimental P–h reported curves, the machine stiffnesses in these cases are indeed very close to the predefined value, 9.1 N/μm, as shown by our data in Fig. 6. It is noted that different indenters result in different calculated machine stiffness because, as shown in Fig. 1(b), the machine stiffness calculated by using our method include all factors into consideration except the contact between the tip end and the sample. These include the deflection of the loading frame, deformation of the indenter tip and mounting materials between the frame and indenter tip. For different indenters, the tip size, shape, tip holder, and the tip mounting materials (glue) are slightly different, resulting in different machine modulus.
Machine stiffness under different loads with selected indenter tips. The machine stiffness approximately shows linear dependence on the load and can be described with
 ${S_{{\rm{machine}}}} = {S_0} + kP$
, in which fitting parameters k and S
0 can be found in Table I. For small indenters, the calculated machine stiffness is close to the predefined machine stiffness, S
default = 9.1 N/μm. Machine stiffness at loads below 10% of the maximum load was not calculated because of great system errors.

V. DISCUSSION
Many previous researches assumed that the machine stiffness remains constant throughout the entire indentation testing procedure or only interpret their data with a default machine stiffness, which is provided in the software by the manufacturer. Such an assumption may cause measurement errors in realistic applications, given that the machine stiffness is actually a function of the applied load and may vary for different tips. At low load levels, e.g., <0.05 N in our case, it is justifiable to use a constant value for the machine stiffness because the contact stiffness is much lower than the machine stiffness and its variations associated with increases in the load are small. As a result, directly fitting the experimental P–h reported data with the classic Hertzian solution is appropriate and can give correct indenter tip radii. This is confirmed by our studies on smaller indenter tips, in which the predefined machine stiffness value is taken and ultimately the calculated tip radii are relatively accurate. Our results in Table I clearly demonstrate that this is not the case for large indenter tips. The assumption of a constant machine stiffness will lead to significant errors. For instance, incorrect indenter tip radii were attained when directly using the Hertzian fitting as in Table I. Consequently, it can be concluded that the constant machine stiffness assumption is only valid for deriving indenter tip radii with Hertzian theory at small load cases. The critical load value is around 0.05 N for the present instrumented indentation, and may vary for different indentation system. However, our subtraction method can be used to simultaneously obtain tip radii and machine stiffness regardless of the tip radii and load ranges.
To further verify our findings, the contact stiffness for all indenters was calculated for comparison with the calculated machine stiffness. The experimental P–h reported curves were first fitted directly with the Hertzian solution, although the obtained R values are smaller than the actual ones, as has been shown in Table I. Nevertheless, this gives us a contact stiffness by
 $${{{\rm{d}}P} \over {{\rm{d}}h}} = 2{E^*}\sqrt {Rh} \quad .$$
Two typical results are selected for illustration purposes; one is Tip #2 representing large indenters, and the other is Tip #7 representing small indenters, as plotted in Fig. 7. As expected, the contact stiffness increases exponentially with loads and is generally higher on the stiff sapphire than the relatively compliant fused silica. It is worth noting that for large indenter tips, below our proposed critical load level of ∼0.05 N, the contact stiffness is one order of magnitude smaller than the machine stiffness; but above this value, it is approaching the same order of magnitude. This is particularly apparent for sapphire because of its high material stiffness. For small indenter tips, like Tip #7, the contact stiffness is one order of magnitude smaller than the machine stiffness throughout the whole loading process. Equivalently speaking, the contribution from deflection of the load frame is smaller than that from the contact response. Thus, the displacement obtained from the indenter can be trusted as the material deformation only at the nanoindentation regime (e.g., in our case, P < 50 mN).
Plots of contact stiffness versus load for the two materials using large indenter Tip #2 in (a) and small indenter Tip #7 in (b).

VI. CONCLUSION
Our studies on instrumented indentation with spherical indenter tip radii ranging from several microns to hundreds of microns show that the routinely utilized method, i.e., direct Hertzian fitting, for determining the indenter tip radius is not appropriate for large indenter tips or above a critical load. Great caution is needed when directly using Hertzian fitting to derive the tip radius. It is acceptable to use at low loads, in our case, P < 50 mN. The indenter tip radius is likely to be underestimated by direct Hertzian fitting.
A new approach for simultaneously determining the spherical indenter tip radius and the machine stiffness has been developed by incorporating the contribution of machine stiffness into the classic Hertzian solution. This approach requires two materials, desirably with radically different material stiffness, to be indented. The indenter tip radius can be derived from linear fitting of the displacement differences at the same loads for two materials, (h I – h II), against P 2/3 . The machine stiffness at various loads, which has been a potential error source in many instrumented indentation applications, can also be determined once the indenter tip radius is known from the previous step. Indentations tests were done on fused silica (relatively compliant material) and sapphire (stiff material) with spherical indenter tip radii in the range of several microns to hundreds of microns. Comparisons were made among indenter tip radii obtained from three methods: direct Hertzian fitting, optical profiler measurement, and our approach, from which the following conclusions can be drawn.
-
(1) Utilizing the classic Hertzian theory to fit individual experimental P–h data cannot be guaranteed to give the correct spherical indenter tip radius. Large errors will occur when dealing with high load indentations because of machine stiffness, and the tip radius value thus obtained could be underestimated by as much as 25%. In our experiments, the critical load below which Hertzian theory is applicable is suggested to be ∼0.05 N when the instrumented indentation system has a machine stiffness of ∼10 N/μm.
-
(2) The subtraction method developed in this work can give relatively accurate indenter tip radii, regardless of load levels at which the indentation test is performed. This is particularly important when large indenter tips are used, e.g., those with radii of about tens of microns.
-
(3) The machine stiffness can be simultaneously obtained from this approach. It is found to be dependent on the applied load and can be described by a linear relationship. Explicit evaluation of the machine stiffness is potentially useful for eliminating the system error and makes the instrumented indentation a more precise technique.
-
(4) The contact stiffness increases with the applied load, so that if it eventually reaches the same order of magnitude as the machine stiffness, the deflection of the loading frame contributes substantially to the final displacement readings. And hence the variation of the machine stiffness with respect to the load, i.e., S machine(P), has to be taken into consideration rather than assuming a constant machine stiffness.
-
(5) Our method has great potential applications in the area of instrumented indentation with spherical indenters, such as the size effect study, Reference Bei, Lu, Shim, Chen and George30,Reference Yang, Ye, Lu, Gao and Liaw39 modulus and hardness measurement, Reference Barabash, Bei, Gao and Ice40 and determination of contact radius or contact area, among many others.
ACKNOWLEDGMENT
This work was sponsored by the U.S. Department of Energy, Basic Energy Sciences, Materials Sciences and Engineering Division.