I. INTRODUCTION
In this work, we introduce a new lab-based aerosol jet fog (ajFOG) deposition system by producing and validating high-quality aluminum oxide phosphate films. We show that uniform films are readily deposited from a homogeneous fog at room temperature and pressure. The semiconductor, glass, and solar industries have historically relied on vacuum deposition to produce uniform thin films on various flat and textured substrates. Reference Miikkulainen, Leskela, Ritala and Puurunen1 As these industries explore and introduce new technologies, opportunities arise to consider new cost-effective, environment friendly, and less energy intensive deposition techniques, especially to address scaling issues. Solution-based spin coating, for example, satisfies most needs and produces high quality organic and inorganic thin films, Reference Niesen and De Guire2 but physical limitations restrict its use to modest substrate sizes. Reference Kast, Enman, Gurnon, Nadarajah and Boettcher3,Reference Norrman, Siahkali and Larsen4 Lately, researchers have been addressing spin coating constraints by investigating aerosol techniques such as spray coating, Reference Singh, Sasaki, Song and Hane5 spray pyrolysis, Reference Golego, Studenikin and Cocivera6 mist chemical vapor deposition (MCVD), Reference Kawaharamura, Uchida, Sanada and Furuta7 and liquid source misted chemical deposition (LSMCD). Reference Huffman8 These techniques aim to initially produce homogeneous aerosols of volatile molecules, liquids, or solutions Reference Piao, Katori, Kawaharamura, Li and Fujita9,Reference Akaiwa and Fujita10 that then deposit to form uniform films, potentially over large areas. Among aerosol methods, LSMCD so far produces the most uniform and smoothest films, but its complexity makes scaling substrates to large sizes unlikely. Reference Chung, Choi, Lee and Woo11
To examine the potential of aerosol deposition to produce uniform films from a homogeneous fog and enable new capabilities, we have worked with Beneq Corporation to design a laboratory deposition system. The ajFOG system employs a novel atomizer consisting of two opposing jets located inside the deposition chamber. Head on collision of the opposing jets shears precursor droplets into a fine mist or fog that uniformly fills the deposition chamber and enables the use of low volatility precursors. We explore system capabilities by studying deposition of aluminum oxide phosphate (AlPO) thin films from an aqueous precursor. AlPO has received considerable attention for applications requiring abrasion resistance, chemical resistance, low refractive index, and low electrical leakage. Reference Rothon12–Reference Dobbelaere, Roy, Vereecken and Detavernier14 AlPO has previously been deposited via spin coating Reference Rothon12,Reference Meyers, Anderson, Hong, Hung, Wager and Keszler13 and atomic layer deposition. Reference Dobbelaere, Roy, Vereecken and Detavernier14 Here, we develop a model to predict AlPO film thickness as a function of ajFOG process variables; precursor concentration, fog settling time, fog exposure time, and number of coating cycles. ajFOG and spin-coated films are compared side-by-side by using spectroscopic ellipsometry (SE), x-ray reflectivity (XRR) and diffraction (XRD), and metal/oxide/semiconductor (MOS) capacitor measurements to highlight the effectiveness of the ajFOG method.
II. EXPERIMENTAL
A. Precursor preparation
The aqueous aluminum phosphate-based (AlPO) hetero-polycation precursor with the general formula Al5O3(PO4)3 is synthesized using aluminum nitrate (98% Sigma Aldrich), nitric acid (99.9% Alfa Aesar), and deionized water (18.2 MΩ). Final precursor solutions were diluted to desired concentrations and filtered with a 0.2-µm polytetrafluoroethylene (PTFE) filter. A detailed description of the preparation of AlPO precursor has been reported previously. Reference Meyers, Anderson, Hong, Hung, Wager and Keszler13
B. Thin film deposition
Aqueous AlPO precursors were deposited onto 150-mm Si wafers via both ajFOG deposition and spin coating to form Al5O3(PO4)3 thin films. Prior to thin film deposition, silicon substrates were cleaned using acetone, isopropanol, and deionized water for 10 min each in ultrasonic bath followed by a 10 min UV ozone treatment.
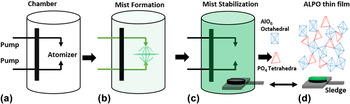
The Beneq ACS 200-101 aerosol jet fog (ajFOG) deposition system (Beneq, Espoo, Finland) produces a fog at room temperature and slightly below atmospheric pressure via a novel atomizer. Figure 1 shows a simplified schematic of the ajFOG system. (A labeled photograph of the actual system is shown in Fig. S1.) Two independent aerosol nozzles, directed one to the other, form the atomizer. Dosing diaphragm pumps supply each nozzle with precursor solutions to produce high-velocity jets of fine precursor droplets. These droplets collide head-on and shear into smaller sizes to produce a flat and evenly distributed aerosol disc [Fig. 1(b)]. Over time, momentum carries the droplets throughout the chamber to create a homogeneous fog. Uniform aerosol fog generation via droplet collision is a unique aspect of the system. Precursors may be fed independently to each nozzle; in this work, the aqueous AlPO precursor was supplied to each nozzle. The substrate is introduced into the chamber via a load lock, which is kept at a slightly positive pressure with respect to the chamber, preventing aerosol fog from leaking into the load lock. N2(g) flows through Venturi vacuum generators to create a slight vacuum and contain the aerosol fog within the deposition chamber.
Operational schematic of the ajFOG deposition system at different stages: (a) deposition chamber, (b) formation of aerosol by 180° impact of opposing precursor jet streams, (c) uniform mist after stabilization and introduction of substrate, and (d) removal of substrate by sledge after thin film deposition. Also shown in (d) is a schematic of the AlPO thin film structure.

Films may be deposited either in continuous mode or pulse mode. In continuous mode, the substrate is introduced into the chamber while the aerosol fog is continuously generated. As soon as the aerosol fog droplets contact the substrate, they spread completely due to the UV-ozone treated substrate's high-surface energy. The exposure time and the interaction energy between the droplets and the surface determine the equilibrium film thickness. Reference De Gennes15
In pulse mode, aerosol generation is interrupted, allowing fog droplets to stabilize inside the chamber for a selected wait time, t w, before introducing the substrate. Visually, fog density decreases over time as droplets gradually settle at the bottom of the chamber due to gravity; after about 600 s, the fog has dissipated completely. The wait period produces a uniform fog of small droplets, as large droplets settle first due to gravity [consider Fig. 1(c)]. While we have not measured the average droplet size in the fog, their persistence in the chamber indicates a radius smaller than the capillary length λc = [(γ/ρg)]1/2, where γ is surface tension, ρ is density, and g is gravity. Reference Tanner16 Assuming droplet density and surface tension equivalent to those of water, the maximum droplet diameter after initial settling should be approximately 10 μm or smaller. In this work, films were deposited in pulse mode, typically with t w = 120 s.
After a prescribed exposure time, t exp, of the substrate in the chamber the coated substrate is transferred from the chamber to the load lock. To prevent rapid film drying and to promote spreading and uniformity, the load lock is supplied with moist N2(g). The coated substrate rests in the load lock for a set “leveling” time, allowing the droplets to coalesce and form a continuous film [see Fig. 1(d)]. Reference Cormier, McGraw, Salez, Raphaël and Dalnoki-Veress17,Reference Bonn, Eggers, Indekeu, Meunier and Rolley18 The minimum leveling time in this work is 30 s; shorter times compromised film uniformity. When higher precursor concentration solutions are used, longer leveling times are needed. When removed from the chamber, the film is initially wet and susceptible to air turbulence. If the load lock is opened too early, air turbulence produces uneven drying across the wafer, decreasing uniformity. During the leveling period, a gradually receding rainbow pattern indicates film thickness is changing consistent with drying. After leveling, the coated substrate is removed from the load lock and cured on a hotplate at 300 °C for 1 min prior to any analysis. A complete deposition cycle—fog formation, leveling, and exposure—requires approximately 10 min. Finally, 18.2-MΩ deionized water is run through the nozzles after each deposition to purge residual precursor.
For comparison studies, the same aerosol precursor solutions were spin coated onto Si substrates at 3000 rpm for 30 s, then cured at 300 °C for 1 min on a hotplate.
C. Thin film characterization
AlPO films were analyzed either after the 300 °C cure, or following anneals in a Eurotherm box furnace at 300, 400, 500, and 800 °C for 1 h in air. Spectroscopic ellipsometry (SE) was conducted using a J.A. Woollam, Inc., (Lincoln, Nebraska) M-2000 instrument. Thirty-seven point thickness maps were measured at incident angles of 60 and 65° in the wave length range 370–1000 nm. A Cauchy model fitting of Ψ and Δ with respect to wave length was used to extract film thickness and refractive index.
X-ray reflectivity (XRR) and diffraction (XRD) data were collected with a Rigaku Ultima-IV (Rigaku Corporation, Tokyo, Japan) x-ray diffractometer equipped with Cu Kα radiation (λ = 1.5409 Å) and configured with 5.0° incident and receiving Soller slits and a 10-mm divergent height limiting slit. Data modeling was performed with Rigaku GlobalFit modeling software 19,20 using a four layer model consisting of the substrate, the substrate-AlPO interface, the AlPO film, and a surface crust.
For electrical characterization, circular, 250-µm diameter aluminum dots were thermally evaporated through a shadow mask to form the top electrodes. Capacitance versus voltage (C–V) and current versus voltage (I–V) measurements were carried out on a probe station in a dark box at room temperature using an Agilent 4284A Precision LCR meter and an Agilent (Santa Rosa, California) 4155C Semiconductor Parameter Analyzer, respectively. Si p-type (1.5 Ω-cm) substrates were used for C–V measurements while Si n-type (0.0010–0.0055 Ω-cm) substrates were used for I–V measurements. The Si substrates constituted the bottom electrodes and were held at ground. The ideal flatband voltage, V FB-ideal, was calculated from the work-function difference between the aluminum electrode and the semiconductor substrate, assuming ΦAl = 4.1 eV and acceptor doping of 1016/cm3. Experimentally determined V FB were determined using the inverse 2nd derivative method described by Schroeder. Reference Schroeder21
III. RESULTS AND DISCUSSION
A. Thickness and uniformity
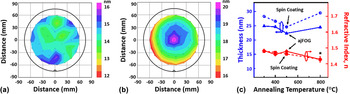
Figure 2(a) shows a thickness contour map for an ajFOG deposited film cured at 300 °C. Film thickness varies between 13.5 and 14.5 nm with the mean = 14.1 nm; thickness varies by less than 4% across the 150-mm wafer. As an aqueous precursor, AlPO uniformly coats hydrophilic surfaces. A 10-min ultraviolet (UV) ozone treatment prior to deposition produces a uniformly hydrophilic surface. A shorter UV ozone exposure time is insufficient as surface-energy discontinuities across the substrate directly influence film uniformity and quality (see supplementary Fig. S2). Small differences in chamber and load-lock pressures can create turbulence and disturb the fog distribution when the wafer moves from the chamber to the load lock. If the sample is not carefully removed, air flow during this movement can thin the leading edge of the wafer (see supplementary Fig. S3).
Ellipsometry thickness maps of (a) ajFOG deposited and (b) spin coated AlPO thin films over a 150 mm silicon substrate following a 1 min cure at 300 °C. (c) Thickness (blue) and refractive index (red) of ajFOG (dashed lines) and spin coated (solid lines) for films as-deposited and annealed at either 400, 500, or 800 °C. The error bar indicated with an asterisk (*) is associated with the 800 °C spin coated films.

Figure 2(b) shows a thickness contour map of a standard spin coated film. Film thickness varies between 16 and 20 nm with the mean = 18.2 nm; thickness varies by approximately 10% over the 150-mm wafer. Comparing Figs. 2(a) and 2(b), the spin-coated films are approximately 5 nm thicker than the aerosol-deposited films and slightly less uniform. The sharp variation in film thickness at the wafer center and edge are due to the wafer chuck and edge effects, common defects associated with spin coating that are not observed in the ajFOG-deposited films.
Figure 2(c) shows refractive index and average thickness for ajFOG and spin-coated films as a function of annealing temperature. The refractive index and thickness vary in similar ways for the two deposition methods as temperature increases. At each temperature, refractive indexes differ by less than 5%. The minimum thickness for both deposition methods occurs at 500 °C, which is associated with nearly complete dehydration of the films. Reference Alemayehu, Davis, Jackson, Lessig, Smith, Sumega, Knutson, Beekman, Johnson and Keszler22 Film thickness increases in each case at 800 °C. As 800 °C is several hundred degrees below the film crystallization temperature, as determined by XRD, Reference Jiang, Meyers, Anderson, Johnson and Keszler23 grain growth and coarsening do not contribute to the increased roughness. However, the interfacial SiO2 layer between the Si substrate and the AlPO film is likely growing at high temperatures. The similarity of the optical refractive indexes for AlPO and a growing SiO2 layer may account for the apparent AlPO thickness increase. This SiO2 growth requires further study.
B. Process variables
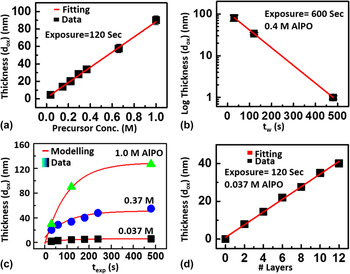
For spin coating, spin speed, spin time, and number of coatings are commonly varied to adjust and control film thickness. To control film thickness with ajFOG deposition, we have investigated the solution precursor concentration [N], exposure time (t exp), wait time (t w), intrinsic fog settling time, τ, for the system, and number of coating cycles. Figure 3(a) shows a plot of film thickness, d ox, versus AlPO precursor concentration for a fixed t w = 120 s and t exp = 120 s. Film thicknesses increase from 4.3 to 90 nm by changing [N] from 0.04 to 1.0 M. Empirically, d ox depends linearly on the [N] according to Eq. (1)
 $${d_{{\rm{ox}}}} = C\left( {{t_{\rm{w}}} = 120\,{\rm{s}},\;{t_{\exp }} = 120\,{\rm{s}}} \right) * \left[ N \right]\quad ,$$
where C(120,120) = 88 nm/M and [N] = molarity of Al in the precursor solution; C varies with t w and t exp.
(a) Variation of AlPO film thickness with precursor concentration. The red line [fit by Eq. (1)] indicates a linear dependence. (b) Log (thickness) as a function of wait time, t w, for a fixed exposure time of 600 s, fit (red lines) by Eq. (2). (c) Thickness as a function of exposure time, t exp, modeled (red lines) by Eq. (3). (d) Multilayer deposition of thin films from 0.037 M precursor. Fitting (red line) indicates linear dependence. In all plots, error bars are smaller than the symbol size. All films were as deposited and cured at 300 °C for 1 min on a hot plate.

In pulse mode, where the aerosol fog generation is stopped prior to exposing the substrate, the ajFOG deposition process is driven by gravity induced settling of the fog. This is observed visually to occur over a period of approximately 600 s. To evaluate the intrinsic fog settling time, τ, as well as the expected wait time (t w) dependent saturation thickness, d sat, a series of films were deposited by fixing t exp and varying t w, the amount of time that lapses between stopping fog generation and inserting the wafer into the chamber. As the chamber is fog free in less than 600 s, t exp was fixed to 600 s to ensure a saturated deposition. Figure 3(b) shows a plot of log(d sat) versus t w for [N] = 0.4 M. Physically, longer t w allows more settling of the fog, in turn producing thinner films. Equation (2) describes this empirical relationship in exponential form:
 $${d_{{\rm{sat}}}}\left( {\left[ N \right],\,{t_{\rm{w}}}} \right) = {d_{{\rm{sat}}}}\left( {\left[ N \right],\,0} \right)\;\exp \left( {{{ - {t_{\rm{w}}}} \mathord{\left/ {\vphantom {{ - {t_{\rm{w}}}} \tau }} \right. \kern-\nulldelimiterspace} \tau }} \right)\quad ,$$
where d sat([N], t w) is the saturation thickness at t exp = 600 s as a function of [N] and t w, d sat([N], 0) is the extrapolated saturation thickness at t w = 0 as a function of [N], and τ is the intrinsic fog settling time for the system. The system fog settling time of τ∼102 s is obtained by fitting Eq. (2) to Fig. 3(b).
The data from Fig. 3(b) is replotted on a linear scale in supplementary Fig. S4 with visible error bars representing the standard deviation obtained during the ellipsometry thickness mapping (37 points). If the standard deviation can be assumed to be related to the roughness then it can be inferred that the surface roughness decreases with increasing t w. The physical basis for this is that as soon as the fog formation is stopped in the deposition chamber, the bigger and heavier droplets fall faster (due to reduced influence of Brownian forces) leaving smaller droplets suspended in the chamber. A shorter t w allows the wafer surface to be exposed to a greater density of larger droplets, creating a rougher surface with larger thickness variation.
Next the impact of fog exposure time, t exp, is investigated. Figure 3(c) shows plots of d ox as a function of t exp for 0.037, 0.40, and 1.0 M concentration precursor solutions at fixed t w = 120 s. As seen in Fig. 3(c), the deposition rate is directly related to the amount of fog remaining in the chamber. At short exposure times, film thickness increases rapidly with t exp, slowing as the fog settles out and eventually saturating at long t exp. The saturation thickness, d sat, for each concentration is consistent with the results presented in Fig. 3(a). Equation (3) models film thickness as a function of t exp:
 $${d_{{\rm{ox}}}} = {d_{{\rm{sat}}}}\left( {\left[ N \right],\,{t_{\rm{w}}} = 120} \right)\left( {1 - \exp \left( {{{ - {t_{{\rm{exp}}}}} \mathord{\left/ {\vphantom {{ - {t_{{\rm{exp}}}}} \tau }} \right. \kern-\nulldelimiterspace} \tau }} \right)} \right)\quad ,$$
where d sat([N], t w = 120) is the saturation thickness for a selected precursor concentration with t w = 120 s and τ is the fog settling time of ∼102 s as determined above.
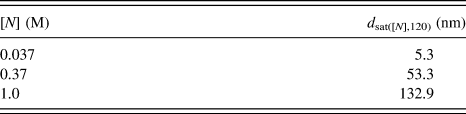
Equation (3) fits well the growth profiles in Fig. 3(c), yielding R 2 = 0.999. Summarized in Table I are fitted d sat([N], 120) for the three measured precursor concentrations. d sat([N], 120) increases linearly with [N], consistent with Fig. 3(a) and Eq. (1). Saturation thickness, d sat occurs at a fixed time, independent of the solution concentration. The close agreement of Eq. (3) with the data in Fig. 3(c) is a further indication that the fog settling time τ is an intrinsic characteristic of the ajFOG chamber with an aqueous fog.
Fitting constants for different precursor concentrations obtained from Eq. (3) for t w = 120 s and t exp = 120 s.

A general equation for thin film growth can be formed by combining Eqs. (1)–(3) to arrive at
 $${d_{{\rm{ox}}}} = {C_{{\rm{sat}}}} \cdot \left[ N \right] \cdot \exp \left( {{{ - {t_{\rm{w}}}} \mathord{\left/ {\vphantom {{ - {t_{\rm{w}}}} \tau }} \right. \kern-\nulldelimiterspace} \tau }} \right) \cdot \left( {1 - \exp \left( {{{ - {t_{{\rm{exp}}}}} \mathord{\left/ {\vphantom {{ - {t_{{\rm{exp}}}}} \tau }} \right. \kern-\nulldelimiterspace} \tau }} \right)} \right)\quad ,$$
where C sat = 420 nm/M for t w = 0 and t exp = ∞. Note that C sat will depend on the specific precursor used. To summarize the physical significance of Eqs. (1)–(4), ajFOG deposition depends linearly on the concentration of the precursor solution [N] in the fog droplets; on the amount of precursor fog remaining in the chamber [which decreases characteristically (τ) with wait time, t w, and exposure time], the time the substrate spends exposed to the fog, t exp, and the intrinsic settling time of the fog in the chamber (τ).
Finally, in addition to adjusting [N], t w, and t exp, the thickness may also be controlled via multiple coatings. Figure 3(d) shows a plot of film thickness versus number of coating cycles for the precursor concentration of 0.037 M. Each coating cycle was performed with t w = 120 s and t exp = 120 s followed by curing for 1 min at 300 °C. The linear dependence of thickness on the number of coating cycles shows that multiple coatings can readily produce a desired target thickness, and it also confirms the coating process is stable and reproducible. Twelve coating cycles produce a film with a thickness of roughly 40 nm, indicating that a 3.35-nm thick layer forms in each cycle.
C. Density, surface roughness, and morphology
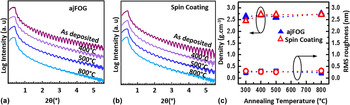
Figure 4 shows plots of log (XRR intensity) versus angle 2θ for (a) aerosol and (b) spin-coated films annealed for 1 h in air at the indicated temperatures. Critical angles and Kiessig fringe amplitudes are comparable for the two deposition methods, representing the extreme surface smoothness. Figure 4(c) shows derived densities for the two deposition methods. They are similar, ∼2.7 g/cm3, and essentially independent of anneal temperature above 300 °C. The largest difference, 7%, between the two techniques occurs at 300 °C. Considering the variable film water content observed at this temperature, the difference is not unexpected.
XRR intensity versus angle 2θ of (a) ajFOG deposited (b) spin coated AlPO thin films on silicon substrates. (c) Density and RMS roughness of the ajFOG deposited and spin coated AlPO thin films versus anneal temperature. All films are single layer depositions with [N] = 0.4 M, with t w = 120 s and t exp = 120 s for the ajFOG depositions.

Figure 4(c) shows surface roughness estimates from XRR data plotted as a function of anneal temperature. Both aerosol deposition and spin coating produce ultra-smooth surfaces with root-mean-square surface roughness (R q) below 0.4 nm. Values differ by less than 0.1 nm and are largely temperature independent for the two deposition methods.
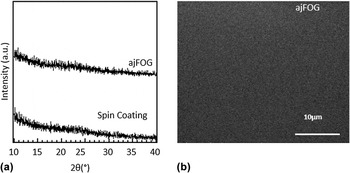
Shown in Fig. 5 are (a) XRD intensity versus 2θ for 45 nm thick ajFOG and spin coated films, and (b) a plan view SEM images of the ajFOG deposited film. Taken together, the absence of any sharp peaks in the XRD spectrum, the absence of features in the SEM image, and the low surface roughness [Fig. 4(c)] are strong indications of the amorphous nature of the AlPO films.
(a) XRD intensity versus 2θ for 45 nm thick ajFOG deposited and spin coated AlPO films. (b) Plan view SEM image of the same ajFOG film. All films were deposited using 0.4 M AlPO precursor and annealed at 800 °C for 1 h in air. The absence of any sharp peaks in the XRD pattern as well as the smooth surface and absence of features in the SEM image combined with low surface roughness [Fig. 4(c)] are strong indications of the amorphous nature of the film.

D. Carrier dynamics
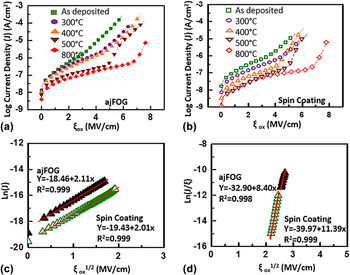
Shown in Fig. 6 is a plot of current versus electric field, E ox, for (a) ajFOG deposited and (b) spin coated Al/AlPO/Si MOS devices, both as-deposited (and cured at 300 °C for 1 min) and as a function of anneal temperature. The average ellipsometric thickness of the ajFOG deposited and spin coated films were 24 and 18 nm, respectively. The electric field is calculated from the applied voltage, V, divided by d ox (ξox = V/d ox), where d ox is the ellipsometric thickness of the overall dielectric stack (which consists of the main AlPO layer, d AlPO, and an interfacial layer, d IL, at the substrate-AlPO interface, d ox = d AlPO + d IL). The anneal temperature dependence of the J–ξ characteristics exhibited by the films is qualitatively the same, in that leakage current decreases with annealing temperature for both deposition techniques. The decrease in leakage current with increased anneal temperature is likely due to film dehydration and interfacial SiO2 layer growth at the higher temperatures. Reference Smith, Wang, Keszler and Conley24,Reference Anderson, Wang, Jiang, Gustafsson, Xu, Gafunkel and Keszler25 Similar behavior was reported in spin coated Al2O3 films which, in addition to decreased leakage, also showed a reduction in overall dielectric constant with increasing anneal temperature. The improvement in electrical properties was determined to be due to dehydration and the formation of a wide band gap SiO2 interfacial layer. Reference Wang26 Interfacial layer growth in the ajFOG deposited films is currently being investigated further.
Log (current density) versus electric field, ξOX, for AlPO thin film devices, as-deposited and annealed at 300, 400, 500, and 800 °C, for (a) ajFOG deposition (solid symbols) and (b) spin coating (open symbols). For a representative 400 °C annealed sample, (c) Schottky emission (ln J versus ξox 1/2) dominates at lower applied fields, while (d) Frenkel-Poole conduction (ln J/ξox versus ξox 1/2) is observed at higher fields. All films are single layer depositions with [N] = 0.4 M, with t w = t exp = 120 s for the ajFOG depositions.

The dominant mechanisms of charge transport through a dielectric can be a sensitive indication of film quality. Although Fowler-Nordheim tunneling (FNT) based conduction is desired, charge transport in high electron affinity, low temperature deposited dielectrics is commonly dominated by either “bulk” limited Frenkel–Poole emission (FPE) or electrode limited Schottky emission (SE). In FPE, emission from “bulk” defects limits charge transport and current density, J FPE, is described by
 $${J_{{\rm{PFE}}}} = {\xi _{{\rm{ox}}}}\exp - \left[ {{{q\left\{ {{\varphi _{\rm T}} - {{\left( {{{q{\xi _{{\rm{ox}}}}} \mathord{\left/ {\vphantom {{q{E_{{\rm{ox}}}}} {\pi {\kappa _{\rm{r}}}{\varepsilon _0}}}} \right. \kern-\nulldelimiterspace} {\pi {\kappa _{\rm{r}}}{\varepsilon _0}}}} \right)}^{{1 \mathord{\left/ {\vphantom {1 2}} \right. \kern-\nulldelimiterspace} 2}}}} \right\}} \mathord{\left/ {\vphantom {{q\left\{ {{\varphi _{\rm T}} - {{\left( {{{q{E_{{\rm{ox}}}}} \mathord{\left/ {\vphantom {{q{E_{{\rm{ox}}}}} {\pi {\kappa _{\rm{r}}}{\varepsilon _0}}}} \right. \kern-\nulldelimiterspace} {\pi {\kappa _{\rm{r}}}{\varepsilon _0}}}} \right)}^{{1 \mathord{\left/ {\vphantom {1 2}} \right. \kern-\nulldelimiterspace} 2}}}} \right\}} {kT}}} \right. \kern-\nulldelimiterspace} {kT}}} \right]\quad ,$$
where ξox is electric field across the dielectric, q is the elementary charge, φT is the trap energy depth referenced to the insulator conduction band minimum, k is Boltzmann's constant, T is temperature, ε0 is the permittivity in vacuum, and κr is the electronic component of the dielectric constant (approximately equal to n 2 for ordinary light).
In SE, charge transport is limited by thermal emission over a barrier and current density, J SE, is described by
 $${J_{{\rm{SE}}}} = {A^*}{T^2}\,\exp - \left[ {{{q\left\{ {{\varphi _{\rm B}} + {{\left( {{{q{\xi_{{\rm{ox}}}}} \mathord{\left/ {\vphantom {{q{E_{{\rm{ox}}}}} {4\pi {\kappa _{\rm{r}}}{\varepsilon _0}}}} \right. \kern-\nulldelimiterspace} {4\pi {\kappa _{\rm{r}}}{\varepsilon _0}}}} \right)}^{{1 \mathord{\left/ {\vphantom {1 2}} \right. \kern-\nulldelimiterspace} 2}}}} \right\}} \mathord{\left/ {\vphantom {{q\left\{ {{\varphi _{\rm B}} + {{\left( {{{q{E_{{\rm{ox}}}}} \mathord{\left/ {\vphantom {{q{E_{{\rm{ox}}}}} {4\pi {\kappa _{\rm{r}}}{\varepsilon _0}}}} \right. \kern-\nulldelimiterspace} {4\pi {\kappa _{\rm{r}}}{\varepsilon _0}}}} \right)}^{{1 \mathord{\left/ {\vphantom {1 2}} \right. \kern-\nulldelimiterspace} 2}}}} \right\}} {kT}}} \right. \kern-\nulldelimiterspace} {kT}}} \right]\quad ,$$
where A* is the effective Richardson constant and φB is the barrier height at the metal insulator interface.
To determine whether SE or FPE plays a role in charge transport, ln(J) versus ξox 1/2 and ln(J/ξox) versus ξox 1/2 are plotted in Figs. 6(c) and 6(d), respectively, for both ajFOG and spin-on films annealed at 400 °C. The linear fits in 6(c) suggest that for both films, conduction at low applied field is primarily due to SE, i.e., limited by the thermionic emission of electrons over the metal–insulator barrier. The linear fits in 6(d) suggests that at high field, the charge transport is limited by FPE based transport through defect levels in the bulk of the AlPO. The linearity of conductions plots alone is insufficient to unambiguously assign conduction mechanisms. To increase confidence, we extract κr values from the slopes of the linear fits in Figs. 6(c) and 6(d) and compare them with n 2 determined from the ellipsometery data in Fig. 1. Reference Frenkel27–Reference Alimardani, King, French, Tan, Lampert and Conley29 The linear fitting of SE at low fields and FPE at high fields indicates κr values of ∼2.0 and 2.5, respectively. Both these values compare favorably to the n 2 value (∼2.28) determined from ellipsometery data, increasing confidence in the assignment of SE at low and FPE at high applied electric fields.
The field at which the transition between SE and FPE conduction takes place [Figs. 6(a) and 6(b)] increases with increasing annealing temperature for both deposition techniques, suggesting a reduction in bulk defect levels or perhaps an increase in barrier height due to the formation of an interfacial layer. Above the distinct “knee” in the ln(J) versus ξox plots of the films annealed at 500 and 800 °C, Fowler–Nordheim tunneling, likely through the interfacial layer contributes to conduction as well (see supplementary Fig. S5).
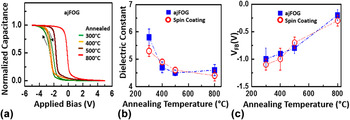
Figure 7(a) shows plots of capacitance versus voltage (C–V) as a function of anneal temperature for ajFOG-deposited AlPO thin films. A large clockwise 0.3-eV hysteresis between forward and return sweeps is observed for the samples cured at 300 °C. The voltage sweep and voltage limit dependent hysteresis is likely due to electron trapping and detrapping in switching traps near the interface between the film and the Si substrate. The hysteresis decreases with increased annealing temperature from 0.3 V at 300 °C to 0.1 V at 500 °C, indicating a decrease in the density of these defects. For samples annealed at 800 °C, no hysteresis is observed.
(a) Representative capacitance versus voltage curves of ajFOG deposited ALPO thin films annealed at various temperatures. (b) Dielectric constant and (c) V FB as a function of annealing temperature for AlPO thin films fabricated using aerosol deposition and spin coating. All films are single layer depositions with [N] = 0.4 M, with t w = t exp = 120 s for the ajFOG depositions.

The dielectric constant (κ) of the film stack (AlPO and interfacial layer) is extracted from the maximum capacitance (C MAX) and plotted versus anneal temperature in Fig. 7(b). For both deposition techniques, κ decreases with anneal temperature, saturating at κ∼4.5 at about 500 °C, consistent with previously published results for spin coated AlPO films. As expected, these low frequency dielectric constant values are much higher than the electronic component, κr, extracted above.
Figure 7(c) shows experimentally determined V FB as a function of annealing temperature. CV stretch-out is reduced and V FB shifts positive with increasing anneal temperature for both aerosol deposited and spin coated films. The reduction in CV stretch-out indicates a reduction in interface trap density at the insulator–substrate interface. The deviation from the ideal flat band voltage, V FB-ideal ≈ −0.76 V, is an indication of fixed charge in the films. The negative shift from V FB-ideal in the samples processed at 300 and 400 °C indicates positive fixed charge, while the positive shift from V FB-ideal at 800 °C indicates negative fixed charge near the insulator–substrate interface. After the 500 °C anneal V FB ≃ V FB-ideal, indicating the absence of significant fixed charge near the interface. The similar V FB trend with annealing temperature is another indication that the film quality produced by ajFOG deposition is comparable to films produced via spin coating.
IV. CONCLUSION
An aerosol jet fog deposition system with a unique atomizer composed of two opposing jets located inside the deposition chamber is introduced. The two opposing jets force head-on collisions of precursor streams that shear large droplets into smaller. The orientation and location of the atomizer allows for the formation of a highly uniform fog, enables the use of low-volatility precursors, and offers the possibility of mixing two different precursors. High-quality AlPO thin films are deposited uniformly on 150-mm Si substrates at room temperature and slightly sub-atmospheric pressure via aerosol deposition in pulse mode using a low volatility aqueous precursor. The thickness of the AlPO film varies less than 4% over the entire wafer with RMS roughness below 0.3 nm. The uniformity of the ajFOG deposited film is comparable to state of the art vacuum deposition techniques. Based on a systematic study of precursor concentration, the characteristic fog settling time, the wait time between fog formation and substrate exposure, fog exposure time, and number of coating cycles, a model of ajFOG deposition is developed that allows accurate prediction of film thickness based on these process parameters. A side by side comparison with spin coated thin films deposited using the same precursor reveals that the ajFOG deposited AlPO thin films have comparable quality in terms of thickness uniformity, density, surface roughness, morphology, electrical properties, and charge transport mechanisms. These results indicate that this new aerosol jet fog deposition technique is a promising option for arbitrarily large-area solution deposition of high-quality thin films at room temperature and slightly sub-atmospheric pressure.
Supplementary Material
To view supplementary material for this article, please visit http://dx.doi.org/10.1557/jmr.2016.341.
Supporting information including a photograph of the ajFOG deposition system, images of ajFOG films as a function of UV-ozone surface treatment, a thickness map showing air flow thinning of the leading edge during the movement of wafer from the chamber into the load lock, a linear plot of thickness versus wait time for fixed exposure and precursor concentration, and a plot showing Fowler–Nordheim conduction charge transport in aerosol and spin coated AlPO thin films deposited on Si and annealed at 500 and 800 °C is available. (PDF)
ACKNOWLEDGMENTS
This material is based upon work supported by the US National Science Foundation under grant number CHE-1102637. The work was done in the Center for Sustainable Materials Chemistry, an NSF Phase-II Center for Chemical Innovation.