Implications
Different prepartum feeding strategies have been devised to facilitate the adaptation of dairy cows to the onset of lactation. Findings of this study indicate that increasing the supply of non-fibrous carbohydrates (NFC), at similar intakes of energy and protein, during the last 3 weeks before calving, has no major effects on the postpartum metabolic status or milk production compared with a diet with a higher level of fiber.
Introduction
The transition between late gestation and the onset of lactation is one of the most challenging periods for the modern dairy cow. After calving, nutrient requirements increase at a higher rate than dry matter (DM) intake resulting in a negative energy balance (NEB) (Grummer, Reference Grummer1995). This leads to mobilization of body reserves, and if is too severe it may increase the risk of metabolic disorders which could result in poor productive and reproductive performance (Drackley and Cardoso, Reference Drackley and Cardoso2014).
As a result, different prepartum nutritional strategies have been proposed to facilitate the adaptation of the cow and reduce the incidence of health issues. One of these strategies advocates the use of diets with high levels of non-fibrous carbohydrates (HNFC). The rationale behind this strategy is to provide more gluconeogenic substrates that can ultimately result in a higher glucose output, and may trigger an insulin response, which can reduce the mobilization of body reserves (Friggens et al., Reference Friggens, Andersen, Larsen, Aaes and Dewhurst2004). Moreover, a greater NFC concentration in the prepartum diet could allow a better adaptation of the rumen microorganisms to the postpartum diets, which typically have HNFC to support glucose requirements for lactose synthesis, and stimulate the growth of the rumen papillae (Roche et al., Reference Roche, Bell, Overton and Loor2013). In turn, these changes could potentially increase postpartum DM intake and result in a less severe NEB of the cows.
Overton and Waldron (Reference Overton and Waldron2004) reviewed several experiments which reported diverse benefits of HNFC concentration diets during the prepartum period relative to low non-fibrous carbohydrates (LNFC) concentration ones. The observed effects included greater prepartum and postpartum DM intake, increased milk yield, or lower blood concentrations of non-esterified fatty acids. However, they pointed out that in most of these experiments, differences in NFC concentrations also resulted in differences in energy content of the diets and energy intake (i.e. diets rich in NFC had higher energy content, which likely resulted in a higher energy intake). As a result, these effects were confounded and the previously mentioned benefits of feeding diets rich in NFC cannot be entirely ascribed to differences in the source of carbohydrates used.
Grazing is commonly used as a main feed in many countries. However, when high-producing dairy cows are managed under these systems, they may not be able to eat enough nutrients to fulfill their requirements (Kolver, Reference Kolver2003). This results in unbalanced metabolic and endocrine profiles, which ultimately could limit their productive and reproductive performance (Meikle et al., Reference Meikle, Kulcsar, Chilliard, Febel, Delavaud, Cavestany and Chilibroste2004; Cavestany et al., Reference Cavestany, Blanc, Kulcsar, Uriarte, Chilibroste, Meikle, Febel, Ferraris and Krall2005). For this reason, even if the adaptation mechanisms before calving could be successfully manipulated through an increased NFC content in the prepartum diet, it is not clear if lactating cows under a pasture-based system may fully take advantage of this feeding strategy. Therefore, the objectives of this experiment were to determine the effects of modifying the carbohydrate source in the prepartum diet on (a) DM intake, (b) milk production and (c) metabolic status in cows managed in a pasture-based system during the postpartum period. Our hypothesis was that providing a higher amount of NFC in the prepartum diet would increase postpartum DM intake and milk yield in dairy cows.
Material and methods
Animals, treatments and experimental design
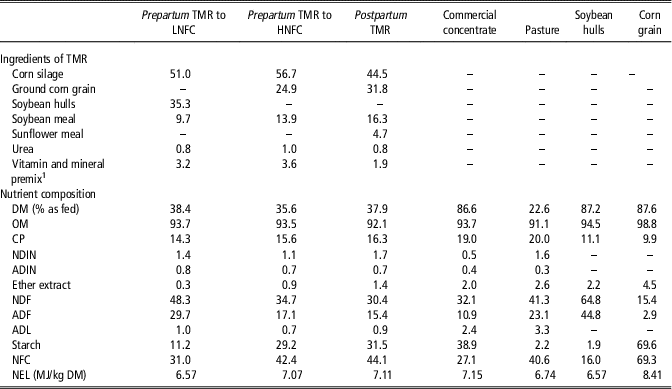
The experiment was undertaken out at the Dairy Research Unit ‘La Estanzuela’ of the Instituto Nacional de Investigación Agropecuaria (INIA), in Colonia, Uruguay (34°35´S, 57°70´W). Twenty-four multiparous non-lactating pregnant Holstein cows with an average body condition score (BCS) of 3.4±0.3 units (Edmonson et al., Reference Edmonson, Lean, Weaver, Farver and Webster1989) were grouped in 12 blocks by expected calving date, previous lactation 305-day milk yield (mean=6736±866 kg) and BW (mean=566±61 kg), and within each block were randomly assigned to receive one of the following treatments: (1) a HNFC prepartum diet where the main energy ingredient was ground dry corn; or (2) a LNFC prepartum diet where the main energy ingredient were pelleted soybean hulls. Each ingredient was offered daily within a total mixed ration (TMR) consisting of corn silage, soybean meal, urea and a vitamin–mineral premix (Table 1). The TMR was individually offered during the last 3 weeks before the expected calving date. Both experimental diets were formulated to meet the requirements for a 600 kg cow with a gestation of 260 days (National Research Council (NRC), 2001). Each diet was restrictively fed (HNFC=8.3 kg DM/day; LNFC=9.0 kg DM/day) to ensure that total net energy for lactation (NEL) and CP daily intake were similar between treatments.
Ingredients and nutrient composition of prepartum total mixed ration (TMR) with low (LNFC) or high (HNFC) content of non-fibrous carbohydrates (NFC) for dairy cows, and of postpartum TMR, commercial concentrate, pasture, corn grain and soybean hulls (all values are expressed as % dry matter (DM), unless otherwise indicated)

OM=organic matter; NDIN=neutral-detergent insoluble nitrogen; ADIN=acid-detergent insoluble nitrogen; NEL=net energy for lactation.
1 Provided 35 g/kg of Ca, 4.5 g/kg of P, 60 g/kg of Mg, 199 g/kg of Cl, 5.5 g/kg of K, 29.7 g/kg of Na, 89 g/kg of S, 7 mg/kg of Co, 400 mg/kg of Cu, 20 mg/kg of I, 14 mg/kg of Se, 1600 mg/kg of Zn, 1000 IU/kg of vitamin A, 150 IU/kg of vitamin D, 4000 IU/kg of vitamin E (Nutriparto potenciado; Nutrisur, Canelones, Uruguay).
After calving, all animals were managed as a single group until day 56 postpartum and milked twice daily (0630 and 1630 h). Between PM and AM milkings all cows grazed a strip of permanent pasture, consisting mainly of tall-fescue (Festuca arundinacea) and alfalfa (Medicago sativa), with a pre-grazing herbage mass of 1862±191 kg DM/ha and a daily forage allowance of 20 kg DM/cow (both calculated at a height of 0 cm). After AM milking, cows were offered 14 kg DM/day of a postpartum TMR. Postpartum diets were formulated to meet or exceed requirement of a 600 kg dairy cow producing 30 kg/day (NRC, 2001). During each milking, 2 kg (as fed) of a commercial concentrate were offered to each cow (Table 1). Cows had ad libitum access to fresh water during the experimental period.
Nutrient intake and feed chemical analyses
Individual feed intake was measured on weeks −2, −1, +1 and +2 (calving=0). During the prepartum period, TMR DM intake was measured for 4 consecutive days during each week, by weighing the amounts of feed offered and refused by each animal. During the postpartum period, concentrate and TMR DM intake were measured for 4 consecutive days during each week, by weighing the amounts of feed offered and refused by each animal. Pasture DM intake was estimated by the difference of requirements method as described by Macoon et al. (Reference Macoon, Sollenberger, Moore, Staples, Fike and Portier2003). Samples of prepartum and postpartum TMR, commercial concentrate and pasture (cut at a height of 5 cm) were collected daily during each week where DM intake was measured and composited to obtain one sample per week. All samples were kept frozen at −20°C until analysis. Samples were analyzed for DM, ash, total N and ether extract (methods 934.01, 942.05, 955.04, and 920.39, respectively; Association of Official Analytical Chemists, 1990), NDF (using heat-stable α-amylase and sodium sulfite), ADF and ADL (Van Soest et al., Reference Van Soest, Robertson and Lewis1991), expressed exclusive of residual ash, and neutral-detergent insoluble N and acid-detergent insoluble N (Licitra et al., Reference Licitra, Hernandez and Van Soest1996). Starch concentration was measured as described by Kozloski et al. (Reference Kozloski, Rocha, Ribeiro Filho and Perottoni1999). The concentration of NFC was estimated as 100–(% NDF + % CP + % ether extract + % ash). The NEL concentration for each feed was calculated according to NRC (2001) from feed analyses, actual DM intake and individual cow characteristics during each week (Table 1).
Milk yield and composition, BW and body condition score measurements
Milk yield was recorded daily post-calving, and yield of 3.5% fat-corrected milk (FCM) was calculated according to Tyrrell and Reid (Reference Tyrrell and Reid1965) as FCM (kg)=0.4324 × milk yield (kg)+16.218 × fat yield (kg). Each week, individual milk samples with bronopol preservative were obtained from four consecutive milkings and fat, protein, total casein, lactose and milk urea nitrogen (MUN) were determined by IR analysis (Bentley 2000; Bentley Instruments Inc., Chaska, MN, USA). From day 21 before expected calving until day 56 postpartum, BCS was recorded weekly by the same technician using the five-point scale proposed by Edmonson et al. (Reference Edmonson, Lean, Weaver, Farver and Webster1989), and BW was measured on 2 consecutive days with a digital scale (EC2000 scale; True test, Auckland, New Zealand).
Blood sampling and chemical analyses
From day 21 before expected calving until day 56 postpartum, individual blood samples were collected weekly by jugular venipuncture before AM milking into tubes without anticoagulants. Tubes were left at 20°C for 2 h, centrifuged (3000×g for 20 min at 20°C), and serum was then separated and stored at −20°C until analyzed for insulin and urea. Another blood sample was collected into a tube with sodium fluoride and Na2-EDTA (Wiener Laboratorios, Rosario, Argentina) and was immediately centrifuged (3000×g for 20 min at 20°C). Plasma was then harvested and stored at −20°C for analysis of glucose. Concentrations of serum urea, and plasma glucose were determined by spectrophotometry (Unico S1200; United Products & Instruments Inc., Dayton, OH, USA) using commercial kits (urea : urease/salicylate; BioSystems S.A., Barcelona, Spain; glucose : glucose oxidase/peroxidase; BioSystems S.A.). Assay sensitivity was 0.01 and 0.2 mM for glucose and urea, respectively. Intraassay CV for controls low (glucose=4.7 mM; urea=5.5 mM) and high (glucose=14.9 mM; urea=9.7 mM) were less than 10% for both assays. Serum insulin concentrations were determined by an immunoradiometric assay (Diasource Immuno Assays, Nivelles, Belgium), and intraassay CV was 10.2% and 10.4% for low (26.3 μIU/ml) and high (95.3 μIU/ml) controls, respectively.
Statistical analyses
Data were analyzed using SAS software version 9.1 (SAS Institute Inc., Cary, NC, USA). Prepartum and postpartum data were analyzed separately. Intake and milk production data were first reduced to weekly means before statistical analysis. Intake, milk production, BCS, BW and blood traits data were analyzed as a randomized block design with repeated measures using the MIXED procedure, with a model that included treatment (HNFC, LNFC), week (−2, −1, 1 and 2 for DM intake; −3, −2, −1, 0, 1, 2, … , 8 for BW, BCS and blood traits; 2, 3, … , 8 for milk traits), and the treatment by week interaction as fixed effects, and block (1 to 12) as random effect. The covariance structure used was AR(1) (Littell et al., Reference Littell, Henry and Ammerman1998), and covariates adjustments were made for BCS, BW and blood traits using information collected at week −3.
Residuals were tested for a normal distribution using the UNIVARIATE procedure. Means were compared with a Tukey test, significant differences were declared at P⩽0.05 and trends were discussed at 0.05<P⩽0.10. One cow in the LNFC treatment was excluded from the analysis due to causes unrelated to the experiment.
Results
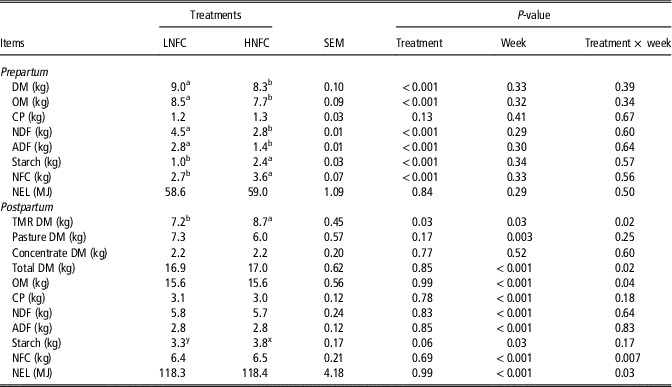
Average days of cows under treatment were 21.1±2.6 and 20.6±2.6 days for HNFC and LNFC, respectively. There were no differences in total NEL or CP intake during the prepartum period. Cows in the HNFC treatment had greater (P<0.001) starch intake and lesser (P<0.001) NDF intake than the LNFC cows (Table 2). The contribution of NEL from soybean hulls and corn grain to total NEL intake was 34.2±1.1% and 39.2±2.2% for LNFC and HNFC, respectively. Prepartum DM or nutrient intakes were not affected by week of measurement (Table 2).
Prepartum and postpartum dry matter (DM) and nutrient daily intake of dairy cows offered a isoenergetic prepartum diet with a low (LNFC) or high (HNFC) concentration of non-fibrous carbohydrates (NFC)

OM=organic matter; NEL=net energy for lactation; TMR=total mixed ration.
a,bValues within a row with different superscripts differ significantly at P<0.05.
x,yValues within a row with different superscripts differ significantly at 0.05<P⩽0.10.
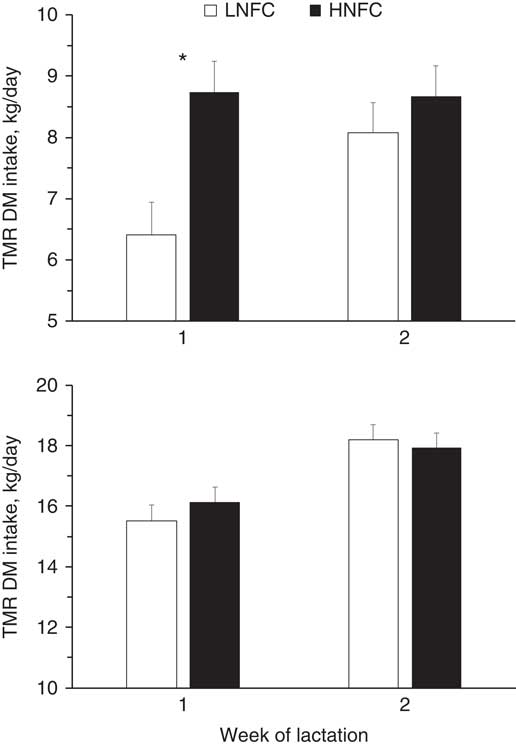
Postpartum TMR DM was greater (P=0.03) and starch intake tended to be greater (P=0.06) in the HNFC treatment. Conversely, there was no treatment effect on total DM, CP or fiber intakes. However, an interaction between treatment and week was detected for TMR (P=0.02), total DM (P=0.02), organic matter (P=0.04), NFC (P<0.01) and NEL (P=0.03) intake (Table 2). At week 1 after calving, HNFC had a greater intake of TMR than LNFC (8.7 v. 6.4 kg DM; SEM=0.50; P<0.01), but no differences were detected between treatments by week 2 (Figure 1). For total DM, organic matter, NFC and NEL intake, although no differences were detected between treatments on week 1, rate of increase of total DM (2.6 v. 1.8 kg; SEM=0.25; P=0.04), organic matter (2.4 v. 1.9 kg; SEM=0.20; P=0.07), NFC (1.1 v. 0.6 kg; SEM=0.12; P=0.02) and NEL (18.8 v. 13.8 MJ; SEM=1.55; P=0.05) between weeks 1 and 2 was or tended to be greater in LNFC than HNFC (Figure 1). Irrespective of treatment, intake of DM and nutrients were greater (P<0.03) in week 2 compared to week 1 (Table 2; Figure 1).
Postpartum total mixed ration (TMR) and total dry matter (DM) intake of dairy cows fed prepartum isoenergetic diets that provided high (HNFC) or low (LNFC) amounts of non-fibrous carbohydrates. Vertical bars represent SEM. *In 1 week indicate differences between treatment (P<0.05).

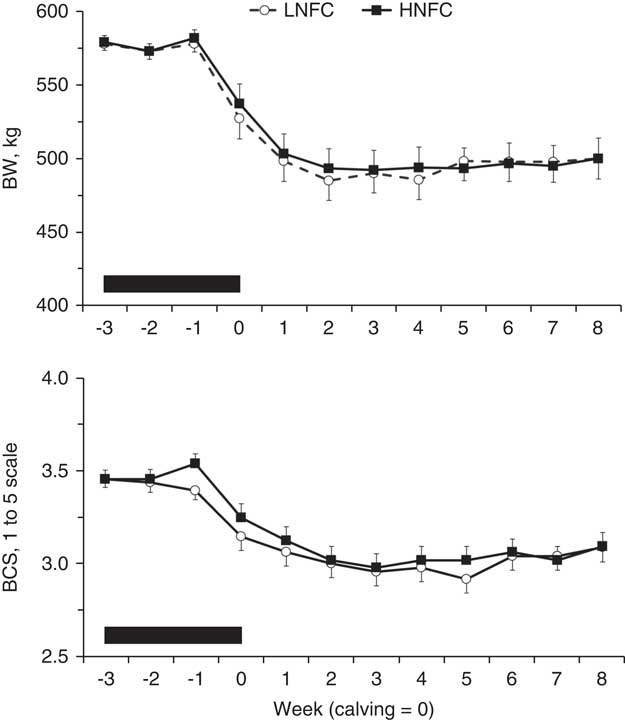
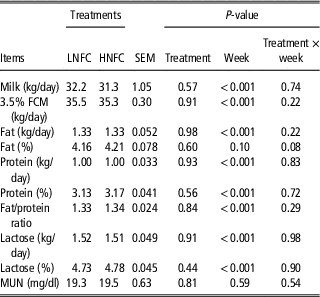
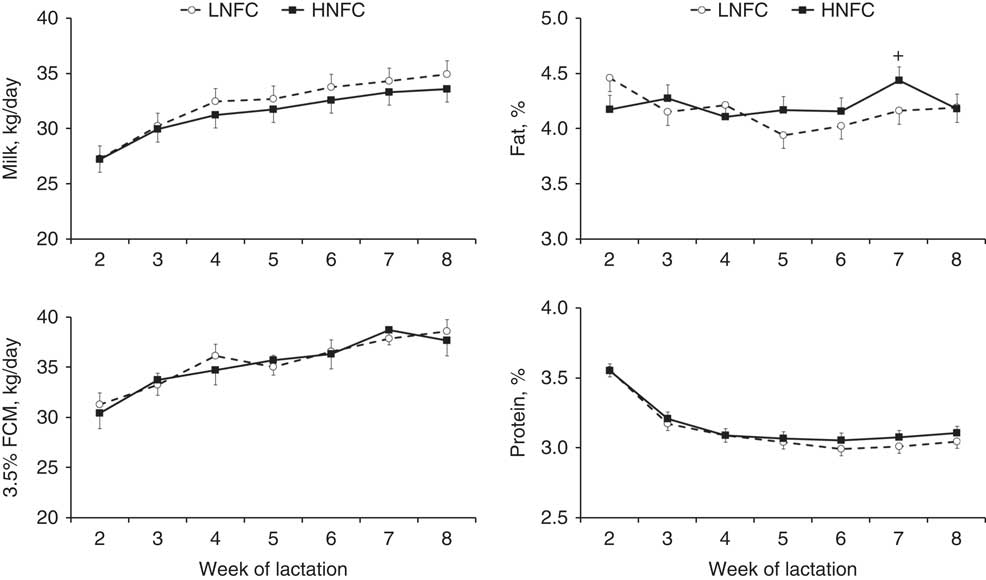
Prepartum and postpartum BCS (3.5±0.04 and 3.1±0.06, respectively) and BW (576±5.1 kg and 499±12.1 kg, respectively) were not affected by the treatments, nor by a treatment per week interaction. Neither BCS nor BW were affected by the week of measurement during the prepartum period, but postpartum BCS and BW decreased from 3.2±0.05 to 3.0±0.05 from weeks 0 to 3, and from 532±10.7 to 489±10.7 kg from weeks 0 to 2, respectively, and then remained constant (Figure 2). Treatments did not affect milk and 3.5% FCM yields, fat, protein, lactose percentages and yields, fat–protein ratio or MUN (Table 3; Figure 3). A trend toward a treatment × week interaction (P=0.08) was observed for milk fat percentage, where HNFC tended to have a greater fat concentration than LNFC only by week 7 of lactation (Figure 3).
Body weight and body condition score (BCS) of dairy cows fed prepartum isoenergetic diets that provided high (HNFC) or low (LNFC) amounts of non-fibrous carbohydrates. Horizontal bars indicate the period when treatments were applied. Vertical bars represent SEM. For prepartum and postpartum BW, there was no effect of treatment (P=0.76 and P=0.84, respectively), or treatment × week interaction (P=0.40 and P=0.72, respectively), but there was a significant effect of week (P<0.01 and P<0.001, respectively); for prepartum and postpartum BW, overall SEM was 5.1 and 12.1 kg, respectively. For prepartum BCS there was no effect of treatment (P=0.18), week (P=0.59) or treatment × week interaction (P=0.11). For postpartum BCS there was no effect of treatment (P=0.62) or treatment × week interaction (P=0.84), but a significant week effect was detected (P<0.001); for prepartum and postpartum BCS, overall SEM was 0.04 and 0.06 units, respectively.

Milk yield and composition of dairy cows offered a prepartum isoenergetic diet with a low (LNFC) or high (HNFC) concentration of non-fibrous carbohydrates

3.5 FCM=3.5% fat-corrected milk; MUN=milk urea nitrogen.
Milk and 3.5% fat-corrected milk (FCM) yield, milk fat and protein percentage in dairy cows fed prepartum isoenergetic diets that provided high (HNFC) or low (LNFC) amounts of non-fibrous carbohydrates. Vertical bars represent SEM. +In 1 week indicate a trend toward a difference between treatment (P<0.10).

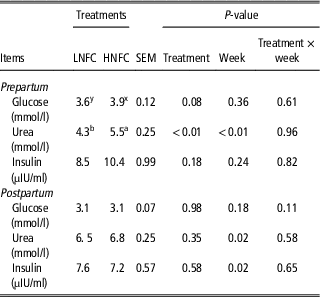
No treatment × week interaction was detected for prepartum or postpartum blood traits (Table 4). Prepartum glucose concentration tended to be greater (P=0.08) in the HNFC group, whereas prepartum insulin concentration was not affected by treatment. Prepartum urea concentration was greater (P<0.01) in the HNFC than in the LNFC group (Table 4). Although prepartum concentrations of glucose and insulin were not affected by the week of measurement, there was an effect (P<0.01) on urea concentration (week −2=4.2±0.27 v. week −1=5.5±0.25). Treatment did not affect postpartum glucose, insulin or urea concentrations. No effect of week of measurement was detected on glucose concentration, but insulin concentration increased from 6.7±0.83 μUI/ml to 8.6±0.83 μUI/ml from weeks 1 to 5.
Prepartum and postpartum blood metabolite and insulin concentrations of dairy cows offered a prepartum isoenergetic diet with a low (LNFC) or high (HNFC) concentration of non-fibrous carbohydrates

a,bValues within a row with different superscripts differ significantly at P<0.05.
x,yValues within a row with different superscripts differ significantly at 0.05<P ⩽ 0.10.
Discussion
As designed, there were no differences in prepartum NEL or CP intake during the prepartum period, but NFC (30%), and starch (138%) intakes were greater in the HNFC treatment. Even though isolating the effect of varying the level of inclusion of NFC in isocaloric prepartum diets has been the object of previous research, the difference in NFC concentrations between diets in those studies was inferior than in the present experiment. For example, Smith et al. (Reference Smith, Waldron, Drackley, Socha and Overton2005) compared two prepartum diets which had a difference in NFC and starch concentrations of 6.7 and 9.7 percentage units, respectively. Amanlou et al. (Reference Amanlou, Zahmatkesh and Nikkhah2008) tested the effect of replacing ground wheat grain by a mixture of ground barley grain and wheat bran, resulting in diets with NFC concentrations that differed in only 3.9 percentage units. However, in our experiment the differences between HNFC and LNFC diets were 11.4 and 18.0 percentage units for NFC and starch concentrations, respectively. Roche et al. (Reference Roche, Kay, Phyn, Meier, Lee and Burke2010) tested prepartum diets with a greater difference in NFC concentration than in the present study (18.6 percentage units); however, diets also differed in CP concentrations, and although not reported, prepartum CP intake seemed to differ too.
Interestingly there was no effect of week of measurement on prepartum DM and nutrient intakes, contrary to what has been reported in previous research where voluntary feed intake declined during the last weeks before parturition (Bell, Reference Bell1995; Drackley and Cardoso, Reference Drackley and Cardoso2014). Roche et al. (Reference Roche, Bell, Overton and Loor2013) suggested that this decrease in prepartum DM intake principally occur in cows fed diets with high concentrations of starch. This would explain the maintenance of prepartum DM intake levels at least in the LNFC treatment (which supplied lower levels of starch) but not in the HNFC one. The lack of effect of treatment on prepartum BCS and BW is consistent with the similar prepartum intake of NEL.
The fact that cows in the HNFC treatment tended to have a greater TMR intake during the first week of lactation, may suggest a positive effect of increasing NFC during the prepartum period. This is consistent with previous studies that suggested that increasing NFC during the prepartum period allows a better adaptation of the ruminal microorganisms to postpartum diets (Roche et al., Reference Roche, Bell, Overton and Loor2013). In the present experiment, the concentration of starch of the prepartum HNFC TMR and postpartum TMR was very similar, which may have allowed a more favorable environment for adaptation of rumen microflora to ferment high-starch diets. However, an increased rumen papillae development due to a higher prepartum provision of NFC is unlikely, given that volatile fatty acids production is related to energy intake (Bergman, Reference Bergman1990; Sutton et al., Reference Sutton, Dhanoa, Morant, France, Napper and Schuller2003), which was similar between treatments. In turn, it could be expected that ruminal butyrate production, which is the main volatile fatty acid influencing rumen papillae development (Sakata and Tamate, Reference Sakata and Tamate1979), was also similar between treatments. Despite the positive effect of HNFC treatment on postpartum TMR intake, the effect was rather transient and restricted to the 1st week after calving and was not reflected in a greater total DM or NEL intake. Smith et al. (Reference Smith, Waldron, Drackley, Socha and Overton2005) did not report any effect of varying the concentration of NFC of isocaloric prepartum diets on postpartum DM intake. The lack of effect of treatments on milk yield, and composition and MUN is consistent with previous experiments (Smith et al., Reference Smith, Waldron, Drackley, Socha and Overton2005; Amanlou et al., Reference Amanlou, Zahmatkesh and Nikkhah2008; Roche et al., Reference Roche, Kay, Phyn, Meier, Lee and Burke2010). Although DM intake was not measured during the entire experimental period, the lack of differences in milk production indicates that DM intake was not different between treatments after week 2, and this is consistent with the lack of differences in BCS during early lactation.
Although caution should be taken when interpreting blood results due to the low number of animals that were used in each treatment, the greater prepartum glucose concentration in the HNFC is consistent with a greater starch intake. This probably resulted in a greater amount of undigested starch reaching the duodenum and a greater production of propionic acid in the rumen, which might have led to a greater hepatic gluconeogenesis rate. Our results agree with Amanlou et al. (Reference Amanlou, Zahmatkesh and Nikkhah2008), who reported an increase in prepartum glucose concentrations after increasing the level of inclusion of NFC in isocaloric prepartum diets. However, the lack of effect of treatment on prepartum insulin concentration was unexpected because insulin secretion in ruminants is responsive to the level of glycemia (Harmon, Reference Harmon1992). We speculate that the magnitude of the increase in blood glucose was not enough to elicit an increase in insulin concentration. In this regard, our findings agree with Roche et al. (Reference Roche, Kay, Phyn, Meier, Lee and Burke2010) who did not observe a consistent effect of increasing the NFC concentration of prepartum diets on prepartum insulin concentration.
Although prepartum CP intake was similar between treatments, the greater prepartum urea concentration in HNFC than LNFC can be attributed to differences in the supply of rumen degradable protein (RDP), fermentable energy or both, which may have resulted in differences in the balance of RDP. Using information of actual DM intake and BW of the cows at week 2 before calving, the predicted balance of RDP (NRC, 2001) was 82 and 110 g/day for LNFC and HNFC, respectively, which could be partially explained by a level of inclusion of soybean meal and urea that was 43% and 20% higher, respectively, in the HNFC TMR compared with the LNFC TMR. Gonda and Lindberg (Reference Gonda and Lindberg1994) also found a positive relationship protein balance in the rumen and blood urea concentration. This is expected because N available in the rumen which is not incorporated into microbial protein, is transferred across the rumen wall and converted to urea in the liver (Firkins and Reynolds, Reference Firkins and Reynolds2005).
Roche et al. (Reference Roche, Kay, Phyn, Meier, Lee and Burke2010) reported no effect of altering the prepartum supply of NFC on postpartum blood insulin, glucose and urea concentrations, or on other metabolic hormones (i.e. IGF-I), and when detected it was limited to the 1st week of lactation. Collectively, our results suggest that the energy and protein status of the animals was similar after calving and are consistent with the lack of effect of treatments on milk yield, milk fat/protein ratio (which has been described as an adequate marker for NEB during early lactation; Buttchereit et al., Reference Buttchereit, Stamer, Junge and Thaller2011) and postpartum BCS. They also strengthen the idea that postpartum nutrient intake was not affected by treatment, at least during the first 2 weeks after calving.
In conclusion, increasing the prepartum intake of NFC through the inclusion of corn grain at a similar NEL and CP intake had no effects on milk production or metabolic status in dairy cows, although nutrient intake was greater in the immediate week after calving when compared to a prepartum diet with a lower supply of NFC.
Acknowledgements
The authors thank Marcelo Pla, Luciana Bertora, Martín Giménez, Patricio León, Manuela Malvasio, Gustavo Melitón, Nicolás Olivera, Sabrina Pimentel, Cecilia Ponce de León and Gonzalo Ruiz for assistance with animal care. The experiment was supported by INIA (PL_07_0_00).
Declaration of interest
The authors declare no conflicts of interest.
Ethics statement
All procedures involving animals were approved by the Bioethics Committee on the Use of Animals of INIA.
Software and data repository resources
None of the data were deposited in an official repository.