I. INTRODUCTION
Efficient and versatile computational methods for numerical modeling and the computer-aided design (CAD) of complex electromagnetic structures have gained importance in recent years, due to the ever-increasing progress of computational resources. The problems that can be solved are now growing in complexity, in terms of the number of unknowns, fine details, frequency bands, complicated geometries, etc. [Reference Itoh1, Reference Peterson, Ray and Mittra2].
The numerical analysis of periodic problems has been a well-known topic in connection with studies on crystal lattices in theoretical physics and on canonical devices for microwaves, such as large arrays and filter configurations. Nowadays, many new challenging applications involving electromagnetic periodic configurations can be found in electromagnetic band-gap (EBG) structures, in frequency-selective surfaces (FSS), and in new artificial micro- and nano-structured materials [Reference Munk3–Reference Baccarelli and Capolino5].
For all of these increasingly diverse classes of structures, the need for accurate and efficient numerical analysis tools is of paramount importance. The fast solution of scattering and radiation problems is necessary, e.g., for the design of synthetic surfaces and the homogenization of artificial materials, as well as for the study of the excitation of periodic structures illuminated by either a plane wave or a finite source, via the application of plane-wave expansion methods or the array scanning method [Reference Valerio, Baccarelli, Burghignoli, Galli, Rodriguez-Berral and Mesa6].
The possibility to perform full-wave dispersive studies on various kinds of periodic structures is also useful for the design of microwave filters, FSS and EBG-like structures, and for the characterization of periodic leaky-wave antennas [Reference Munk3, Reference Caloz and Itoh4, Reference Oliner, Jackson and Volakis7]. In the latter case, it is extremely useful to extend the dispersive study to nonspectral representations, by allowing for improper complex solutions (i.e., leaky waves), which can be very useful for describing radiation effects on such structures.
II. BACKGROUND ANALYSIS
One of the most versatile and established approaches to the full-wave numerical solution of the above described classes of periodic problems is based on integral-equation formulations solved through the method of moments (MoM) [Reference Itoh1, Reference Peterson, Ray and Mittra2, Reference Michalski and Zheng8]. However, the slow convergence of the series that appear in the computation of the kernels is currently the main issue encountered in solving such integral equations for periodic structures [Reference Valerio, Baccarelli, Burghignoli and Galli9]. The problems can be formulated inside a single spatial period (“unit cell”), and the periodicity can be included in the kernels (i.e., the periodic Green's functions), which can be computed as a superposition of periodic sources (i.e., as a “spatial series”) or as a sum of spatial harmonics (i.e., as a “spectral series”). While the first representation is usually slowly converging (at least for lossless structures) and is not valid for improper waves where the wavenumber is complex, the second is faster converging (though still converging somewhat slowly) and works in the case of improper waves, unless the observation point approaches the periodic sources (which is required in most MoM solutions). For MoM applications, acceleration methods are required to reach a reliable and fast convergence of the relevant series [Reference Valerio, Baccarelli, Burghignoli and Galli9].
In free-space problems, one of the most effective acceleration approaches is the Ewald method, leading to an expression of the periodic Green's function as the sum of a modified spatial and a modified spectral series, both with Gaussian convergence [Reference Valerio, Baccarelli, Burghignoli and Galli9, Reference Capolino, Wilton and Johnson10]. This method can be easily implemented in many periodic configurations and with different kinds of sources [Reference Capolino, Wilton and Johnson10].
If the periodic inclusions are embedded in a multilayered media, rather than in a homogeneous space, the Green's functions are considerably more complicated. In this case a mixed-potential integral equation (MPIE) approach is possible, leading to weaker spatial singularities in the spatial-domain MoM compared to working directly with the fields [Reference Michalski and Zheng8]. Different dyadic and scalar Green's functions are needed in the MPIE; the various components have spectral series with different convergence features.
Some of the components, in particular the ones required in transverse problems (where the metallization is planar and parallel to the layer interfaces), can be accelerated with the extraction of spectral terms corresponding to homogeneous-medium Green's functions, which can be further speeded up with the Ewald method as described above.
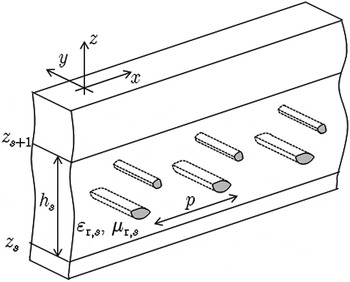
On the other hand, the components required to treat vertical current elements (i.e., those orthogonal to the stratification planes) need the extraction of different spectral terms, which are not simple homogeneous-medium Green's functions. An original extension of the acceleration approach for general multilayered structures embedding cylindrical-type inclusions is outlined next (see Fig. 1 as a reference structure). The whole implementation is subsequently validated with suitable numerical tests for various practical periodic structures.
An example of the geometry under consideration, with the relevant coordinate system and parameters: a multilayered structure with arbitrarily shaped cylindrical-type periodic metallic or dielectric inclusions.

III. ACCELERATION THROUGH ASYMPTOTIC EXTRACTIONS
In this section, the asymptotic extractions for different kinds of mixed potentials are summarized. The extracted terms consist of quasi-static images of a source point reflected or transmitted by the nearest interfaces: three terms (a direct term and two reflected terms) if the source and observation points are in the same layer, and only one direct term if the source and observation points are in adjacent layers. If they are separated by one or more layers, the asymptotic extractions are generally unnecessary since the Floquet modes of the spectral representation decay exponentially, with faster convergence rates for greater separation between the source and observation points. Problems may still arise when the source and observation points are separated by one or more layers that are very thin, or when they are within the same layer that is very thin. This aspect is not pursued here. However, this aspect does not limit the application of the computational methods described in this section to problems involving general multilayered structures.
The general potential G from the periodic sources is expressed with a spectral series of the form

where r and r′ are the observation and source points, respectively,  is a spectral-domain Green's function for a uniform (in y) source, which is known in closed form for a general layered structure; k xn = k x0 + 2π n/p is the wavenumber of the nth harmonic along the x direction, with k x0 being the phase shift (possibly complex) between adjacent unit cells.
A) Transverse potentials
A general transverse component G of the potentials in the previous section can be computed as follows:
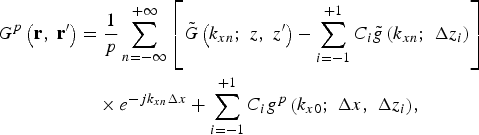
where the three extracted terms  are homogeneous-medium spectral-domain Green's functions; the terms i = 1 and −1 refer to images that correspond to waves reflected at the top and bottom layer interfaces, while i = 0 corresponds to the direct term. Also, Δx = x− x′ and Δz i is a vertical distance depending on the image considered. The terms g p are homogeneous-medium periodic Green's functions, which can be efficiently computed by the Ewald method as previously mentioned [Reference Valerio, Baccarelli, Burghignoli and Galli9, Reference Capolino, Wilton and Johnson10]. The vertical wavenumber needed in the computation of the spectral-domain Green's function is
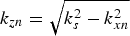 , where k s is the wavenumber for the source medium.
B) Vertical potentials
If vertical current elements are also present, the computation of additional potentials is required. The corrective scalar potential P zp can be accelerated as
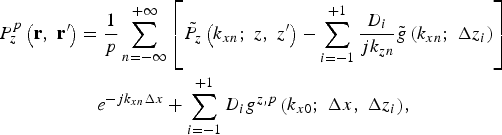
where the main difference with respect to (2) is the presence of an extra factor 1/(jk zn) multiplying each extracted spectral-domain homogeneous-medium Green's function. Due to this factor, the acceleration of the Green's functions g z,p cannot be performed with the usual methods developed in free space (e.g., the usual Ewald method).
Nevertheless, this new function can be expressed in the spatial domain as a potential due to an array of half-plane currents, since the spectral factor 1/(jk zn) is equivalent, in the spatial domain, to an integration along the vertical z-axis:

The Ewald method can then be suitably modified by integrating both the spectral and spatial series along z: two new series are obtained, each with Gaussian convergence. Their terms are the z-integrals of the corresponding terms in the standard Ewald method, each one expressed either in closed form (in the spectral series) or through fast-converging integrals (in the spatial series) [Reference Valerio, Wilton, Jackson and Galli11].
The only nonzero off-diagonal entry, G Azx, of the dyadic potential  can be similarly accelerated using the approach (3) and (4), apart from a further factor k xn in the extracted terms, corresponding to the derivative along x of (4).
IV. NUMERICAL TESTS
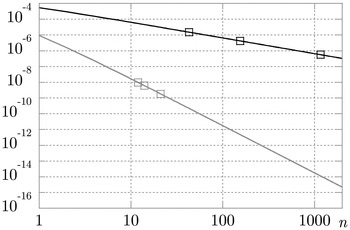
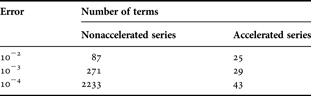
The effectiveness of the acceleration methods previously described is proven first with numerical results on the convergence of the accelerated potentials. As an example of the enhanced convergence obtained with extraction (3), the behavior (decay of the magnitude with n) of the terms of the spectral series with and without the extraction is shown in Fig. 2. The markers correspond to the number of terms retained in order to grant a relative error of 10−2, 10−3, or 10−4.
Decay of the magnitude of the terms of the nonaccelerated (black line) and of the accelerated (gray line) series versus the harmonic number n. The structure is a grounded dielectric slab in air, with relative permittivity ɛ r = 10.2, thickness h = 5 mm, frequency f = 3 GHz, spatial period p = 10 mm phase shift k x0 = π/(2p), at z = z′ (the interface between the grounded slab and the air). The three markers correspond to the truncation of the relevant series if relative errors 10−2, 10−3, and 10−4 are required.

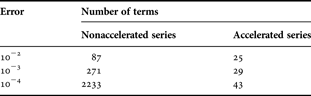
For an easier comparison, in Table 1 the number of terms is given for the above-mentioned values of the error in both the accelerated and nonaccelerated cases. The remarkable improvement by several orders of magnitude in the computational efficiency of the proposed accelerated implementation is manifest. This has an equivalent dramatic impact on the reduction of computation time required for evaluating the potential terms for a given accuracy.
Number of terms retained in G Azx.
V. RESULTS AND DISCUSSION
In this section, both scattering and dispersive analyses for periodic structures have been performed to validate the accuracy of the ‘transverse’ and of the “vertical” extractions, respectively. A complete MoM implementation of the accelerated Green's function potentials described in the previous section has been carried out, starting from the open-source distribution of the electromagnetic code EIGERTM [Reference Johnson12], solving two-dimensional and three-dimensional problems both in free space and in layered media. For periodic metallic objects embedded in the multilayered background medium, an electric-field integral equation (EFIE) is formulated; the contour of the two-dimensional body within the unit cell is discretized in segments and linear subdomain basis functions are used.
A) Scattering problems
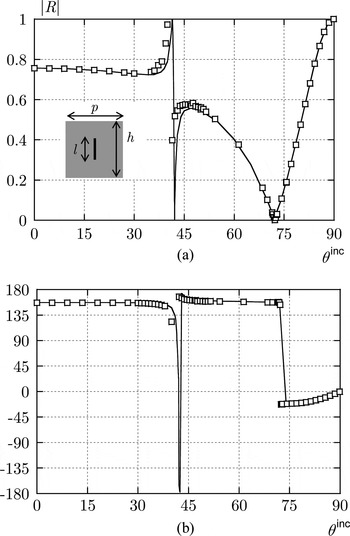
In this subsection a scattering problem is solved, and its solution is compared with the commercial software HFSSTM [13], based on the finite element method (FEM) in order to validate the described Green's function computation. A dielectric slab with an embedded array of vertical metallic strips is considered here. A TM z plane wave is impinging on the slab with incident angle θ inc. Figure 3 shows the relevant behavior of the reflection coefficient (Fig. 3(a) magnitude and Fig. 3(b) phase) as a function of θ inc for the Zeroth harmonic. Since the currents induced on the strips are purely vertical, a very good agreement with the independent results obtained through HFSS fully validates the correctness of our “vertical” extraction (3).
A periodic array of vertical metallic strips (length l = 10 mm) embedded in a dielectric slab (thickness h = 20 mm and relative permittivity ɛ r = 10·2), with spatial period p = 20 mm and operating frequency f = 4 GHz: reflection coefficient for the 0th harmonic of a TM z uniform plane wave versus the angle of incidence θ inc. Results from our code, solid line, and from HFSSTM, squares. (a) Magnitude and (b) phase (degrees) at the top air/dielectric interface.

B) Dispersive analyses
In this subsection, various examples of dispersive analyses performed with our numerical implementation are shown and validated with alternative methods. A first analysis is performed for a strip grating printed on a grounded dielectric slab.
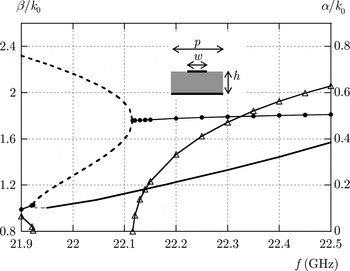
In Fig. 4, the involved modal behaviors of the phase constant β and the attenuation constant α are both shown for a TE z (i.e., TM y) mode, normalized with respect to the vacuum wavenumber k 0. It is seen that a complex improper mode splits into two improper real branches slightly above 21.9 GHz. One of these modes merges around 22.1 GHz with a second real improper mode, then giving rise to a complex improper mode (i.e., a forward leaky wave) with high attenuation. The other improper mode becomes proper around 21.95 GHz and becomes a guided surface wave of the structure.
A strip grating with period p = 0·338 cm, strip width w = 0·6p, on a grounded slab with thickness h = 0·14 cm and relative permittivity ɛ r = 20: modal dispersive behaviors. Phase constant β normalized with respect to the free-space wavenumber k 0: real proper mode (solid black line), improper complex mode (solid black line with dots), improper real modes (dashed black or gray lines). Attenuation constant α normalized with respect to k 0: improper complex modes (solid black lines with triangles). The analysis is limited here to TE z modes, with results in agreement with those in [14].

It should be noted that the knowledge of the values of the phase and attenuation constants is necessary to design and characterize the radiation pattern of leaky-wave antennas when the beam is scanned by varying the frequency [Reference Oliner, Jackson and Volakis7]. Usually, this information cannot be obtained easily with common commercial software, and an alternative full-wave code is then required for the correct design of such structures. The results shown in Fig. 4 are in full agreement with those obtained in [Reference Burghignoli, Baccarelli, Frezza, Galli, Lampariello and Oliner14] by means of a multi-mode equivalent network approach. This validates the “transverse” extractions presented in (2), in the cases both real and complex harmonics.
A validation of the “vertical” extractions in (3) involving computation of wavenumbers for real and complex waves can be performed if nonplanar cylindrical objects are embedded in the stratification, when TM z (i.e., TE y) polarized modes are investigated. This grants the presence of a vertical component of induced currents and vertical potentials are required in the EFIE formulation.
Dispersive analyses are performed here for two arrays of metallic cylinders having different circular cross sections. The cylinders are embedded in the middle of a grounded dielectric slab with relative permittivity ɛ r = 10.2 and thickness h = 20 mm; the spatial period of the structures is p = 20 mm. In this kind of structure, modal evolutions and coupling phenomena are strongly dependent on the shape and dimension of the embedded objects, as illustrated by the pair of examples chosen.
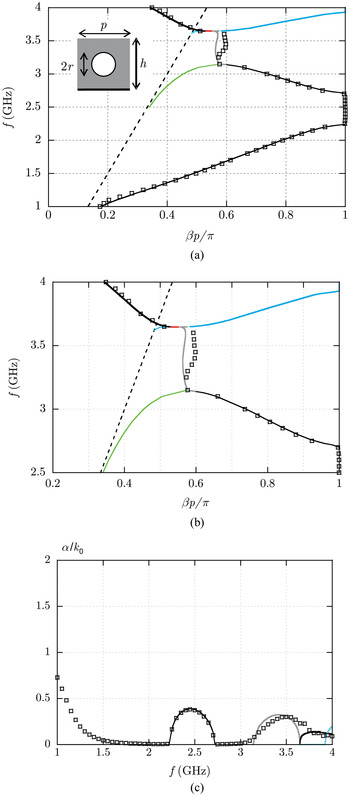
In the first array analysed, a circular cross section of the cylinders is chosen having radius r = 4 mm. The Brillouin diagram in Fig. 5(a) shows the phase constants of the zeroth harmonic of the TM z (TE y) modes that are investigated, with all the involved mode-coupling phenomena. The dashed line is the light line (β = k 0), shown here as a reference for the modes of the periodic structure. At low frequencies, a real forward proper mode is above cutoff, which reaches a closed stopband at around 2.2 GHz; at 2.7 GHz the mode leaves the stopband, again being real. (Above the stopband the −1 harmonic of the backward-propagating mode is shown within the fundamental Brillouin zone.) At 3.1 GHz this real mode (black thin line) merges with another real proper mode (green line) and a complex proper mode arises (gray line).
Dispersive analysis of TM z modes supported by a periodic array of circular cylinders with period p = 2 cm, radius r = 4 mm, embedded in the middle of a grounded slab with thickness h = 2 cm and relative permittivity ɛ r = 10·2. (a) Brillouin diagram (frequency versus normalized phase constant βp/π). Light line (dashed line), fundamental mode (thin black line), real mode (green line), complex mode (gray line), real modes (cyan and red lines). (b) Details of the Brillouin diagram. (c) Attenuation constant α normalized with respect to k 0. HFSS results are shown with small squares for comparison.

In Fig. 5(b) a detail of the high-frequency region of the Brillouin diagram is shown for the sake of clarity. At around 3.6 GHz, the complex mode (gray line) splits into a backward and a forward real proper mode, plotted with a red line and a cyan thick line, respectively. The forward real mode reaches a closed stopband at 3.9 GHz, thus becoming complex. The backward real mode merges with a new real mode (cyan thin line) and a complex proper mode arises. This mode becomes a physical leaky mode (leaking in the backward direction) when its n = −1 harmonic crosses the light line at 3.67 GHz.
In Fig. 5(c) the relevant attenuation constants of the modes are shown, confirming the presence of closed stopbands in the frequency range 2.2–2.7 GHz and above 3.9 GHz, as already discussed. The attenuation constant of the complex mode shown with the gray line corresponds to the frequency range 3.1–3.6 GHz mentioned above.
As a summary of the overall analysis in Fig. 5, it can be noted that the fundamental mode first goes through a stopband as the frequency increases and then couples with another real mode and becomes complex; this complex mode then splits into two real proper modes at 3.6 GHz; one of these real modes is a backward mode that merges with another real mode to become a backward leaky mode. The other real mode is a forward mode that encounters a stopband region at 3.9 GHz.
These analyses performed with the MoM are compared with independent results obtained through HFSS. A truncated structure has been simulated, made of 30 consecutive cells; since HFSS treats three-dimensional objects, perfect magnetic conductors are placed on two lateral walls at y = constant, thus simulating invariance along the y coordinate. Two waveguide ports are defined on the two boundaries x = 0 and 30p, and the relevant scattering parameters are simulated. A Bloch analysis [Reference Pozar15, Reference Valerio, Paulotto, Baccarelli, Burghignoli and Galli16] has then been performed, yielding an approximate dispersion curve of the fundamental mode of the periodic structure. Its phase and attenuation constants (in small squares) are shown in Figs 5(a) and 5(c); they show good agreement with the rigorous periodic approach, thus validating the previous analysis. As expected, the truncated-structure simulation does not accurately reproduce the mode-coupling details in the high-frequency region of the Brillouin diagram; these details are due to the mutual interaction among a large number of cells and can usually be recovered effectively only if the correct periodicity is taken into account with no approximations. The HFSS results also lose accuracy at low frequencies, near the cutoff of the real mode. Specifically, the attenuation constant is not exactly zero due to the approximate nature of the method; this gives rise to a growing normalized attenuation constant α/k 0 near the cutoff frequency of the mode at about 1 GHz.
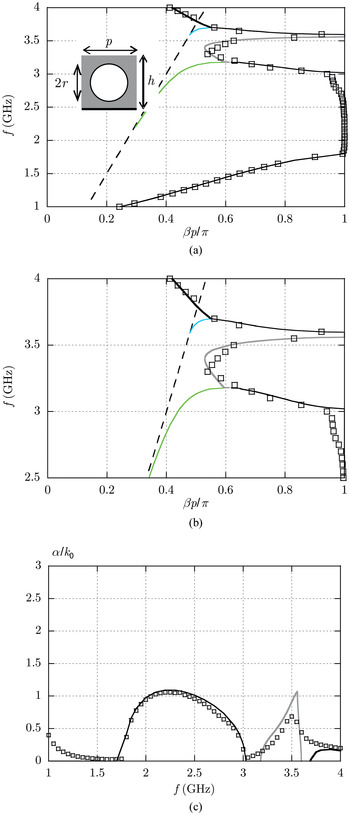
A second analysis is performed on a similar array of circular cylinders with a larger cross section: a radius r = 8 mm is chosen. As shown in the following results, this geometrical variation leads to different mode coupling phenomena at high frequencies. In Fig. 6(a) a Brillouin diagram shows the phase constants of the TM z (TE y) modes investigated. The low-frequency region of the diagram is similar to the previous case. A real forward proper mode is above cutoff, reaching a closed stopband at around 1.8 GHz, while at 3.0 GHz the mode leaves the stopband being real and backward. At 3.1 GHz the real mode (black thin line) merges with another real proper mode (green line) and a complex proper mode arises (gray line).
Dispersive analysis of TM z modes supported by a periodic array of circular cylinders with period p = 2 cm, radius r = 8 mm, embedded in the middle of a grounded slab with thickness h = 2 cm and relative permittivity ɛ r = 10·2. (a) Brillouin diagram (frequency versus normalized phase constant βp/π). Light line (dashed line), fundamental mode (thin black line), real mode (green line), complex mode (gray line), real modes (cyan line). (b) Details of the Brillouin diagram. (c) Attenuation constant α normalized with respect to k 0. HFSS results are shown with small squares for comparison.

In Fig. 6(b), a detail of the high-frequency couplings is again given for the sake of clarity. At 3.56 GHz, the complex mode reaches a closed stopband (as typical, its phase constant β then becomes exactly equal to p/π). The bandwidth of this stopband is relatively narrow (3.56–3.60 GHz). At 3.6 GHz the mode leaves the stopband and becomes real and backward, until it merges with a real forward mode that is just above cutoff (cyan line). A complex backward mode arises; its n = –1 harmonic becomes leaky as the light line is crossed.
In Fig. 6(c), the relevant attenuation constants are shown; in particular, a sudden change is evident in the behavior of the attenuation constant of the complex mode (in gray) before and after the lower edge of the second stopband (at 3.56 GHz).
In both Figs 6(a) and 6(c) the propagation constant of the fundamental mode, calculated with the periodic MoM, is compared with the results of a Bloch analysis performed with HFSS, as done for the previous periodic structure. A cascade of 19 cells has been simulated and the propagation wavenumber is extracted from the S parameters of this structure. A very good agreement is found for the propagation wavenumber, especially at low frequency. As expected, the various modal couplings are not exactly recovered with the approximate HFSS analysis due to the finite structure simulated; in particular, a smoother behavior of the attenuation constant is observed in the high-frequency region 3–4 GHz. Nevertheless, the agreement with the results of the rigorous periodic MoM is reasonably good, thus validating the full-wave analyses presented.
C) Further comments
After these successful comparisons, some further considerations on the efficiency of the methods can be drawn.
As concerns the scattering problem, the FEM commercial code HFSS can be set up with a Floquet periodic boundary condition and the analysis can be restricted to a single unit cell with no loss of rigor. It is difficult to rigorously compare efficiency between the two codes, due to the different approaches implemented and the use of different parameters to set the required accuracy. Nevertheless, it was observed that our MoM approach was able to obtain solutions in less than half the time required by the FEM software. A much slower convergence of the FEM approach was also noticed in ranges of incident angles near structural resonances (see, e.g., the peaks near 40° in Fig. 3).
Concerning dispersive problems, commercial codes usually do not allow for rigorous analyses involving complex and improper waves. The approximate method of simulation involving a truncated structure is the only approach usually available, but a large number of cells can be required to correctly model the interactions among cells, thus leading to a reduction in both efficiency and accuracy. On the other hand, the MoM code allows for the rigorous study of proper and improper waves, including waves that are not physical; it can be further expanded to take into account a phase shift along the y-axis, three-dimensional objects, or the presence of nonperiodic sources [Reference Capolino, Jackson, Wilton and Felsen17, Reference Valerio, Burghignoli, Baccarelli and Galli18].
Finally, it is noted that the extraction of quasi-static images as described automatically smooths (regularizes) the spectral Green's function series; the Ewald series may also be regularized simply by removing the potentials of the nearest source(s) [Reference Valerio, Baccarelli, Paulotto, Frezza and Galli19]. Both series may then be separately pre-computed and interpolated on demand using a simplex interpolation method [Reference Francavilla, Wilton, Paulotto and Jackson20], providing considerable additional speedup of the MoM approach.
VI. CONCLUSIONS
An original approach has been presented for the efficient and accurate analysis of typical classes of microwave problems involving arbitrary 2D periodic inclusions in stratified structures. Based on suitable asymptotic extractions, a significant acceleration of all the components of the mixed-potential multilayered Green's functions has been achieved, depending on the potential component analyzed. Homogeneous-medium extracted terms are summed with the Ewald method, modified in order to also treat the more difficult case of vertical current elements.
Full-wave numerical tests and results have been presented, implementing the proposed extraction algorithm in a version of the open-source electromagnetic code EIGERTM. Comparisons with independent results obtained through other techniques and through commercial software show both the precision and the major advantages of the presented formulation.
 Guido Valerio received the Ph.D. degree in applied electromagnetics in 2009, from Sapienza University of Rome. From February to August 2008 he was a Visiting Scholar at the University of Houston, TX. In 2011, he joined the Institut d'Electronique et de Télécommunications de Rennes (IETR), France, where he is currently a CNRS Researcher. His scientific interests involve numerical methods for wave propagation and scattering in complex structures, such as periodic and multilayered media; he studies computation and interpolation schemes for periodic Green's functions, modeling of interaction of nonperiodic sources with periodic media, modal properties of multilayered structures. In 2008 he was the recipient of the “Leopold B. Felsen Award for Excellence in Electrodynamics”. In 2009 he was a finalist for the “Young Engineering Prize” at the European Microwave Conference. In 2010 he was the recipient of the “Barzilai Prize” for the best paper at the Italian Congress of Electromagnetism (XVIII RiNEm).
 Alessandro Galli received the Laurea degree in electronic engineering and the Ph.D. in applied electromagnetics, both from “Sapienza” University of Rome, Italy. He joined the Department of Electronic Engineering of “Sapienza” for research and educational activities in 1990. In 2000 he became Assistant Professor and in 2002 Associate Professor at the same University. His scientific interests mainly concern topics of theoretical and numerical techniques for microwave passive devices, scanning and wide-band antennas and arrays, periodic structures, and metamaterials. He received the Barzilai Price in 1994 for the best scientific work of under-35 researchers at the 10th National Meeting of Electromagnetics. He was the recipient of the Quality Presentation Recognition Award by the IEEE Microwave Theory and Techniques (MTT) Society at the International Microwave Symposium in 1994 and in 1995. In 2010 he was elected as the Italian delegate on the Board of Directors of the European Microwave Association (EuMA).
 Donald R. Wilton received the Ph.D. degree from the University of Illinois, Urbana-Champaign, in 1970. From 1965 to 1968 he was with Hughes Aircraft Co., Fullerton, CA, engaged in the analysis and design of phased array antennas. From 1970 to 1983 he was with the Department of Electrical Engineering, University of Mississippi, and was a Visiting Professor at Syracuse University in 1978–1979. Since 1983 he has been a Professor in the Department of Electrical and Computer Engineering at the University of Houston. During 2004–2005 he was a Visiting Professor at the Polytechnic of Turin, Italy, Sandia National Laboratories, and the University of Washington. His primary area of research interest is computational electromagnetics, and he has published, lectured, and consulted extensively in this area. He is listed among highly cited authors in computer science at ISIHighlyCited.com. Dr. Wilton is a Fellow of the IEEE and received the IEEE Third Millenium Medal. He has served the IEEE Antennas and Propagation Society as an Associate Editor of the Transactions on Antennas and Propagation, as a Distinguished National Lecturer, and as a member of its Administrative Committee. Dr. Wilton is also a member of Commission B of the International Radio Science Union (URSI), in which he has held various offices, including Chair of US Commission B.
 David R. Jackson received his Ph.D. in 1985 in electrical engineering from UCLA. From 1985 to 1991 he was an Assistant Professor in the Department of Electrical and Computer Engineering at the University of Houston, Houston, TX. From 1991 to 1998 he was an Associate Professor in the same department, and since 1998 he has been a Professor in this department. His present research interests include microstrip antennas and circuits, leaky-wave antennas, leakage and radiation effects in microwave integrated circuits, periodic structures, and electromagnetic compatibility and interference. He is a Fellow of the IEEE and is presently serving as the chair of the Distinguished Lecturer Committee of the IEEE AP-S Society, and as the Secretary for USNC-URSI (the US National Committee of URSI).