Introduction
Immediately after fertilization of the oocyte, male and female pronuclei are formed and approximate one another in the central region of the zygote. After completion of the first DNA replication, first mitosis occurs. An important feature of the oocyte is that it lacks centriole-containing centrosomes, which serve as predefined spindle poles in somatic cells. Oocyte centrioles degenerate before meiotic maturation. In oocytes, there are many acentriolar microtubule organizing centres (MTOCs) throughout the cytoplasm instead of centrosomes (Schatten et al., Reference Schatten, Simerly and Schatten1985). In contrast with other mammalian species, sperm centrioles of rodents also degenerate during spermiogenesis. In this regard, the gradual shift from acentriolar spindle (MTOC-driven spindle) to centrosomal spindle formation is one of the most important transition features between meiosis and mitosis in rodents. Consequently, in the mouse embryo, the first mitotic bipolar spindle is formed in the absence of the centrioles (Manandhar et al., Reference Manandhar, Schatten and Sutovsky2005), which are produced de novo during the first three embryonic divisions when acentriolar MTOCs are replaced by true centrosomes. During meiotic resumption the MTOCs move towards nucleus and, after nuclear envelope breakdown, (NEBD) they gradually move toward the two poles and give rise to an acentriolar bipolar spindle (Schuh & Ellenberg, Reference Schuh and Ellenberg2007). Although 1-cell embryos form a mitotic spindle by the same mechanism as the oocyte, with centripetal targeting of cytoplasmic MTOCs, some features of the mechanism are distinct from those in meiosis (Courtois et al., Reference Courtois, Schuh, Ellenberg and Hiiragi2012). The first mitotic spindle is substantially shorter than the spindle formed in 2-cell embryos, and spindle poles in first mitosis fail to extend to the plasmalemma even at anaphase. The factors that restrain spindle length in oocytes to allow two meiotic asymmetric divisions might continue to restrain spindle length in the 1-cell embryo (for review, see Howe & FitzHarris, Reference Howe and FitzHarris2013). Kinetochore–microtubule attachment followed by segregation of chromosomes into individual blastomeres of 2-cell embryos is monitored by the spindle-assembly checkpoint (SAC) machinery (Musacchio & Salmon, Reference Musacchio and Salmon2007). The SAC is an active signal produced by improperly attached kinetochores. and prevents premature anaphase entry and is active until proper kinetochore–microtubule attachment occurs. Silencing of the SAC machinery is mediated by correct kinetochore connection to microtubules and stabilization of forces within the spindle. Thus chromosome alignment in metaphase plate is formed and metaphase–anaphase transition is allowed (Foley & Kapoor, Reference Foley and Kapoor2013). When components of the SAC regulatory mechanism have been satisfied, the anaphase-promoting complex/cyclosome (APC/C) becomes activated. APC/C activation mediates degradation of securin and cyclin B to trigger anaphase (Musacchio & Salmon, Reference Musacchio and Salmon2007). Previously it has been reported that Polo-like kinase 1 (PLK1) is involved in activatory phosphorylation of APC/C to facilitate metaphase–anaphase transition (Hansen et al., Reference Hansen, Loktev, Ban and Jackson2004; Moshe et al., Reference Moshe, Boulaire, Pagano and Hershko2004). In somatic cells PLK1 inhibition prevents SAC satisfaction and, as a consequence, the APC/C. In addition, Wei et al. (Reference Wei, Multi, Yang, Ma, Zhang, Wang, Li, Wei, Ge, Zhang, Ouyang, Hou, Shatten and Yuang2011) suggested that the SAC is essential for mitosis regulation at the early cleavage stage. Previous studies have shown that PLK1 is employed in the regulation of mouse (Tong et al., Reference Tong, Fan, Li, Chen, Schatten and Sun2002) and rat (Fan et al., Reference Fan, Tong, Teng, Lian, Li, Yang, Chen, Schatten and Sun2003) oocyte maturation, fertilization and early embryonic mitosis, during which time this kinase regulates G2–M transition (Zhang et al., Reference Zhang, Su, Feng, Yu, Cui, Xu and Yu2007). The important role of PLK1 in the first cleavage of the fertilized egg has been thus confirmed (Zhao et al., Reference Zhao, Ai, Zhang and Zhu2010). Our recent study showed that PLK1 activity is not essential for the entry of fertilized mouse oocytes into first mitosis, but that this kinase positively regulates the formation of the mitotic spindle and metaphase–anaphase transition in 1-cell embryos (Baran et al., Reference Baran, Solc, Kovarikova, Rehak and Sutovsky2013).
In the present study we describe quantitative confocal live embryo imaging that shows that PLK1 supports the onset of spindle formation, regulates spindle length, and is essential for correct chromosome alignment; also PLK1 is needed for APC/C activation, which results in securin destruction.
Materials and methods
Animal use ethical statement
The use of mice in this study was approved by the Departmental Expert Committee for State Veterinary and Food Administration of the Slovak Republic and with the Approval of Projects of Experiments on Animals of Academy of Sciences of Czech Republic. Animal welfare was under the control of local committees. Mice were housed in a temperature-controlled room with proper 12 h/12 h darkness–light cycles, and fed with a regular ad libitum diet.
Embryo in vitro culture
CD1 or H2B–EGFP female mice aged 6 to 8 weeks old were superovulated with 5 IU of pregnant mares' serum gonadotropin (PMSG), followed 46–47 h later by 5 IU of human chorionic gonadotropin (hCG), then mated with males. Fertilized 1-cell embryos were obtained from the ampulla oviduct of plug-positive females 18 h post hCG, and cumulus cells were dispersed with 1 mg/ml hyaluronidase. Embryos were isolated into M2 medium (Sigma-Aldrich, St. Louis, MO) and cultured in vitro in potassium simplex optimized medium (KSOM) (Millipore Co., Billerica, MA, USA) at 37°C in air containing 5% CO2 as we have described in more detail previously (Baran et al., Reference Baran, Solc, Kovarikova, Rehak and Sutovsky2013). After 2 h culture in pure KSOM (20 h post hCG administration), collected embryos were microinjected with mRNA and cultured in pure KSOM for the next 3 h. After this 3-h culture (at time interval 23 h post hCG), the surviving microinjected embryos were divided into two groups: (i) control; and (ii) PLK1-inhibited embryos; and then cultured in DMSO-supplemented KSOM or medium supplemented with BI2536 (Axon Medchem, Groningen, Germany) diluted in DMSO. In three repeated pilot tests of cleavage ability, three concentrations of BI2536 (50, 100 or 500 nM) were used. The cleavage ability of the embryos was evaluated under an inverted microscope (Nikon-Eclipse-90i; Nikon Instruments Europe B.V.) at time interval 43 h post hCG administration. The concentration of 500 nM was chosen based on our pilot studies and published data (Lenart et al., Reference Lenart, Petronczki, Steegmaier, Di Fiore, Lipp, Hoffmann, Rettig, Kraut and Peters2007; Steegmaier et al., Reference Steegmaier, Hoffmann, Baum, Lenart, Petronczki, Krssak, Gurtler, Garin-Chesa, Lieb, Quant, Grauert, Adolf, Kraut, Peters and Rettig2007). In the time-lapse experiments, a 500 nM concentration of BI2536 was applied.
mRNA in vitro transcription and microinjection
We used the described vectors for MAP4–EGFP (Schuh & Ellenberg, Reference Schuh and Ellenberg2007), securin–EGFP and H2B–mCHERRY (Kudo et al. Reference Kudo, Anger, Peters, Stemmann, Theussl, Helmhart, Kudo, Heyting and Nasmyth2009) for in vitro mRNA transcription as we have described previously (Solc et al., Reference Solc, Saskova, Baran, Kubelka, Schultz and Motlik2008). Fertilized 1-cell embryos were microinjected with 4 pl of 125 ng/μl MAP4–EGFP, 50 ng/μl of securin–EGFP and 75 ng/μl of H2B–mCHERRY mRNAs in M2 medium at 20 h post hCG.
Time-lapse confocal microscopy and image analysis
Time-lapse image acquisitions were performed using a Leica TCS SP5 confocal system equipped with an acoustooptical beam splitter (AOBS) applying the following settings: lens Plan Neofluor ×40 1.25 oil objective, 1024 × 1024 px resolution, 16-bit depth, 12 stacks with 7.4 μm thickness, time frame 5 min; 488 nm and 566 nm lasers at 3% power were used for EGFP and mCHERRY excitation. The EGFP signal was detected at 500–560 nm, the mCHERRY signal was detected at 580–630 nm.
3D + t image datasets of individual oocytes were registered using the H2B–mCHERRY signal by the Correct 3D Drift plug-in in Fiji (Schindelin et al. Reference Schindelin, Arganda-Carreras, Frise, Kaynig, Longair, Pietzsch, Preibisch, Rueden, Saalfeld, Schmid, Tinevez, White, Hartenstein, Eliceiri, Tomancak and Cardona2012). The time of NEBD (time of mitosis resumption) was defined as the time when chromosomes began to be condensed (denoted ‘0:00’ on Figs 2A and 3A and also Movies S1 and S2). Spindle volume was measured from 3D reconstructed images when the MAP4–EGFP raw data were processed by Gaussian Blur filter (r = 1) and then spindle structure was intensity-thresholded and individual Z-stacks of each embryo were arranged into single view.
Statistical analysis
Statistical analysis shown in Fig. 2 (see later) was performed using NCSS statistical software (NCSS, LLC, Utah, USA) by t-test. All experiments were repeated at least three times and the total numbers of observed embryos are indicated in the figure legends.
Results
Pharmacological inhibition of PLK1 by BI2536 prevents zygote cleavage
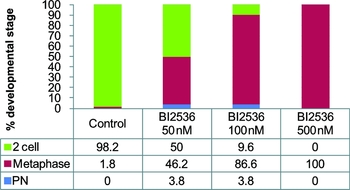
PLK1 inhibitor BI2536 was used to assess the involvement of PLK1 in the regulation of first mitosis of the fertilized embryo. To uncover a potential role for PLK1 during first embryonic mitosis we treated embryos with BI2536, a pharmacological inhibitor known to specifically inhibit PLK1 in somatic cells (Lenart et al., Reference Lenart, Petronczki, Steegmaier, Di Fiore, Lipp, Hoffmann, Rettig, Kraut and Peters2007) and in oocytes (Vanderheyden et al., Reference Vanderheyden, Wakai, Bultynck, De Smedt, Parys and Fissiore2009) as well as in chemical genetics studies (Scutt et al., Reference Scutt, Chu, Sloane, Cherry, Bignell, Williams and Eyers2009; Burkard et al., Reference Burkard, Randall, Larochelle, Zhang, Shokat, Fisher and Jallepalli2007). We tested differential concentrations of BI2536 and revealed that progression through the first mitosis was inhibited in a concentration-dependent manner (Fig. 1). In the control group, nearly all (98.2%) of the embryos completed first mitosis after a 19 h culture. Only a few control embryos (1.8%) were arrested in metaphase. However, treatment with increasing BI2536 concentrations (50, 100 or 500 nM) resulted in 46.2, 86.6 and 100% of embryos arrested permanently in metaphase.
Effect of BI2536 on the cleavage of the zygote. Effect of 50, 100 or 500 nM PLK1 inhibitor BI2536 on zygote division (n = 106, 104, 97). Control embryos were cultured in DMSO-supplemented medium (n = 113). Pronucleus (PN), metaphase and 2-cell stages were distinguished. PN, zygote with both pronuclei that did not enter into the first mitosis.

These data suggest that PLK1 is essential for completion of first embryonic mitosis and raises the questions how spindle formation dynamics and, mainly, securin destruction are affected by PLK1 inhibition.
PLK1 controls spindle formation onset as well as spindle length
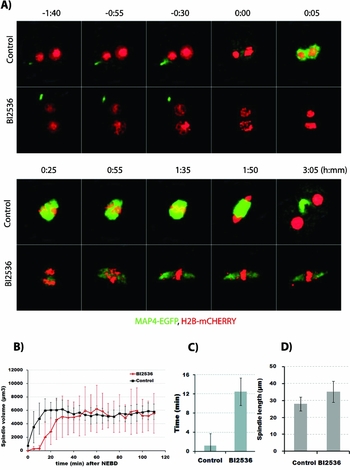
To precisely monitor the dynamics of spindle formation during the first mitosis, we expressed the well established spindle marker MAP4–EGFP together with chromosome marker H2B–mCHERRY from microinjected mRNAs and monitored spindle formation using confocal live cell imaging (Fig. 2A ). The incorporation of MAP4–EGFP into the spindle was clearly lower in BI2536 embryos, indicating that there was lower microtubule polymerization activity during mitosis. For quantitative analysis of spindle formation we defined the time when embryos went through nuclear envelope breakdown (NEBD) arbitrarily as time 0 (Fig. 2B ). Although embryos both in the control and BI2536 groups finally reached a comparable spindle volume, the onset of spindle formation was significantly delayed in BI2536-treated embryos (Fig. 2C ). In the control, embryo spindle formation began concomitantly or very shortly after NEBD (0.00–5.22 min, 95% confidence interval) but in BI2536 embryos it started significantly later (7.80–17.09 min, 95% confidence interval). Both control and BI2536 embryos formed bipolar spindles, but spindles in the BI2536-treated embryos were significantly longer (27.92 ± 3.75 μm in control versus 35.14 ± 9.78 μm in BI2536). After bipolar spindle establishment and correct chromosome alignment in metaphase, plate control embryos triggered anaphase and divided into 2-cell stage embryos. However, as we have shown previously (Baran et al. Reference Baran, Solc, Kovarikova, Rehak and Sutovsky2013), BI25266 embryos were unable to precisely align all chromosomes in the metaphase plate and permanently arrested at metaphase with one or a few chromosomes oscillating around the spindle poles of more elongated spindles (Fig. 2A ).
Spindle formation in PLK1-inhibited embryos. (A) Imaging of spindle formation during mitosis in live embryos expressing microtubule marker MAP4–EGFP and chromosome marker H2B–mCHERRY in the presence of DMSO (control) or BI2536. A snapshot of selected time points is shown. Time is relative to the NEBD (h:mm). EGFP and mCHERRY channels are presented as maximum intensity z-projections, and bright field as a single confocal section. See also Movie S1. (B) The volume of the spindle during mitosis progression was measured after 3D reconstruction of the MAP4–EGFP signals. Mean and standard deviation (s.d.) are shown (n = 11, 11). (C) Time of spindle formation onset was determined from individual spindle volume curves. Time after NEBD (min). Mean and s.d. are shown (n = 11, 11). (D) The length of the spindle at 100 min after NEBD was measured after 3D reconstruction of MAP4–EGFP signals. Mean and s.d. are shown (n = 11, 11).

In conclusion, these data suggest that although PLK1 is not absolutely essential for spindle formation, it affects the onset of spindle formation, regulates spindle elongation and is critical for correct chromosome alignment during first embryonic mitosis.
PLK1 is essential for APC/C activation and anaphase onset
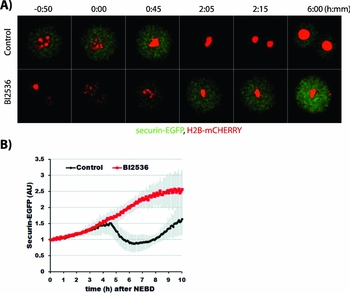
Because PLK1 inhibition results in strong metaphase arrest, we addressed the question whether or not APC/C is activated in PLK1-inhibited embryos. We monitored APC/C activity using the well established marker securin–EGFP (Herbert et al., Reference Herbert, Levasseur, Homer, Yallop, Murdoch and McDougall2003) expressed together with H2B–mCHERRY from microinjected mRNAs (Fig. 3A ). As expected, in the control embryos after successful alignment of all chromosomes to metaphase plate, securin–EGFP destruction (Fig. 3B ) was initiated and chromosome segregation occurred normally. Securin–EGFP re-accumulated in the control (BI2536-free) embryos after the first division. In BI2536-treated embryos, however, neither securin–EGFP destruction nor chromosome segregation was initiated. Chromosome alignment was never correct. Securin–EGFP levels accumulated constantly as a result of continuing translation from microinjected mRNA. These data prove that PLK1 activity is essential for APC/C activation, which results in destruction of the enzyme for anaphase onset.
APC/C activity in PLK1-inhibited embryos. (A) Imaging of live embryos expressing securin–EGFP and H2B–mCHERRY in the presence of DMSO (control) or BI2536. A snapshot of selected time points is shown. Time is relative to the NEBD (h:mm). Maximum intensity z-projection images are shown. See also Movie S2. (B) Intensities of securin–EGFP signals normalized to 1 at NEBD (t = 0). Mean and s.d. are shown. Time after NEBD (h).

Discussion
Here we present 4D analysis (3D + time) of spindle formation and securin degradation after pharmacological inhibition of PLK1 activity during the first mitotic cycle of mouse preimplantation embryos.
In somatic cycling cells, PLK1 activity is required for centrosome maturation (Meraldi & Nigg, Reference Meraldi and Nigg2002), bipolar spindle formation (Sumara et al., Reference Sumara, Gimenez-Abian, Gerlich, Hirota, Kraft, de la Torre, Ellenberg and Peters2004) and also for initiation of cytokinesis (Brennan et al., Reference Brennan, Peters, Kapoor and Straight2007; Santamaria et al. Reference Santamaria, Neef, Eberspacher, Eis, Husemann, Mumberg, Prechtl, Schulze, Siemeister, Wortmann, Barr and Nigg2007). Plk1-deficient somatic cells fail to form a bipolar mitotic spindle because they are unable to separate their centrosomes (Hanisch et al., Reference Hanisch, Wehner, Nigg and Sillje2006). PLK1 activity leading to phosphorylation of pericentrin facilitates the recruitment of γ-tubulin to centrosomal structures (Lee & Rhee, Reference Lee and Rhee2011) and results in the promotion of microtubule nucleation to establish a proper size of bipolar spindle.
Centrioles are completely degraded in mammalian oocytes and partially in spermatozoa, except in rodents, in which both spermatid centrioles are lost during spermiogenesis. Because rodent fertilized oocytes do not receive centrioles from the spermatozoon (Manandhar et al., Reference Manandhar, Schatten and Sutovsky2005), spindle assembly is fully controlled by oocyte-inherent microtubule-organizing centres (MTOCs) that are distributed randomly throughout the cytoplasm. In non-rodent species, sperm centrioles duplicate before resumption of first mitosis, followed by migration of duplicated centrosomes to opposite poles of apposed pronuclei (Schatten & Sun, Reference Schatten and Sun2009). Acentriolar mouse zygotes accomplish early embryonic cleavage using MTOCs until late preimplantation development (Courtois et al., Reference Courtois, Schuh, Ellenberg and Hiiragi2012). Thus, the shift from acentriolar to centrosomal spindle formation is the most remarkable feature of the transition from meiosis to mitosis. The MTOCs of mouse oocyte origin converge around the apposed pronuclei and migrate to the opposite poles during prometaphase.
In the PLK1-inhibited mouse zygote (Baran et al. Reference Baran, Solc, Kovarikova, Rehak and Sutovsky2013) and oocytes (Solc et al. Reference Solc, Kitajima, Yoshida, Brzakova, Kaido, Baran, Mayer, Samalova, Motlik and Ellenberg2015) targeting of γ-tubulin to MTOCs is disturbed, but a bipolar spindle is formed during first mitosis (Fig. 2A ) and similarly also in meiosis I. However, the onset of the spindle formation is delayed (Fig. 2B, C ) when PLK1 is inhibited. These results suggest that, in contrast with somatic cells, PLK1 activity is not required for spindle bipolarization in mouse zygote but it facilitates spindle formation at least partly by promoting γ-tubulin loading to MTOCs. Because formation of the bipolar spindle was also observed at even higher concentrations of BI2536 (1–2μM), it is possible to exclude the idea that the bipolar phenotype observed in BI2536-treated zygotes was due to partial inhibition of PLK1 activity (data not shown). Although bipolar but elongated spindles formed after BI2536 treatment, chromosome alignment was defective showing one or few chromosomes around the spindle poles at the time when control embryos already had chromosomes in the metaphase plate. These defects can be at least partly due to the recently discovered role of PLK1 in MCAK stability (Sanhaji et al., Reference Sanhaji, Ritter, Belsham, Friel, Roth, Louwen and Yuan2014).
We have shown recently that in mouse oocytes PLK1 is not absolutely essential for spindle bipolarization although bipolarization is delayed and a smaller spindle is formed when PLK1 is inhibited. Importantly, PLK1 promotes the recruitment of γ-tubulin and pericentrin to MTOCs and also PLK1 is essential for proper kinetochore–microtubule attachment in mouse oocytes (Solc et al., Reference Solc, Kitajima, Yoshida, Brzakova, Kaido, Baran, Mayer, Samalova, Motlik and Ellenberg2015).
In somatic cells, PLK1 inhibition leads to prometaphase/metaphase arrest accompanied by the absence of APC/C. This arrest can be reverted by concomitant SAC abrogation (Sumara et al., Reference Sumara, Gimenez-Abian, Gerlich, Hirota, Kraft, de la Torre, Ellenberg and Peters2004; van Vugt et al., Reference van Vugt, van de Weerdt, Vaderm, Janssen, Calafat, Klompmaker, Wolthuis and Medema2004). Here we have shown that PLK1 inhibition prevented APC/C activation and securin destruction (Fig. 3). In somatic cells it was shown that PLK phosphorylates and activates APC/C (Kotani et al., Reference Kotani, Tugendreich, Fuji, Jorgensen and Watanabe1998; Golan et al., Reference Golan, Yudkovsky and Hershko2002; Kraft et al., Reference Kraft, Herzog, Gieffers, Mechler and Hagting2003) although this PLK1 function is dispensable. (Lenart et al., Reference Lenart, Petronczki, Steegmaier, Di Fiore, Lipp, Hoffmann, Rettig, Kraut and Peters2007). We have shown previously that metaphase arrest caused by PLK1 inhibition cannot be rescued by concomitant SAC silencing by acute inhibition of MPS1, a critical SAC component (Baran et al., Reference Baran, Solc, Kovarikova, Rehak and Sutovsky2013). This result suggests that, in mouse zygotes, PLK1 is essential for APC/C activation and anaphase onset independently of SAC satisfaction.
A similar situation to that in the mouse zygote occurs in oocytes, in which PLK1 is required for full APC/C activation independently of SAC satisfaction. Metaphase I arrest in PLK1-inhibited oocytes cannot be reversed by SAC inhibition (Solc et al., Reference Solc, Kitajima, Yoshida, Brzakova, Kaido, Baran, Mayer, Samalova, Motlik and Ellenberg2015).
Taken together, our results in mouse zygotes show that PLK1 supports efficient spindle formation and it is required for chromosome alignment. PLK1 is also essential for full APC/C activation and anaphase onset in mouse zygotes. Thus the role of PLK1 in the zygote is more similar to the PLK1 function in oocytes than that in somatic cells.
Supplementary material
To view supplementary material for this article, please visit http://dx.doi.org/10.1017/S0967199415000246
Acknowledgements
This work was supported by the Slovak Research and Development Agency (APVV-0237–10). Work at the Institute of Animal Physiology and Genetics (IAPG) was supported by ExAM no. CZ.1.05/2.1.00/03.0124. PS and AB were also supported by grant no. LH12057.
Conflicts of interest
Authors declare that there is no conflict of interest that could be perceived as prejudicing the impartiality of the research reported.