Introduction
Vestibular schwannomas constitute 6 per cent of all intracranial tumours and 80 per cent of cerebellopontine angle tumours.Reference Lanser, Sussman and Frazer1 The incidence of vestibular schwannoma is around 13 cases per million per year in the UK.Reference Moffat, Hardy, Irving, Viani, Beynon and Baguley2 Lin et al.Reference Lin, Hegarty, Fischbein and Jackler3 reported the prevalence of incidental vestibular schwannomas to be roughly 2 in 10 000 people after assessing brain magnetic resonance imaging (MRI) scans of 46 414 patients without audiovestibular symptoms.
Treatment options for vestibular schwannoma include conservative management with interval scanning, and active intervention in the form of surgery or radiation. Several factors affect the choice of treatment option, including tumour size, patient age, presence of co-morbidities, hearing status, and patient and clinician preference. Both surgery and radiotherapy can lead to significant functional and psychological morbidity, and a small risk of mortality.Reference van Leeuwen, Braspenning, Meijer and Cremers4, Reference Wiegand and Fickel5 Conservative management with interval scanning is becoming increasingly popular.Reference Tan, Myrie, Lin, Niparko, Minor and Tamargo6, Reference Stangerup, Caye-Thomasen, Tos and Thomsen7 In a Danish study, only 10 per cent of patients with a vestibular schwannoma smaller than 15 mm underwent conservative management in 1975, compared with 90 per cent in 2004.Reference Stangerup, Caye-Thomasen, Tos and Thomsen7
A literature search did not reveal any studies evaluating the conservative management of tumours of diameter 15 mm or larger alone, i.e. separately from intra-canalicular or small extra-canalicular tumours. The Danish study mentioned above and some other published literature recommend active intervention for tumours of diameter 15 mm or more, unless patients are medically unfit or prefer conservative management.Reference Stangerup, Caye-Thomasen, Tos and Thomsen7–Reference Hajioff, Raut, Walsh, Bath, Bance and Guha9 Other studies report 20 mm as the cut-off point for active intervention in their respective management algorithms.Reference Martin10–Reference Suryanarayanan, Ramsden, Saeed, Aggarwal, King and Rutherford12 All of the studies into the conservative management of vestibular schwannoma included purely intra-canalicular tumours, along with small extra-canalicular tumours with a mean diameter of approximately 10 mm. Within these series, there were a few larger tumours; however, no separate analysis of the natural history of tumours larger than 15 mm was performed.
This study aimed to evaluate the radiological growth (i.e. change in size) of vestibular schwannomas with a maximum extra-canalicular diameter of 15–31 mm that were conservatively managed. We also investigated audiological and clinical outcomes in these patients.
Methods
A retrospective study was carried out on patients with vestibular schwannomas referred to a neuro-otologist (THJL) at the University Hospital Aintree (a tertiary care hospital). The study was approved by the Clinical Audit Department of the University Hospital Aintree.
Suitable patients were identified from the departmental database and from radiology reports of skull base clinic patients. The following inclusion criteria were used: (1) patients referred to our institute between March 1995 and November 2009; (2) vestibular schwannoma with a maximum extra-canalicular diameter of 15 mm or more in at least one plane measured by MRI; and (3) patients with at least two serial MRI scans performed with a minimum interval of six months, during which period they were conservatively managed with a ‘wait and re-scan’ policy. Exclusion criteria were: (1) neurofibromatosis type II, bilateral vestibular schwannoma or multiple intracranial tumours; and (2) previous surgery or radiation therapy.
Patient demographic data, clinical signs and symptoms, co-morbidities, and duration of follow up were recorded. Hearing thresholds were recorded, according to the Tokyo Guidelines, as the pure tone average of 0.5, 1, 2 and 4 kHz hearing thresholds on the involved side.Reference Kanzaki, Tos, Sanna, Moffat, Monsell and Berliner13 American Speech–Language–Hearing Association guidelines were used to classify hearing loss.Reference Clark14 Thus, hearing loss was noted as absent (−10 to 15 dB), slight (16–25 dB), mild (26–40 dB), moderate (41–55 dB), moderately severe (56–70 dB), severe (71–90 dB) or profound (greater than 90 dB). Hearing status and clinical features were recorded at each clinic visit. Clinical deterioration was defined as the worsening of pre-existing or development of new clinical signs and symptoms. A change in the hearing threshold of more than 5 dB was considered to represent worsening of hearing loss.
Images of MRI scans performed after July 2006 were available on the health trust's picture archiving and communication system. Older scans were available as hard copies from the radiology department archives. When the first scans performed in other hospitals were not available, the subsequent scan was considered the first scan. Tumour size was determined using the Tokyo Guidelines.Reference Kanzaki, Tos, Sanna, Moffat, Monsell and Berliner13 Gadolinium-enhanced T1-weighted (when available) or T1-weighted unenhanced MRI scans were reviewed to establish the linear planimetric measurements (in mm) of the extra-canalicular part of the vestibular schwannoma. Tumour dimensions in axial planes, both parallel and perpendicular to the petrous temporal bone, were measured. The largest extra-canalicular diameter was used to denote the tumour size. Measurements were made independently by two authors (CEER and HGLJ) for each interval scan. When there was a discrepancy, the mean of the two readings was accepted. Tumour growth or shrinkage was considered significant if there was an increase or decrease in tumour size by more than 2 mm compared with the initial MRI scan.Reference Stangerup, Caye-Thomasen, Tos and Thomsen7, Reference Fucci, Buchman, Brackmann and Berliner15
The annual growth rate was determined by first measuring the change in tumour size over the observation period, i.e. the size on the last scan minus the size on the initial scan. This figure was divided by the duration of follow up (between the date of the first scan and the date of the last scan) in months, and the result was multiplied by 12.
The clinical decision made at the patient's last follow-up visit regarding whether to continue conservative management or opt for intervention in the form of surgery or radiosurgery was considered the final outcome. Data from patients who were lost to follow up or died from other causes were also included in the intervention group for analysis.
Statistical analysis was performed using PASW Statistics version 18 software (SPSS Hong Kong, Quarry Bank, Hong Kong). The Student's t-test was used to compare differences in the means, and the Pearson's chi-square test was used to evaluate differences in proportions between growing and non-growing tumours. The Mann–Whitney U test was used for non-parametric data. A two-sided p value of <0.05 was considered significant. Data are presented as mean ± standard deviation.
Results
Patients
The study included 45 eligible patients with a mean age of 61.4 ± 10.7 years. The age range was 35–80 years, with patients aged over 60 years constituting 84.5 per cent of the study group. There were 28 (62.2 per cent) females and 17 (37.8 per cent) males, giving a female-to-male ratio of 1.6:1. The mean age of female patients was 62.6 ± 11.4 years and that of males was 59.5 ± 9.4 years.
Clinical features
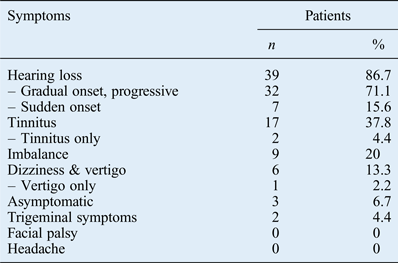
Twenty-three patients had right-sided tumours and 22 had left-sided tumours. The commonest clinical presentation was ipsilateral hearing loss (n = 39), followed by tinnitus (n = 17), imbalance (n = 9), dizziness or vertigo (n = 6), and tingling or numbness of the face (n = 2). See Table I for further details of clinical symptoms on presentation. There were three asymptomatic patients (6.7 per cent) in whom tumours were incidentally found on scans done for other reasons. The clinical sign recorded in the notes of five patients was the absence of a corneal reflex. Unilateral tinnitus alone was the presenting symptom in two patients and vertigo alone in one. A gradual onset of hearing loss was seen in the majority of patients (71.1 per cent), with sudden-onset hearing loss in seven (15.6 per cent). Medical co-morbidities were recorded in six patients (13.3 per cent). The duration of presenting clinical symptoms ranged from 1 month to 30 years, with a median of 24 months and an interquartile range of 9–60 months. Symptom duration was not recorded for two patients.
Presenting clinical symptoms
Worsening of pre-existing symptoms or the appearance of new symptoms during conservative management was seen in six patients (13.3 per cent). New symptoms reported were imbalance (n = 2); facial tingling with numbness or pain (n = 2); and headache, facial twitching or worsening of imbalance (n = 1 for each). Clinical deterioration was associated with tumour growth in 50 per cent of these patients (n = 3). None of the patients developed facial nerve weakness during the period of conservative management.
Follow-up duration
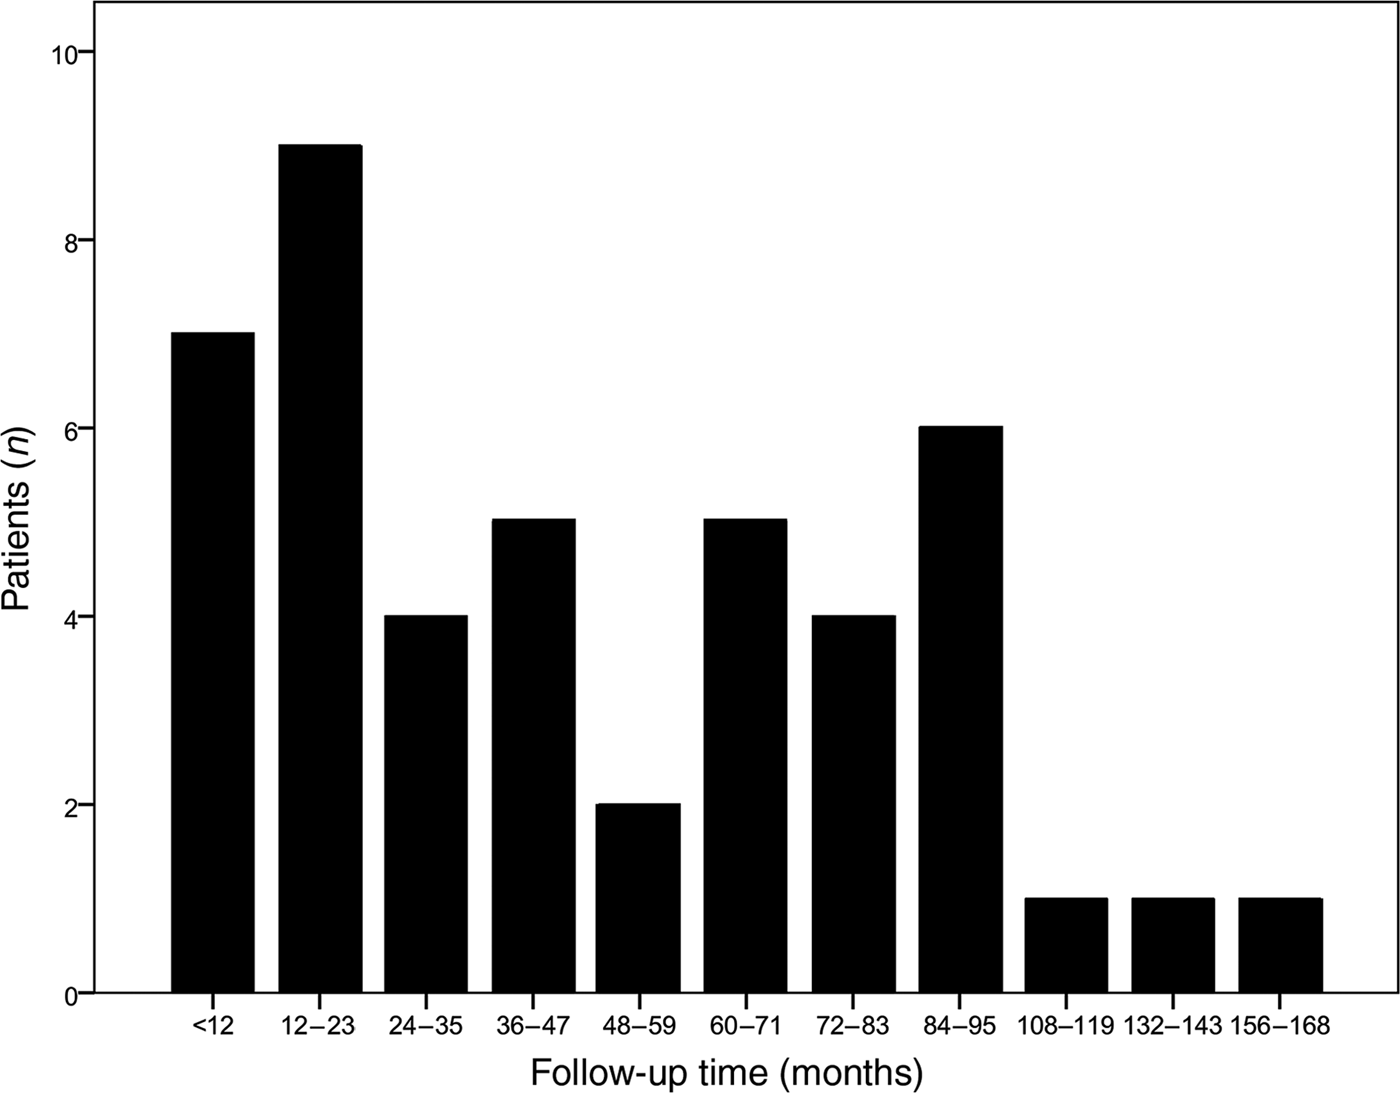
This ranged from 6 months to 14 years. The median follow-up duration was 36 months, with an interquartile range of 16–54 months. Figure 1 shows the distribution of follow-up duration in 12-month periods. Follow up was less than one year in 15.6 per cent (n = 7), more than one year but less than five years in 44.4 per cent (n = 20), and five years or more in 40 per cent (n = 18) of patients.
Duration of follow up in months for all patients included in the study.

Hearing status
The mean pure tone audiometry average of hearing thresholds at 0.5, 1, 2 and 4 kHz was 73.4 ± 35.5 dB at the start of conservative management and 80.9 ± 33.5 dB at the final test. Serviceable or useful (less than or equal to 50 dB) hearing was initially found in 13 patients (28.9 per cent), decreasing to 10 patients (22.2 per cent) on the final audiometry. Thus, 10 of the 13 patients had their hearing preserved to within a serviceable range, giving a hearing preservation rate of 76.9 per cent for conservative management. Moderately severe to profound hearing loss was found in 66.7 per cent (n = 30) of patients at the beginning of treatment. As a consequence of hearing deterioration in some patients (n = 4), 75.6 per cent of patients had moderately severe to profound hearing loss at the end of treatment. Hearing thresholds improved in 1 patient (2 per cent), were unchanged in 27 patients (60 per cent) and deteriorated in 17 patients (37.8 per cent). Changes in hearing levels (between the first and last audiometry) ranged from −8 to 72 dB. The median hearing level change was 0 dB, with an interquartile range of 0–14.5 dB. In patients for whom hearing level worsened (n = 17), this change ranged from 5 to 72 dB, with a median of 16 dB.
Tumour size
Tumour diameter ranged from 15 to 31 mm, with a mean of 20.1 ± 4.3 mm. There were 30 medium tumours (66.7 per cent), 14 moderately large tumours (31.1 per cent) and 1 large tumour (2.2 per cent).
Cystic tumours
There were 19 solid (42.2 per cent), 17 heterogeneous (37.8 per cent) and 9 cystic (20 per cent) vestibular schwannomas.
Growth
Tumour growth was observed in 11 patients (24.4 per cent; 95 per cent confidence interval (CI), 11.9–37.0 per cent), whereas no measurable tumour growth was identified in 30 patients (66.7 per cent; 95 per cent CI, 52.9–80.4 per cent), and tumour regression was seen in 4 patients (8.9 per cent; 95 per cent CI, 0.6–17.2 per cent). Overall, no tumour growth occurred in 34 patients; in other words, 75.6 per cent (95 per cent CI, 63.0–88.1 per cent) of the vestibular schwannomas had not progressed or increased in size.
The mean tumour growth over the period of conservative management for all tumours was 1.2 ± 3.6 mm. The change in tumour size ranged from −8 to 10 mm. Mean tumour growth was similar in both directions measured in the axial plane: 1.2 ± 3.6 mm along the plane parallel to the petrous temporal bone and 1.3 ± 3.5 mm in the plane perpendicular to this.
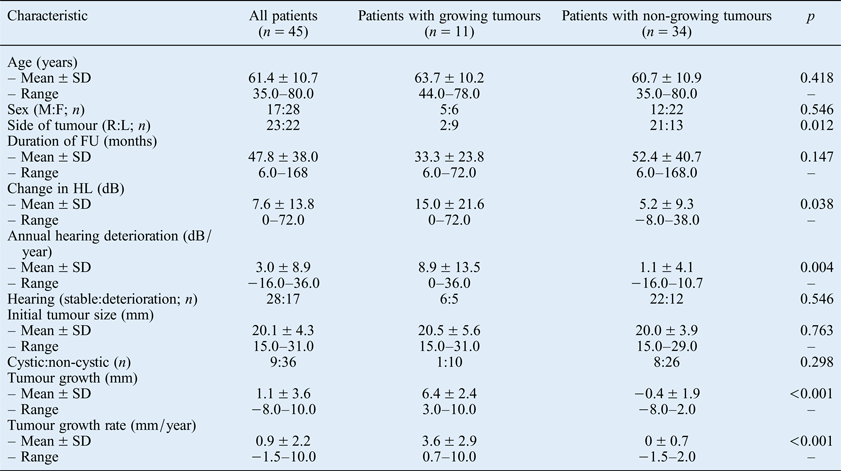
Patient demographics, hearing and radiological outcomes were analysed for differences between growing and non-growing tumours (summarised in Table II). Differences in patient age, male-to-female ratio, duration of follow up, ratio of stable to deteriorated hearing, and initial tumour size were not statistically significant between the two groups. There were more left-sided growing tumours (left-to-right ratio of 4.5:1). Consistent with this, there were more right-sided tumours in the non-growing tumour group (left-to-right ratio of 1:1.6); this difference was statistically significant (p = 0.01). The mean change in hearing thresholds and the annual hearing deterioration rate were 15 ± 21.6 dB and 8.9 ± 13.5 dB per year, respectively, in growing tumours, and 5.2 ± 9.3 dB and 1.1 ± 4.1 dB per year, respectively, in non-growing tumours. This difference was statistically significant, as were differences in total tumour growth and annual tumour growth rate. Tumour growth and tumour growth rate were 6.4 ± 2.4 mm and 3.6 ± 2.9 mm per year, respectively, in the growing tumour group, and −0.4 ± 1.9 mm and 0 ± 0.7 mm per year, respectively, in the non-growing tumour group. The mean overall tumour growth rate was 0.9 ± 2.2 mm per year, with a range of −1.5 to 10 mm per year.
Patient demographics and clinical characteristics
SD = standard deviation; M = males; F = females; R = right side; L = left side; FU = follow up; HL = hearing loss
Rapid tumour growth of 5 mm and 6 mm was seen within the first six months in two patients. Growth of 2–3 mm in the first six months, followed by a continued gradual increase, was seen in another two patients. In one patient, there was a 3 mm size increase in six months, followed by a period of no growth for two years, and growth of 4 mm in the following year. Hence, 5 out of 11 growing tumours (45.5 per cent) showed signs of growth in the first scan performed at 6 months. Five patients showed no growth on the first scan but growth on the 12–18-month scan. There was a rapid change in size by 3–10 mm in three patients and gradual growth of 2 mm per year in two patients. Hence, by 12–18 months, 10 of the 11 growing tumours (90.9 per cent) showed signs of growth. In 1 patient, the tumour was stable for 2.5 years, before growing at a rate of 1 mm per year over the next 4 years.
Final outcome
Nineteen patients (42.2 per cent) continued to be conservatively managed, and six (13.3 per cent) were discharged and re-referred for scanning in two to five years. All except one patient (n = 24) had non-growing tumours. The single patient who opted to continue conservative management had gradual tumour growth of 4 mm over six years. The overall non-intervention rate was 55.6 per cent for the conservatively managed patient group.
Three patients (6.7 per cent) were lost to follow up: all had non-growing tumours for durations of 27, 36 and 80 months. One patient who died from other causes had an initial tumour diameter of 31 mm and multiple co-morbidities. For this patient, the six-month scan showed no growth, but a year later the tumour had grown by 10 mm. These four patients and others who had intervention in the form of radiosurgery (n = 14), surgery (n = 1) and surgery followed by radiosurgery (n = 1), were grouped together into the intervention group (n = 20) to give an overall intervention rate of 44.4 per cent. The patient who died and the nine patients who had radiosurgery all had growing tumours. In the non-growing tumour group, the 4 patients who had radiosurgery and another who had surgery opted for these interventions after 6–14 months of follow up. Another patient who had radiosurgery had a 19 mm non-growing tumour for 7.5 years, but developed incapacitating imbalance and trigeminal nerve symptoms necessitating intervention. The patient who had surgery followed by radiosurgery undertook this treatment abroad after 12 months without tumour growth. No reason for initiating the treatment was recorded in the case notes. The intervention rate in the growing tumour group was 90.9 per cent, compared with 29.4 per cent in the non-growing tumour group.
Discussion
Age at presentation ranged between 35 and 80 years, with a mean of 61.4 ± 10.7 years. The mean age calculated in two meta-analyses was 62 years (range, 52–75 years) and 65 years, respectively.Reference Yamakami, Uchino, Kobayashi and Yamaura16, Reference Yoshimoto17 The mean or median ages reported in other large series were similar to that found in our study.Reference Stangerup, Caye-Thomasen, Tos and Thomsen7–Reference Hajioff, Raut, Walsh, Bath, Bance and Guha9, Reference Suryanarayanan, Ramsden, Saeed, Aggarwal, King and Rutherford12 There were more females (62.2 per cent) than males in our study; consistent with this, other studies included 56 per cent females.Reference Al Sanosi, Fagan and Biggs8, Reference Hajioff, Raut, Walsh, Bath, Bance and Guha9 In contrast, males constituted 54 per cent of cases in studies by Stangerup et al.Reference Stangerup, Caye-Thomasen, Tos and Thomsen7 and Suryanarayanan et al.Reference Suryanarayanan, Ramsden, Saeed, Aggarwal, King and Rutherford12
Presenting clinical signs and symptoms in this study were similar to those of other series.Reference Al Sanosi, Fagan and Biggs8, Reference Hajioff, Raut, Walsh, Bath, Bance and Guha9, Reference O'Reilly, Murray and Hadley18 Sudden sensorineural hearing loss was seen in 15.6 per cent of patients, and there were no symptoms in 6.7 per cent of patients. Similar figures were reported in other studies.Reference Hajioff, Raut, Walsh, Bath, Bance and Guha9, Reference Aslan, De Donato, Balyan, Falcioni, Russo and Taibah19, Reference Chaimoff, Nageris, Sulkes, Spitzer and Kalmanowitz20 Clinical worsening was documented in six patients (13.3 per cent); in three of these, it correlated with tumour growth. Al Sanosi et al.Reference Al Sanosi, Fagan and Biggs8 reported worsening imbalance associated with tumour growth in four patients (2 per cent) and without growth in three patients (1.5 per cent). No other studies reported changes in clinical findings other than hearing loss during conservative management. Medical co-morbidities were seen in 6 patients (13.3 per cent), compared with 50 per cent in patients aged 65 years or older.Reference Roehm and Gantz21 As this study is retrospective, it is acknowledged that co-morbidities may not have been documented in all cases.
Duration of follow up ranged from 6 months to 14 years, with a median follow up of 36 months (3 years). This is similar to the mean follow-up period of 3.2 years reported in systematic reviews by Smouha et al.Reference Smouha, Yoo, Mohr and Davis22 and Yoshimoto.Reference Yoshimoto17 In a systematic review of 41 studies conducted by Nikolopoulos et al.,Reference Nikolopoulos, Fortnum, O'Donoghue and Baguley23 1 study reported a mean follow up of 6.2 months, with the remaining 40 studies reporting a mean follow up of 17.4–65 months. The duration of follow up in our study was therefore sufficiently long to provide valuable information on the natural history of vestibular schwannomas.
Mean hearing thresholds in our study deteriorated from 73.4 to 80.9 dB, and useful hearing was lost in 3 out of 13 patients (23.1 per cent). This gave a hearing preservation rate of 76.9 per cent (10 out 13 patients). Initial thresholds of 73.4 dB were very high because of the high proportion of patients with profound (33.3 per cent), severe (17.8 per cent) and moderately severe (15.6 per cent) hearing loss. Yamakami et al.Reference Yamakami, Uchino, Kobayashi and Yamaura16 analysed hearing changes in 108 patients from 3 studies. These authors found that mean thresholds deteriorated from 44.5 to 58.4 dB, and that useful hearing was lost in 37 per cent of the 60 patients. Sughrue et al.Reference Sughrue, Yang, Aranda, Lobo, Pitts and Cheung24 performed a comprehensive review of hearing outcomes in 34 studies and reported an overall hearing preservation rate of 54 per cent. Ferri et al.,Reference Ferri, Modugno, Pirodda, Fioravanti, Calbucci and Ceroni11 however, reported that 73.2 per cent of patients (41 out of 56) maintained useful hearing levels.
In our study, changes in hearing levels and annual hearing deterioration rates were significantly higher in patients with growing tumours (15 dB and 8.9 dB per year) compared to those with non-growing tumours (5.2 dB and 1.1 dB per year). This finding is similar to that of Hajioff et al.,Reference Hajioff, Raut, Walsh, Bath, Bance and Guha9 who reported a significant increase in hearing deterioration in patients with extra-canalicular and growing tumours. Hearing improvement has also been noted in patients with growing tumours.Reference Martinez Del Pero, Lloyd and Moffat25 One patient in our study experienced an improvement in hearing by 8 dB; however, this patient had a non-growing tumour.
There were nine cystic tumours (20 per cent) in our study. One study into the conservative management of vestibular schwannoma reported that cystic tumours grow more rapidly than solid tumours.Reference Sakamoto, Fukuda and Inuyama26 It has been shown that larger vestibular schwannomas are associated with a higher chance of cystic degeneration.Reference Mehrotra, Behari, Pal, Banerji, Sahu and Jain27 Most surgeons prefer not to conservatively manage cystic tumours because of the fear of haemorrhage leading to a sudden increase in tumour size, with resultant brainstem compression.Reference Park, Jung, Kim, Son, Paek and Kim28–Reference Charabi, Thomsen, Mantoni, Charabi, Jørgensen and Børgesen30 We found that the ratio of cystic to non-cystic tumours was not significantly different between growing and non-growing tumour groups. There was no case of haemorrhage related to a rapid increase in cystic tumour size in our study. Surgical outcomes for cystic vestibular schwannoma are poorer than those for solid ones.Reference Charabi, Tos, Børgesen and Thomsen31, Reference Samii and Matthies32 Cystic tumours are known to respond poorly to radiotherapy because cystic areas lack adequate perfusion and oxygenation, which is essential for radiotherapy to work.Reference Bassim, Berliner, Fisher, Brackmann and Friedman33
Initial tumour diameters ranged from 15 mm to 31 mm, with a mean of 20.1 ± 4.3 mm. This was a unique characteristic of our study: all other studies on conservative management included purely intra-canalicular tumours (size, 0 mm) and tumours with a mean size of 10–12 mm.Reference Smouha, Yoo, Mohr and Davis22, Reference Nikolopoulos, Fortnum, O'Donoghue and Baguley23
Measurable tumour growth was seen in 11 patients (24.4 per cent), no tumour growth was observed in 30 patients (66.7 per cent) and tumour regression was seen in 4 patients (8.9 per cent). The overall mean tumour growth rate was 0.9 ± 2.2 mm per year and ranged from −1.5 to 10 mm per year. The mean growth rate for growing and non-growing tumours was 3.6 ± 2.9 and 0 ± 0.7 mm per year, respectively. In an analysis of 13 studies (including 903 patients), the mean tumour growth rate was 1.9 mm per year and 51 per cent of tumours grew.Reference Yamakami, Uchino, Kobayashi and Yamaura16 In 1244 patients from 19 studies, the average growth rate was 1.9 mm per year and 43 per cent of tumours grew.Reference Smouha, Yoo, Mohr and Davis22 In a more recent systematic review of 41 studies, the percentage of growing tumours ranged from 6 to 73 per cent, and the mean growth rate ranged from 0.3 to 4.8 mm per year.Reference Nikolopoulos, Fortnum, O'Donoghue and Baguley23 Hajioff et al.Reference Hajioff, Raut, Walsh, Bath, Bance and Guha9 reported very slow growth of less than 2 mm per year in 92 per cent of tumours, and 22 per cent of these (mainly intra-canalicular tumours) regressed. These authors reported a mean growth rate of 1 mm per year, which is similar to the rate observed in our study.
There were 9 left-sided tumours out of a total of 11 (81.8 per cent) in the growing tumour group, and 13 out of 34 (38.2 per cent) in the non-growing tumour group. This difference was statistically significant. A similar relationship between growth and left-sided tumours was reported in only one other study.Reference Beenstock34 There were no significant differences between growing and non-growing tumour patient groups in terms of age, sex ratio, initial tumour size or cystic nature. Although many studies have attempted to identify predictors of tumour growth, most failed to identify any correlation with assessed factors such as age, sex and tumour size.Reference Nikolopoulos, Fortnum, O'Donoghue and Baguley23
The pattern of tumour growth was non-linear. An important finding of our study is that 45.5 per cent of the growing tumours started growing within 6 months and a further 45.5 per cent started growing in the following 12 months. Hence, 10 out of 11 growing tumours (91 per cent) showed signs of growth within 12–18 months. The unpredictable nature of tumour growth is well known. There may be no growth for many years before the tumour starts to grow, although rapid growth can occur in the beginning.Reference Smouha, Yoo, Mohr and Davis22, Reference Nikolopoulos, Fortnum, O'Donoghue and Baguley23 Mick et al.Reference Mick, Westerberg, Ngo and Akagami35 continued to conservatively manage growing tumours and found that 63.9 per cent continued to grow, 30.6 per cent remained stable and 5.6 per cent regressed in size.
In this study, the overall intervention rate was 44.4 per cent. The main reasons for intervention were tumour growth (n = 10), patient choice (n = 5) and clinical worsening (n = 1). The need for intervention is considered by some as a failure of conservative management.Reference Hajioff, Raut, Walsh, Bath, Bance and Guha9, Reference Smouha, Yoo, Mohr and Davis22 One patient with a growing tumour opted to continue conservative management and 5 patients with non-growing tumours requested intervention within 6–14 months of follow up. Yamakami et al.Reference Yamakami, Uchino, Kobayashi and Yamaura16 reported that following initial conservative management, 20 per cent of patients required intervention; in 75 per cent of these, the reason for intervention was tumour growth. The higher intervention rate in our study can be related to the larger initial tumour size compared to other studies.
In the UK, there is a consensus that all patients with small tumours (purely intra-canalicular or extra-canalicular of less than 10 mm diameter) should be offered conservative management and encouraged to take up the offer.36 Hearing preservation intervention can be offered for these small tumours. There is no consensus about tumours larger than 10 mm, but there is a general view that tumours above 15 mm need treatment consideration.Reference Stangerup, Caye-Thomasen, Tos and Thomsen7, Reference Al Sanosi, Fagan and Biggs8 Most ENT departments in the UK offer intervention for tumours of 20 mm and larger in surgically fit patients.Reference Martin10, Reference Suryanarayanan, Ramsden, Saeed, Aggarwal, King and Rutherford12
The quality of life for a patient generally worsens after microsurgery and radiosurgery, but remains unchanged with conservative management.Reference Sandooram, Grunfeld, McKinney and Gleeson37 Facial nerve palsy is rarely reported in the absence of intervention.Reference Martin10 Another rationale for conservative management is the lack of growth or very slow growth in most vestibular schwannomas.Reference Smouha, Yoo, Mohr and Davis22, Reference Nikolopoulos, Fortnum, O'Donoghue and Baguley23 The outcome for those in whom conservative management failed was no different than for historical controls who had initially opted for active intervention.Reference Hajioff, Raut, Walsh, Bath, Bance and Guha9, Reference Raut, Walsh, Bath, Bance, Guha and Tator38 It has also been demonstrated that conservative management is more cost-effective than surgery or radiosurgery.Reference Verma, Anthony, Tsai, Taplin and Rutka39
• Forty-five patients with vestibular schwannomas (mean diameter 20.1 ± 4.3 mm) were conservatively managed for a median period of three years
• Only 24.4 per cent of medium and moderately large vestibular schwannomas grew
• Mean tumour growth was 1.2 mm per year
• These outcomes are similar to those reported for smaller vestibular schwannomas
A potential disadvantage of conservative management for larger tumours is that surgery or radiotherapy may become more challenging if the tumour grows. There may be a reduction in the rate of complete excision, and risks of complications are higher.Reference Godefroy, van der Mey, de Bruine, Hoekstra and Malessy40, Reference Mandl, Meijer, Slotman, Vandertop and Peerdeman41 The opportunity for safe radiosurgery may be lost if the tumour grows to 25 mm or larger.Reference Møller, Myrseth, Pedersen, Larsen, Krakenes and Moen42 Many tumours still present very late when they are large; hence, our argument is that even these large tumours can be managed judiciously by balancing complete excision for tumour control with subtotal excision to provide a better quality of life for patients.Reference Park, Jung, Kim, Son, Paek and Kim28
Conclusion
The outcomes for larger vestibular schwannomas (greater than or equal to 15 mm in diameter) were similar to those reported for smaller tumours, with only 24 per cent showing growth. This study shows that patients with medium and moderately large vestibular schwannomas can safely be offered an initial period of conservative management to enable the natural course of the tumour to be studied before considering intervention.
Acknowledgement
We sincerely thank Shonagh Nugent, Mr TJH Lesser's secretary, for helping us with data collection by retrieving the patient notes, letters and results.