


What are the consequences of political campaigns for mass participation? Despite extensive research on individual campaign tactics and cumulative campaign spending totaling billions of dollars, we do not yet understand the aggregate effects of an entire campaign on voter participation. In this paper, we take advantage of geographic discontinuities in campaigning and use new data on voters and campaigns to show that, in the aggregate, campaign efforts have large effects on voter turnout, causing the participation of millions of voters who would otherwise not have participated, and significantly altering the size and shape of the voting population.
A modern presidential campaign spends over one billion dollars to run hundreds of thousands of television advertisements and attempt hundreds of millions of individual voter contacts. But there is reason to believe this massive effort has negligible or small effects on voter participation. Television advertising appears to have no substantively significant effect on turnout (e.g., Krasno and Green Reference Krasno and Green2008). Isolated campaign efforts can increase voter participation, but the substantive size of these effects is usually small. Green, McGrath and Aronow (Reference Green, McGrath and Aronow2013) pool evidence from more than 200 get-out-the-vote (GOTV) experiments—published and unpublished—to show that, on average, door-to-door canvassing increases turnout by 1.0 percentage point, direct mail increases turnout by 0.7 percentage points, and phone calls increase turnout by 0.4 percentage points.Footnote 1 Previous research also suggests that individual variation in turnout is largely explained by non-campaign factors, such as individual utility (Riker and Ordeshook Reference Riker and Ordeshook1968), social pressure (Gerber, Green and Larimer Reference Gerber, Green and Larimer2008), resources (Verba, Schlozman and Brady Reference Verba, Schlozman and Brady1995), or personality (Gerber et al. Reference Gerber, Huber, Dowling, Doherty and Schwartzberg2011), suggesting that the effects of large campaigns should be minimal.
With this research in mind, one might conclude that campaigns have a negligible effect on aggregate voter turnout. However, the tactics of campaigns have recently changed, with modern campaigns increasingly using scientifically tested, individual-level targeting (Issenberg Reference Issenberg2013; Hersh Reference Hersh2015). In particular, the sheer scale of individual voter contact has increased dramatically over the past few presidential elections. These changes in tactics and resource allocation may have increased the ability of campaigns to mobilize voters.Footnote 2
The GOTV experiments cited above do little to inform us about the aggregate effects of a modern campaign using these new methods, where targeted voters are potentially contacted dozens of times. In nearly all of these studies, a single targeting intervention is compared with no intervention. Few experiments have assigned subjects to receive multiple interventions (e.g., Gerber and Green 2000; Cardy Reference Cardy2005; Ramirez Reference Ramirez2005; Michelson, Bedolla and Green Reference Michelson, Bedolla and Green2007), and none have come close to matching the level of a full-scale campaign. Given the current evidence, we have virtually no way of knowing what the effects of a large-scale campaign may be. At one extreme, the effects of many voter contacts could be counterproductive by fatiguing potential voters and turning them away. At the other extreme, the effects of many mobilization efforts could be synergistic and multiplicative. Somewhere in between, multiple interventions could have additive effects or the returns could be positive but diminishing. Simply put, despite extensive research on campaigning, we still know little about the aggregate effects of campaigns on political participation.
In this paper, we exploit the 2012 presidential campaign to assess the aggregate effects of a large-scale campaign on the size and composition of the voting population. We take advantage of variation in campaigning across state boundaries, validated turnout data for virtually every eligible voter in the United States, and perhaps most importantly, extensive information on campaign tactics including data from the Romney campaign on the number and type of voter contacts attempted in each state. Our results suggest that the aggregate mobilizing effect of a presidential campaign is quite large. We estimate that the 2012 campaign increased aggregate turnout by 7–8 percentage points in the most heavily targeted states, and this effect is greater than 10 percentage points for targeted subgroups. In total, our estimates imply that 2.6 million individuals voted who would have otherwise not participated in the absence of campaigning, suggesting that modern campaigns play a significant role in mass participation.
Having identified a large, aggregate effect, we then explore several potential explanations and mechanisms. First, we discuss and test for the possibility of biased estimates arising from differences between targeted and non-targeted states. Placebo tests show no differences between battleground and non-battleground residents residing in the same media market on demographic covariates or turnout in 2010. Furthermore, our results are unaffected by the inclusion or exclusion of individual-level covariates such as race and gender and state-level controls such as the coincidence of a senatorial or gubernatorial election and voting laws.
Second, we attempt to rule out the possibility that battleground voters are more motivated to vote even in the absence of campaigning. Placebo tests using survey data show no differences between battleground and non-battleground residents in terms of their pre-campaign levels of political interest or desire to vote. Our estimated effects of campaigning are larger for the kinds of citizens who were likely targeted, suggesting that statewide differences in voter motivation cannot explain our results. Previous experimental evidence suggests that considerations of pivotality have little effect on turnout. We also show that there was little difference in participation between battleground and non-battleground states for previous elections before 2008, when presumably, the individual incentive to vote associated with living in a battleground state was just as great.
Third, we examine the effects of television and internet advertising, and consistent with previous research, we find that these effects are small. On the whole, the evidence suggests that most of our estimated effect is explained by ground campaigning, that is, individual voter contact through door-to-door canvassing, phone calls, and direct mail. Furthermore, non-parametric analyses and back-of-the-envelope calculations suggest that there is little diminishing marginal return to ground campaigning. Our results are consistent with the possibility that individual voter contacts have small, positive effects, as identified in experiments, but many voter contacts add up to meaningful effects in large-scale campaigns.
Data
Our data on voters and participation comes from Catalist, a for-profit data vendor that maintains records of every eligible voter in the United States. For virtually every eligible voter in the United States, we know their gender, predicted race, predicted income range, state, media market, and validated voter turnout.Footnote 3 We analyze this data in conjunction with information that we obtained through interviews and private correspondence with numerous high-level operatives and strategists from the Obama and Romney campaigns. Through these interviews, we obtained specific information regarding the campaigns’ overall strategies, the extent of voter mobilization efforts, the places that were targeted, and the types of individuals that were targeted. Importantly, for the Romney campaign, we obtained data on the number and type of voter contacts attempted in each state, and for the Obama campaign, we obtained an internal prioritization of states.
Empirical Strategy: Comparisons Within Media Markets but Across State Boundaries
Our basic empirical strategy relies on the discontinuous changes in presidential campaigning across state boundaries. Because of the Electoral College, the returns to campaigning vary across states. For example, the presidential campaigns made virtually no effort to mobilize voters in Wyoming and Massachusetts, where Romney and Obama were essentially guaranteed to win, respectively, regardless of campaign effort. However, both teams campaigned heavily in Colorado and New Hampshire, where the outcome of the race was uncertain and these states could potentially tip the nationwide election result. In this sense, we follow previous studies that have exploited this variation across battleground and non-battleground territory in studying campaigns or voting behavior (e.g., Kim, Petrocik and Enokson Reference Kim, Petrocik and Enokson1975; Ashworth and Clinton Reference Ashworth and Clinton2007; Huber and Arceneaux Reference Huber and Arceneaux2007; Krasno and Green Reference Krasno and Green2008; Gerber et al. Reference Gerber, Huber, Doherty, Dowling, Raso and Ha2009).
Of course, battleground states differ from non-battleground states in many ways other than the extent of voter mobilization. Most notably, voters in battleground territory receive more television advertising and more intense news coverage of the election. In order to separate the effects of mass media and campaign activity, we take advantage of media markets that span state boundaries and conduct all of our comparisons within media market, so that we can be sure that the “treated” and “control” groups received the same level of television ads and news coverage. This has the added benefit of focusing our comparisons on relatively small geographic areas where, presumably, individuals are more similar than those living far apart in different metropolitan areas. In some specifications, we also condition on individual characteristics—gender, race, and predicted income—to improve precision and account for further differences between citizens in different states. In additional specifications, we control for whether there is a competitive Senate or gubernatorial election in a state, the particular election laws and voting methods in a state, and the level of internet-based advertising in each state. The results are nearly identical across each specification, indicating that individuals in battleground states are, on average, comparable with those in the same media market but in a non-battleground state. Our strategy may seem similar to those of Huber and Arceneaux (Reference Huber and Arceneaux2007) and Krasno and Green (Reference Krasno and Green2008) who compare residents of battleground and non-battleground media markets within the same non-battleground state to assess the impact of television advertising. However, our design is essentially the inverse; we compare residents of battleground and non-battleground states within the same media market, allowing us to hold media exposure constant.Footnote 4
This strategy provides unbiased estimates of the aggregate effects of campaigning under the assumptions that, on average, conditional on observable covariates, voters in the same media market in battleground and non-battleground states (1) have the same underlying propensity to vote, (2) receive the same boost in turnout from mass media, and (3) are subject to the same boost in turnout from forces other than campaigning such as psychological and social pressures not induced by the campaign. Assumption 1 is a priori plausible, because the factors determining which states are targeted are likely unrelated to the citizens’ underlying interest in voting. Assumption 2 is defensible because voters in the same media market see the same television, because we are able to control for internet advertising, and because few television ads contain state-specific content. We further justify all three assumptions by referencing previous research, conditioning on observable covariates, running placebo tests, and showing that our estimates vary in predictable ways.
Our design requires us to categorize the intensity of campaign activity across states, and we take three different approaches. Importantly, each of these approaches yields similar results, so our findings are not based on any particular measurement strategy. First, we code a binary variable, Battleground, indicating whether intense campaigning occurred in a particular state. This variable takes a value of 1 in Colorado, Florida, Iowa, Nevada, New Hampshire, North Carolina, Ohio, Virginia, and Wisconsin. These states received the vast majority of media attention, television ads, and campaign field offices (Sides and Vavreck Reference Sides and Vavreck2013). These were also the states identified by news organizations and political consultants as the key swing states.
For our second approach, we divide the states into four categories according to an internal categorization used by the Obama campaign.Footnote 5 The first tier, receiving the greatest degree of campaign effort, includes Colorado, Iowa, Nevada, New Hampshire, Ohio, and Virginia. The second tier, also receiving significant campaign effort but less than the first tier, includes Pennsylvania, Florida, and North Carolina. The third tier, receiving some campaigning but less than the first two tiers, includes Wisconsin, Minnesota, Washington, Oregon, Michigan, and New Mexico. The remaining states in none of the three tiers received virtually no attention.
For our third approach, we utilize data on the number of voter contacts attempted by the Romney campaign in each state. Specifically, we obtained an internal document from the campaign summarizing the number of attempted phone calls, direct mail deliveries, and door-to-door canvassing efforts in each state.Footnote 6 Using these numbers, we construct a continuous scale indicating the average effort level of the Romney campaign in each state. However, not all types of contacts indicate equal effort. In determining the relative weights that we should give to each type of voter contact, we relied upon estimates of the cost of each mobilization method. Green and Gerber (Reference Green and Gerber2008) estimate that the cost of phone calls, direct mail, and door knocks are approximately 30 cents, 75 cents, and 3 dollars, respectively, per attempt. These estimates allow us to approximate the amount of effort per state in terms of the hypothetical cost of those campaign efforts per eligible voter. In total, 28 states plus Washington, DC received no effort whatsoever, while many other states received significant effort. Nevada received the highest level of effort with approximately five phone calls, 0.7 pieces of direct mail, and 0.5 door knocks attempted for every eligible voter in the state, amounting to an imputed cost of $3.40/person. New Hampshire, Virginia, Iowa, Ohio, and Colorado were next, with costs exceeding $2/person. We rescale this variable to range from 0 to 1 and call it RomneyEffort. Comparing the emphasis put on different states by the Romney campaign with the internal categorization used by the Obama campaign, the campaigns appear to have prioritized the states in roughly the same way.Footnote 7 The state-level data from the Romney campaign, which we believe represents a significant improvement over previous attempts to measure campaign activity, is presented in the Appendix.
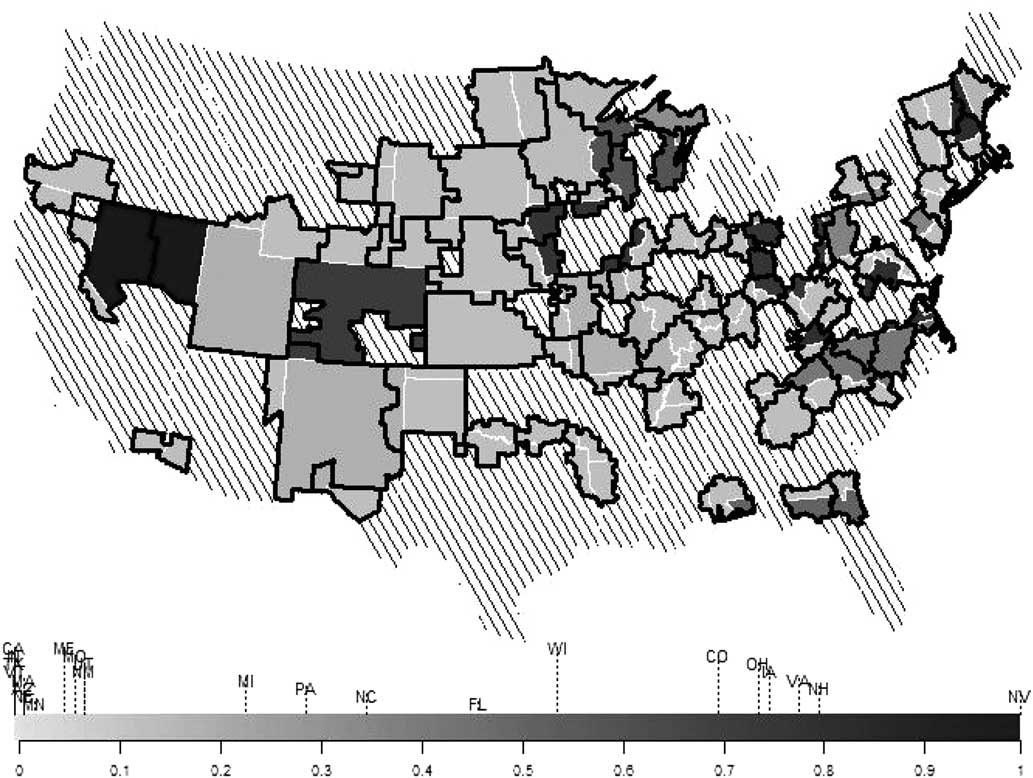
Figure 1 presents a map of RomneyEffort across states and media markets. Media markets spanning states with different levels of RomneyEffort are surrounded by thick black lines. Portions of each media market are shaded by the level of RomneyEffort in that state. So, for example, the Reno media market is much darker in Nevada than California, representing the variation in RomneyEffort across those states. States with no effort or only minimal effort are the lightest shade. The media markets that do not span state lines with varying levels of RomneyEffort are indicated by diagonal lines. The voters in these areas do not enter our sample. This map highlights the sample of voters and sources of variation that we utilize in the regressions below to estimate the effects of campaigning. In the Appendix, we show similar figures for our other variables measuring campaign activity.
RomneyEffort by state and media market Note: Media markets spanning states with different levels of RomneyEffort are surrounded by thick black lines. Portions of each media market are shaded by the level of RomneyEffort in that state. The media markets that do not span states with varying RomneyEffort (not included in our analysis) are indicated by diagonal lines. The states are also aligned horizontally along the bottom of the figure by the level of RomneyEffort (vertical alignments are varied for visual ease).
We specify three approaches to estimating the average effect of campaigning on voter turnout, using each of the measures of campaign effort described above. Employing ordinary least squares, we estimate the following three regressions:
 $$Turnout_{{ijk}} {\rm \,{\equals}}\,\beta _{{\rm 0}} \,Battleground_{j} {\rm {\plus}}\gamma _{k} {\rm {\plus}}\delta X_{i} {\rm {\plus}}{\varepsilon}_{{ijk}} {\rm .}$$
 $$Turnout_{{ijk}} \,{\rm {\equals}}\,\beta _{{\rm 1}} Tier{\rm 1}_{j} {\rm {\plus}}\beta _{{\rm 2}} Tier{\rm 2}_{j} {\rm {\plus}}\beta _{{\rm 3}} Tier{\rm 3}_{j} {\rm {\plus}}\gamma _{k} {\rm {\plus}}\delta X_{i} {\rm {\plus}}{\varepsilon}_{{ijk}} {\rm .}$$
 $$Turnout_{{ijk}} \,{\rm {\equals}}\,\beta _{{\rm 4}} RomneyEffort_{j} {\rm {\plus}}\gamma _{k} {\rm {\plus}}\delta X_{i} {\rm {\plus}}{\varepsilon}_{{ijk}} {\rm .}$$
Turnout ijk is an indicator for voter turnout for individual i in state j and in media market k. As described previously, Battleground j , Tier1 j , Tier2 j , and Tier3 j are binary variables indicating whether state j falls into that particular category of campaign effort, and RomneyEffort j is a continuous variable ranging from 0 to 1 indicating the extent of voter mobilization effort by the Romney campaign in state j. γ k represents media market fixed effects, which account for the fact that individuals in different media markets received different levels of news coverage and television advertising. These fixed effects allow all of our inferences to be made within media markets but across state boundaries. X i represents a vector of individual characteristics—race, income, and gender—that we include to account for the potential that even within media markets, there may be some systematic demographic differences across state boundaries.
β 0 in Equation 1 represents the average difference in turnout between battleground individuals and demographically similar non-battleground voters within the same media market. Under our assumptions, this quantity represents the average effect of the campaigns’ mobilization efforts for all citizens in battleground states.Footnote 8 Similarly, β 1, β 2, and β 3 from Equation 2 represent the average effect of being in the first, second, or third tier of campaign effort, respectively, relative to receiving virtually no campaign effort. β 4 from Equation 3 represents the average effect of going from a state with virtually no mobilization effort to the state with the greatest voter mobilization effort. To be clear, all three specifications are intended to measure the aggregate effects of all GOTV campaigning by Obama, Romney, and independent groups. While we use information on mobilization efforts from the Obama and Romney campaigns in separate regressions, both campaigns prioritized states in virtually the same way, so all regressions inform us about the average effects of all campaigning. These differences between different regression results tell us nothing about the relative effectiveness of Obama and Romney. Later, we separately examine different subgroups of individuals in order to compare the effectiveness of the two campaigns. Similarly, to the extent that outside groups and super PACs raised turnout in battleground states, those effects are part of our estimates. However, the scale of campaigning by outside groups was small compared with that conducted by the presidential campaigns.
Placebo Tests
Before proceeding to the results, we discuss placebo tests designed to assess the validity of our assumptions and empirical design. In each case, we implement our designs described above using different placebo outcomes. One potential concern is that battleground residents differ from non-battleground residents in their underlying propensity to vote. To address these concerns, we conduct placebo tests using voter turnout in 2010 and demographic covariates (results shown in the Appendix).Footnote 9 We find minimal differences between battleground and non-battleground voters on these dimensions, suggesting that battleground voters are comparable with non-battleground voters in their underlying levels of participation and political interest.
Another concern is that battleground voters are more motivated to participate for reasons unrelated to campaigning, perhaps because perceive their vote to be more pivotal. We discuss this issue and present additional evidence later in the paper, but for now, we can partially address this concern by conducting placebo tests using survey data from the Cooperative Campaign Analysis Project in the first 16 weeks of 2012, before the general campaign began. Specifically, we use survey measures of political interest and intention to vote as placebo outcomes, and we find that battleground voters are no more likely to report that they are interested in politics or that they plan on voting before the campaign began, suggesting that residence in a battleground state and considerations of pivotally have little direct effect on participation independent of campaigning. These placebo tests, discussed and presented in more detail in the Appendix, help to validate our design and suggest that our subsequent results can be attributed to campaigning as opposed to spurious factors and independent effects of battleground environments.
Aggregate Campaign Effects in 2012
Table 1 presents our main results using 2012 turnout as the dependent variable. These results measure the aggregate effect of all campaigning in 2012. Columns 1–3 show results for Equation 1, using battleground states as the key independent variable, Columns 4–6 show results for Equation 2, using state tiers as the key independent variable, and Columns 7–9 show results for Equation 3, using RomneyEffort as the key independent variable. Columns 1, 4, and 7 include no controls other than media market fixed effects. Columns 2, 5, and 8 also include individual controls for gender, race, and income. Columns 3, 6, and 9 include an additional control for turnout in 2010. The inclusion of control variables has virtually no impact on our estimates, because these covariates are well balanced across state lines. These results are also unchanged if we include a control variable indicating which states had a competitive gubernatorial or senatorial race in 2012.Footnote 10 Additional regressions controlling for different election laws and voting methods across states also produce nearly identical results.Footnote 11 The sample sizes vary across the three different estimation strategies because we only include media markets for which there is variation in the treatment variable. The regressions associated with Equation 1 (Columns 1–3) only include media markets that span both a battleground and non-battleground state. This includes ~50 million individuals living in 38 media markets spanning 34 states. For Equation 2, we include all individuals living in media markets which span states in different tiers (88 million individuals in 49 media markets spanning 44 states). For Equation 3, we include all individuals living in media markets which span states receiving different levels of effort from the Romney campaign (119 million individuals in 74 media markets spanning 48 states—Washington, DC is included as a state).
Average Effects of Ground Campaigning on 2012 Voter Turnout
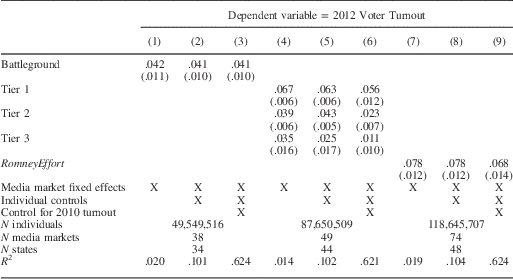
Note: Battleground is an indicator variable for battleground territory where the campaigns made significant efforts to mobilize voters. Tier 1, Tier 2, and Tier 3 are indicator variables for the three categories of states that received different levels of campaign priority from the Obama campaign. RomneyEffort is a continuous variable ranging from 0 to 1 indicating the level of mobilization efforts employed by the Romney campaign in each state. Specifications with individual controls include dummies for gender, race, and predicted income category. The first three regressions include all individuals living in media markets that span both battleground and non-battleground territory. The next three regressions include all individuals living in media markets that span territories at different tiers. The final three regressions include all individuals living in media markets that span territories receiving differential mobilization effort from the Romney campaign. Standard errors, clustered by state, are in parentheses.
Conditional on the media market and other factors, voters in battleground states were 4 percentage points more likely to turn out, suggesting that ground campaigning increased participation in battleground states by 4 percentage points, on average. Comparing the top tier of campaign priority to non-targeted states, we see that turnout was 6–7 percentage points higher in the more targeted regions. This difference is 2–4 percentage points for the second tier of states and 1–4 percentage points for the third tier. As expected, for each specification, the estimated effect of Tier 1 residence is greater than the estimated effect of Tier 2 residence, which is greater than the estimated effect of Tier 3 residence, which is greater than 0. Similarly, in the last three columns, going from states with no campaign effort to those with maximal campaign effort corresponds to a 7–8 percentage point increase in turnout. With the exception of the Tier 3 estimates, all point estimates are substantively meaningful and statistically significant (p<.01 with standard errors clustered by state). Our aggregate results are consistent with large, powerful mobilizing effects of the presidential campaigns that increase with the extent to which a state was targeted. Voter mobilization appears to have significantly increased turnout in the most targeted states.
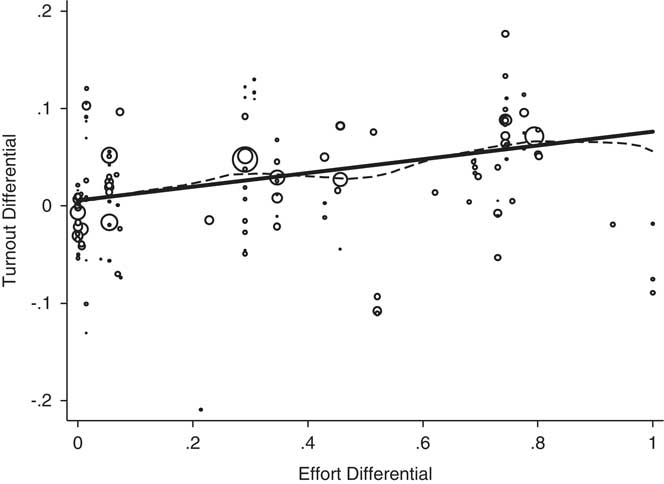
Figure 2 offers an approximate visualization of the effects of campaigning, based on the regression result in Column 7 of Table 1. Each data point represents a pair of states that share a media market. For example, the intersection of Massachusetts and New Hampshire in the Boston media market represents one data point in the figure. The difference in voter turnout between the two regions is plotted on the vertical axis, with higher values indicating higher turnout among the region that received more campaign contact. The difference in campaign effort between these two regions, as indicated by the RomneyEffort variable, is plotted on the horizontal axis. Consistent with the regression result, we see that, on average, the turnout differential increases significantly as the campaign effort differential increases. The solid line represents a linear fit, and the dashed curve represents a non-parametric kernel regression. In both cases, each observation is weighted by the population of the smaller region (represented visually by the size of the circle). This weighting approach appropriately mitigates the influence of the data points with very few observations. The slope of the line, .071, is nearly identical to the regression results in Columns 7–9 of Table 1. Moreover, the relationship between the effort differentials and the turnout differentials are approximately linear, suggesting that the marginal returns to additional campaigning do not diminish over the range of contacts made by the campaigns. If these effects did diminish, then we would see the turnout differentials level-off at a certain point. However, the effects of campaigning appear to increase linearly in proportion to its intensity, helping to explain the large cumulative effects that we detect.
Average effects of voter mobilization in 2012 Note: Each circle represents the intersection of two states within a single media market. The size of each circle is proportional to the population of the smaller region. The vertical axis plots the difference in 2012 turnout between the two regions (with higher values representing higher turnout in the more heavily targeted state) and the horizontal axis plots the difference in campaign effort (as measured by the RomneyEffort variable) between the two states. The solid line represents a linear fit and the dashed curve represents a kernel regression. In both cases, each observation is weighted by population.
Large-scale campaigns using modern GOTV tactics appear to significantly increase electoral participation. Our results suggest that voter turnout would have been 7–8 percentage points lower in heavily targeted states like Nevada, New Hampshire, and Ohio had the presidential campaigns and interest groups not deployed their mobilizing activities. Even though a single campaign contact typically has a negligible effect on overall rates of participation, the widespread deployment of many such interventions appears to add up to a significant change in participation. The regression results in Table 1 allow us to approximate the total mobilizing effect of the campaign in 2012. If we multiply the coefficient in Column 7 by the level of RomneyEffort in a state and the voting-eligible population (VEP) in a state, we obtain an approximation of the number of people mobilized. Repeating this for every state and computing the sum, we estimate that ~2.6 million individuals turned out to vote in 2012 who would have otherwise abstained in the absence of campaigning.
Variation Across Individual Partisanship
Our data allows us to explore the extent to which our aggregate estimates of campaign effects vary across different kinds of voters. Specifically, because partisan campaigns explicitly target partisans who are likely to support their candidate if they vote, we would expect to obtain greater effects among partisans—or those predicted to be partisans based on their observable covariates—than among moderates. Our interviews with operatives in both campaigns confirmed that targeting partisans was, in fact, their strategy. The most targeted individuals were strong partisans or those who look that way to the campaign based on their public records and demographics. For example, the Obama campaign generated an “Obama Support Score” using demographic and consumer data (similar to our data) in addition to their own contacts and focused their GOTV efforts on individuals with high scores (Nickerson and Rogers Reference Nickerson and Rogers2014).
We do not know precisely which citizens were targeted by the presidential campaigns. And even if we knew which individuals in battleground states were contacted, we would not know which individuals in non-battleground states would have been contacted had they lived in a battleground states. Therefore, we generate our own measure of predicted partisanship. Because vote choices are not public, the only direct indication of partisan attitudes is party registration, which is only available in some states. Moreover, we do not want to use party registration directly in our analysis, because campaigns work to register supporters in targeted states, making party registrants no longer comparable across state boundaries. And, of course, party registration is not present in all states. Therefore, we predict party registration using race, gender, and income, using data from the non-battleground states where party registration is present. We code a party registration variable which takes a value of 1 for registered Democrats, 0 for registered Republicans, and .5 for all other individuals. Then, we calculate the average level of this variable for every possible combination of race, gender, and income in non-battleground states with party registration. This score represents our predicted levels of partisan support (with higher values indicating more Democratic and less Republican support), which we impute for the entire sample. The variable ranges from .09 to .84, with a mean of .51 and a SD of .13.
In order to assess the variation in our estimated effects across partisanship, we divide our predicted partisanship variable into six categories and re-estimate the regression from Column 7 of Table 1 for each category. These estimates represent the effect of campaigning on turnout for voters at different levels of partisanship. Figure 3 presents the point estimates and 95 percent confidence intervals. As expected, we see large estimates of mobilization for those voters predicted to be strongly partisan, and we obtain smaller estimates for less partisan subgroups. Our estimated effects of campaign mobilization are 11.3 and 10.8 percentage points for our most Republican and Democratic subgroups, respectively, the left- and right-most categories in Figure 3, while our estimates of mobilization are only 5.6 and 6.9 percentage points for the two least-partisan categories in the middle of Figure 3. We see the largest effects of campaigning among the most heavily targeted subgroups. This finding provides additional credibility to our results and partially informs the mechanisms behind the aggregate effects of campaigning, which we discuss later in the paper.
Variation of campaign effects across predicted partisanship Note: The figure plots the results for six different regressions, replicating the analysis from Column 7 in Table 1 for different subsets of individuals with different levels of predicted partisanship. Going from left to right, we analyze the 10 percent of individuals with the lowest levels of predicted partisanship (most Republican), then the 10–25th percentiles, 25–50th percentiles, 50–75th percentiles, 75–90th percentiles, and the top 10 percent (most Democratic). The solid line represents the coefficients and the dotted lines indicate 95 percent confidence intervals (generated from state-clustered standard errors).
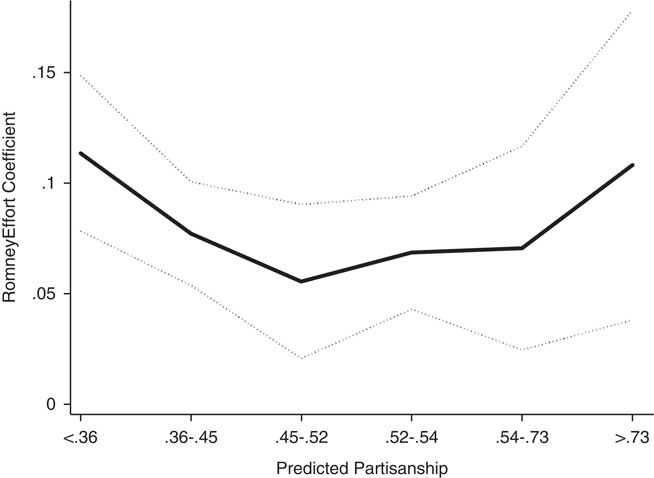
The estimates of aggregate voter mobilization from the previous section are averages across all eligible voters, and many individuals in targeted states likely received little direct contact from campaigns. In Figure 3, when we focus on smaller subsets of individuals that were more likely to have been contacted, we obtain larger estimates. Among predicted partisans, the large-scale interventions of the presidential campaigns appear to have increased turnout by more than 10 percentage points. Moreover, recall that our predictions of partisanship are imperfect. Presumably, if we had better information about the types of individuals targeted, we would estimate even greater mobilization effects among the most targeted groups, and we would expect starker differences in mobilization effects across subgroups.
One notable implication of these results is that campaigns can significantly change the composition of the voting population. By targeting partisan supporters, campaigns appear to produce a more partisan, polarized set of voters. Not only does this potentially distort the incentives of Presidential candidates to appeal to more partisan voters, but this also changes the set of individuals participating in down-ballot races, potentially affecting legislative polarization. Consistent with previous research (Enos, Fowler and Vavreck Reference Enos, Fowler and Vavreck2014), these results suggest that voter mobilization and campaigning does not necessarily lead to a more representative set of voters. Furthermore, as mobilization techniques are more widely adopted, we might expect the polarization of the voting population to increase further.
This analysis allows us to roughly compare the effectiveness of the Obama and Romney campaigns in mobilizing their respective supporters. Despite the purported technological sophistication of the Obama campaign and its intense use of data-driven, evidence-based campaign tactics (e.g., Issenberg Reference Issenberg2013), we see similar mobilization effects on both sides of Figure 3. The two campaigns were roughly comparable in their ability to turn out supporters. Moreover, this result is not an artifact of using the RomneyEffort variable; we obtain similar results with the other measures of campaign effort. Of course, this analysis does not preclude the possibility that the Obama campaign exceeded Romney in other areas that are more difficult to measure like persuasion or targeting. However, on the dimension of mobilizing people who look demographically like supporters, both campaigns appear to have been comparably effective.
Has Campaign Effectiveness Changed Over Time?
Previous studies have identified little difference in turnout between battleground and non-battleground states (e.g., Ashworth and Clinton Reference Ashworth and Clinton2007; Gerber et al. Reference Gerber, Huber, Doherty, Dowling, Raso and Ha2009), yet we detect large differences for 2012. What explains the discrepancy between our results and previous studies? One possibility is campaign effects have grown in recent years as a result of changes in technology, campaign strategy, or some other factor. We cannot use our same analytic strategy to investigate this possibility because our data is less accurate in past elections and we have less information on the campaign strategies for previous elections. As an alternative, we compare potentially pivotal and non-pivotal states in several recent presidential elections to ascertain whether campaign effectiveness appears to have changed over time.
For every presidential election between 1980 and 2012,Footnote 12 we determine which five states were most likely to be pivotal. We sort the states according to the their two-party vote share, and determine which state would have tipped the electoral college had one candidate won every state below it and had the other candidate won every state above it. We then select the two additional states on each side of this pivotal state to obtain our five pivotal states where much of the campaign effort was likely concentrated. We then run a differences-in-differences regression, taking advantage of states that switch in and out of the pivotal category, and estimate the extent to which changes in battleground status correspond to changes in turnout for each year.Footnote 13 Results are shown in Figure 4. Consistent with previous findings (e.g., Ashworth and Clinton Reference Ashworth and Clinton2007; Gerber et al. Reference Gerber, Huber, Doherty, Dowling, Raso and Ha2009), there was essentially no difference in turnout between battleground and non-battleground states before 2000, but the estimated effect increases monotonically in each of the next three elections, with an estimated effect of 6.1 percentage points in 2012. The effect of presidential campaigning on voter turnout appears to have increased significantly in recent elections.
Increasing campaign effects in recent presidential elections Note: The figure shows regression coefficients exploiting within-state changes in turnout as a state switches from non-battleground to battleground in a particular year. Dotted lines indicate 95 percent confidence intervals (derived from state-clustered standard errors).
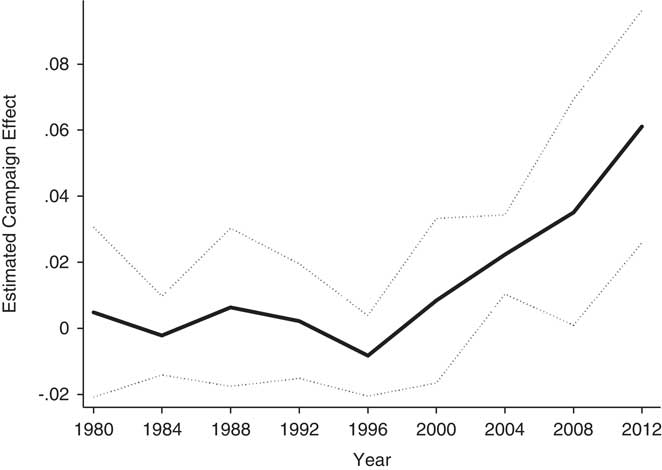
In our view, the most likely explanation for this phenomenon is that the ground game has become a larger and more important part of presidential campaigns. The rebirth of GOTV field experiments in the 21st century (e.g., Green and Gerber Reference Green and Gerber2008) presented hard evidence that individual voter contact such as door-to-door canvassing, phone calls, and direct mail can increase turnout. Several major policy and technological changes increased the availability of individual-level data, enabling campaigns to more easily identify, contact, and keep track of supporters (Hersh Reference Hersh2015, 58–65). With these revolutions in evidence and data availability, the scale of ground campaigning increased dramatically in the last few presidential elections (Issenberg 2012; Issenberg Reference Issenberg2013; Enos and Hersh Reference Enos and Hersh2015).
Can These Effects be Explained by Non-Campaign Factors?
We find that battleground residents are more likely to turn out than non-battleground residents of the same media market. We have already attempted to rule out the possibility that spurious factors correlated with battleground states bias our results. Placebo tests show that battleground and non-battleground residents of the same media market are comparable in terms of demographics, turnout in a non-presidential year, and their underlying interest in politics or voting. We also show that the results are unchanged by the inclusion of individual- and state-level covariates including the presence of other salient elections in the state and different registration and voting laws.
We have also discussed the possibility that residence in a battleground state influences turnout for reasons unrelated to campaigning. On one hand, an individual’s probability of casting a pivotal vote is higher in swing states, which could increase the direct returns to voting and make one more likely to turn out (Riker and Ordeshook Reference Riker and Ordeshook1968). On the other hand, the probability of casting a pivotal vote is miniscule in both battleground and non-battleground states (Gelman, King and Boscardin Reference Gelman, King and Boscardin1998). As Schwartz aptly points out, “Saying that closeness increases the probability of being pivotal … is like saying that tall men are more likely than short men to bump their heads on the moon” (Reference Schwartz1987).
Despite the tiny probability of a pivotal vote in a presidential election, there are other reasons to expect higher turnout in battleground states even in the absence of campaigns. A combination of uncertainty and altruism could provide a rational basis for turnout and could explain higher participation in battleground states (Myatt Reference Myatt2012). Perhaps individuals in battleground states overestimate their probability of casting a pivotal vote, are more interested in the election for psychological reasons, or exert more social pressure on others for reasons independent of the campaign. We must acknowledge these possibilities, but we believe them to be minimal if not negligible for four reasons. (1) Our placebo tests show that battleground voters were no more likely to be interested in politics or express an intention to vote before the presidential campaign began. (2) Experimental evidence suggests that considerations of pivotality have minimal effects on turnout (Hoffman, Morgan and Raymond Reference Hoffman, Morgan and Raymond2013; Enos and Fowler Reference Enos and Fowler2014). (3) If non-campaign factors explain our results, we would not necessarily expect to see the greatest effects among those individuals who were more likely to have been targeted, as in Figure 3. (4) Similarly, we would also not expect to see our estimated effect of campaigning increase dramatically in recent elections, as in Figure 4. Presumably, considerations of pivotally and other non-campaign factors were just as prevalent in previous elections, yet we only see these effects emerge in recent elections as campaigning has changed.
How Do Campaigns Mobilize Voters?
For reasons discussed in the previous section, we believe that we can reasonably attribute our estimated effects to campaigning as opposed to other spurious factors and the non-campaign incentives to vote. But what specific campaign-related activities can explain our aggregate estimates? Here, we explore several potential explanations and present suggestive evidence that the most important factor is ground campaigning—that is, door-to-door canvassing, phone calls, and direct mail. Of course, identifying mechanisms is difficult and often requires strong assumptions (Bullock, Green and Ha Reference Bullock, Green and Ha2010), so we should be cautious in our claims about particular channels. However, the mechanisms at work in this context are substantively important and therefore worth exploring.
Part of our estimated campaign effects could come from the mobilizing effects of television and mass media. Our design rules out the channel by which more news coverage and television advertising, in general, increases turnout, because all of our comparisons are within media markets where all residents receive the same television news coverage and campaign advertisements. This leaves ground campaign activity, the activity that varied across states, within media markets, as the most likely source of variation in turnout across states. Nonetheless, we might worry that the effects of television advertisements and news coverage are somehow greater in battleground states. Perhaps television ads or news coverage only mobilize voters who know they are in a competitive state or voters who have been personally contacted. We believe these possibilities hold negligible implications for our estimates for several reasons. First, previous evidence from Krasno and Green (Reference Krasno and Green2008) suggests that television advertising and battleground media coverage have little effect on turnout, and in the Appendix, we replicate this finding for 2012. Second, in the Appendix, we present an additional research design that allows us to estimate the effect of television advertising specifically in battleground states, and again, we find no evidence of an effect. Third, only a small fraction of presidential advertisements—about 5 percent—contained state-specific content.Footnote 14 Fourth, we see little difference between battleground and non-battleground states in previous elections when television advertising was even more prevalent in political campaigns and when television news viewership was even greater. Therefore, there is little reason to believe that advertising would systematically be more salient to viewers in battleground states.
Another potential driver of our estimated campaign effects is digital and internet advertising, which can be targeted at fine levels of geography. We expect the relative effectiveness of digital campaigning versus other efforts such as traditional voter contact to be small for several reasons. First, the sheer scale of internet advertising was relatively small. We communicated with the digital teams of the Obama and Romney campaigns and each team spent less than 10 million dollars on registration and GOTV.Footnote 15 This amount pales in comparison with more traditional forms of mobilization, where the efforts of each campaign exceeded 100 million dollars. Second, because television advertisements do not significantly increase turnout (e.g., Krasno and Green Reference Krasno and Green2008), we might expect similarly small effects for internet advertising which is similar to television advertising but smaller in scale.Footnote 16 Third, the few experiments related to internet campaigning show small effect sizes. E-mails have zero (Nickerson Reference Nickerson2007a; Nickerson Reference Nickerson2007b) or negligible (Malhotra, Michelson and Valenzuela Reference Malhotra, Michelson and Valenzuela2012) effects on registration and turnout. An extremely salient treatment utilizing social pressure conducted through Facebook on Election Day in 2010 increased turnout by only 0.3 percentage points (Bond et al. Reference Bond, Fariss, Jones, Kramer, Marlow, Settle and Fowler2012). The only experiment, to our knowledge, directly assessing political internet advertisements finds no effect on candidate evaluations (Broockman and Green Reference Broockman and Green2014).
Furthermore, our data allow us to partially separate the effects internet advertising and other campaign activity, and we estimate that the effect of internet advertising is minimal. We obtained data from the Obama campaign on their digital campaigning activities in each state, and we can include this measure of digital campaign effort in the same regressions shown in Table 1. In these regressions, discussed and presented in more detail in the Appendix, the coefficients on overall campaign effort are virtually unchanged while the coefficients on digital campaigning are actually slightly negative. Therefore, we conclude that our estimated effect of campaigning cannot be meaningfully attributed to digital or internet advertising.
By ruling out the most plausible alternatives, we conclude that the most prevalent mechanism explaining our estimates is traditional ground campaigning such as door-to-door canvassing, phone calls, and direct mail. The scale of this kind of voter contact increased dramatically at the same time that the differences between turnout in battleground and non-battleground states increased. The effectiveness of this form of campaign activity has received the strongest empirical support from previous research (see Green and Gerber Reference Green and Gerber2008), and its deployment and reach is significantly greater than newer forms of campaign activity such as digital advertising. We conclude that aggregate estimates of campaign effects likely arise primarily through the personal forms of voter communication that have received experimental support and have recently become a significant component of large-scale political campaigns.
Marginal Returns to Mobilization Efforts
A natural question, after seeing many estimates of small effects of individual voter contacts is whether many voter contacts aggregate up to something meaningful in a large-scale election. For example, a typical GOTV experiment compares the effect of a single voter contact (e.g., an attempted phone call) with nothing. As mentioned previously, the average effect of a single voter contact is typically small. Across more than 200 experiments analyzed by Green, McGrath and Aronow (Reference Green, McGrath and Aronow2013), the average effect of a single door knock, phone call, or piece of mail is 1.0, 0.7, or 0.4 percentage points, respectively. In isolation, these effects appear small, but do they add up to something meaningful in a large-scale campaign deploying many voter contacts at once?
Previous evidence provides little guidance on the aggregate returns to many voter contacts. Few experimental studies have randomly assigned subjects to receive multiple voter contacts (but see Gerber and Green 2000; Cardy Reference Cardy2005; Ramirez Reference Ramirez2005; Michelson, Bedolla and Green Reference Michelson, Bedolla and Green2007), and these studies are often underpowered and still fail to come anywhere close to the level of voter contact in a large-scale campaign. In one notable study, researchers experimentally evaluated the effect of an entire campaign, detecting large effects (Alvarez, Hopkins and Sinclair Reference Alvarez, Hopkins and Sinclair2010), but this was a state assembly campaign of limited scale, making it difficult to extrapolate to a large-scale campaign.Footnote 17
If the returns to campaign activity diminish quickly, then the effects of a large-scale campaign might be no bigger than the small GOTV effects identified in experiments. However, if multiple campaign efforts are additive or even synergistic, then the effects of a large-scale campaign could be massive. There must be a point at which the returns to campaign activity diminish, because turnout among a targeted population can never exceed 100 percent. However, up to that ceiling, we have little theory or evidence suggesting that the effects of additional campaigning should diminish quickly, slowly, or not at all.
Our study provides several opportunities to assess the marginal returns to campaign activity. First, our large aggregate estimates suggest that multiple voter contacts do add up to something meaningful and do not diminish too quickly. Second, Figure 2 shows that the effect of campaign activity on turnout increases approximately linearly with the difference in campaign effort. In other words, we find no evidence that the effect of campaign effort diminishes with increasing effort. Furthermore, if we are willing to assume that all of our estimated effects are explained by ground campaigning, an admittedly strong assumption, then we can conduct several back-of-the envelope calculations to further assess the aggregate effects of multiple contacts.
According to our data, the Romney campaign placed 8.8 million phone calls, sent 1.2 million pieces of mail, and knocked on 800,000 doors in the state of Nevada alone. The VEP of Nevada was ~1.8 million, so this means that the Romney campaign placed five phone calls, 0.7 pieces of mail, and 0.5 door knocks from the Romney campaign for every eligible voter in the state. Qualitative reports suggest that the Obama campaign exerted similar mobilization efforts, focusing more on door knocks and less on phone calls.Footnote 18 Therefore, we approximate that the average eligible voter in a heavily targeted state received seven to ten phone calls, one to two pieces of mail, and one to two door knocks from the presidential campaigns. Assuming that our estimated effects are driven solely by ground campaigning, we would conclude that a treatment including approximately seven to ten phone calls, one to two pieces of mail, and one to two door knocks increases turnout, on average, by 7–8 percentage points. This is remarkably consistent with the hypothesis that treatment effects are additive. Using the average estimates from Green, McGrath and Aronow (Reference Green, McGrath and Aronow2013), our point estimates are close to the sum of the average intent-to-treat effects of ten phone calls, two pieces of mail, and two door knocks (10×0.4+2×0.7+2×1.0=7.4). If the returns to ground campaigning diminish over the range of observed contacts, we would have expected much lower aggregate estimates. This result may be surprising to those who expect diminishing returns to multiple voter contacts, but there are compelling reasons to expect additive or even multiplicative effects, at least up to a point. Only a small fraction of citizens will answer the door, pick up the phone, or read their mail, and each new campaign effort may reach a new subset of citizens. Moreover, some citizens that are unresponsive to single treatments may be eventually mobilized by multiple treatments.
Another calculation yields a similar conclusion. We previously estimated that presidential campaigning mobilized 2.6 million voters who would not have turned out in the absence of campaigning. Our data from the Romney campaign indicates that they attempted 225 million voter contacts. If we assume that the Obama campaign attempted a similar number, then we could say that 550 million voter contacts produced ~2.6 million votes. Again, assuming that all of our estimated effects arise through voter contact, we would conclude that the average effect of a single voter contact on turnout was 0.6 percentage points (2.6/550=.0058), a number that is strikingly consistent with the average intent-to-treat effect identified through experiments. Although we cannot be sure that our estimated effects are not explained by something other than individual voter contact, these analyses suggest that multiple voter contacts can have large aggregate effects, and we find no evidence that the returns to campaigning diminish quickly.
If we are willing to assume that our estimated effects are explained by ground campaigning and that the effects of voter contacts are approximately additive, then we can rescale our previously estimated regression coefficients in order to interpret the marginal returns to dollars spent on the ground campaign. The estimated coefficient of .078 from Column 7 of Table 1 suggests that the effect of going from no campaign effort to the campaign effort in the most heavily targeted state increases turnout in that state by 7.8 percentage points. In the most heavily targeted state—Nevada, the Romney campaign spent the equivalent of $3.40/person in their ground mobilization efforts. If we assume that the Obama campaign exerted similar effort, then we can divide this coefficient by 6.8 and conclude that, on average, an extra dollar of campaign effort per capita increases turnout by 1.1 percentage points. Alternatively, this estimate implies that the average cost of generating a single vote is about 87 dollars.
Conclusion
Campaigns can influence the size and shape of the voting population, and the advent of the modern, scientifically driven campaign may increase the depth and scope of this influence. However, rigorous evidence has been lacking. Experiments show that individual voter contacts increase turnout, but the substantive size of these effects is small. To our knowledge, the 2012 presidential campaign offers the best available opportunity to assess the effects of modern, large-scale campaigns, because these methods were deployed at a larger scale than ever before, because these efforts varied idiosyncratically across states, and because we have unprecedented information about the activities of the presidential campaigns. According to our estimates, the 2012 presidential campaign increased average levels of turnout by ~7 percentage points in the most heavily targeted states, mobilizing 2.6 million individuals who would have otherwise not turned out. In short, large-scale campaigns can significantly increase political participation. Furthermore, our graphical analysis in Figure 2 and back-of-the-envelope calculations suggest that the effects of many mobilization efforts may be approximately additive.
In this paper, we have offered the first systematic assessment of the cumulative mobilization effect of a large-scale campaign. Contrary to some expectations, large-scale campaigns can significantly increase the size and composition of the voting population, rather than simply mobilizing a small fraction of voters on the margin. This phenomenon, in conjunction with recent increases in the use of ground campaigning, marks a significant change in the American electoral landscape, with millions of otherwise non-participating voters going to the polls. These findings may also lend insights for increasing participation in general, as the returns to multiple campaign efforts may be greater than previously expected.



