Implications
Improvement in feed efficiency is of growing interest in the beef industry due to its potential to increase producer profitability and lower the environmental footprint of beef production. As a complex multifaceted trait under the control of many biological processes, the importance of animal variability in feed efficiency traits is a relevant question that needs to be addressed. In the present study, apparent digestibility contributes to animal variation in feed efficiency. Further research is warranted to identify other biological mechanisms involved in feed efficiency, so as to improve animal selection in multitrait breeding programs.
Introduction
Feed inputs are a major determinant of profitability and represent the largest variable cost in beef production (Nielsen et al., Reference Nielsen, MacNeil, Dekkers, Crews, Rathje, Enns and Weaber2013). Selection of feed-efficient animals is a way to improve profitability. Traditionally, feed efficiency (FE) is expressed as a gain to feed ratio. However, the selection of a high gain to feed ratio resulted in an increase in growth rate and mature cow size (Schenkel et al., Reference Schenkel, Miller and Wilton2004), impacting in turn on the intake of the cow herd. An alternative measure of FE is the residual feed intake (RFI), proposed by Koch et al. (Reference Koch, Swiger, Chambers and Gregory1963) and extensively studied over the last decade in both monogastrics (Gilbert et al., Reference Gilbert, Billon, Brossard, Faure, Gatellier, Gondret, Labussière, Lebret, Lefaucheur, Le Floch, Louveau, Merlot, Meunier-Salaün, Montagne, Mormede, Renaudeau, Riquet, Rogel-Gaillard, Van Milgen and Noblet2017) and ruminants (Lawrence et al., Reference Lawrence, Kenny, Earley, Crews and Mc Gee2011; Xi et al., Reference Xi, Wu, Zhao, Yang, Li, Han and Wang2016). RFI is calculated as the difference between actual and expected feed intake required to support maintenance and production. RFI allows the evaluation of FE for each animal with regard to its counterparts. Efficient animals have negative RFI (they consume less feed than expected) and are classified as low RFI.
Several biological mechanisms have been suggested to account for differences in RFI. In a review for finishing beef steers, Herd and Arthur (Reference Herd and Arthur2009) estimated that variation in RFI was due to protein turnover and metabolism (37%), digestibility (10%), activity (10%), heat increment of feeding (9%), body composition (5%), feeding patterns (2%) and nearly 30% to other undefined metabolic processes. According to this study and among various biological mechanisms proposed, the contribution of the one relative to the digestive processes (i.e. digestibility and feeding behaviour) could be of importance, but the results are conflicting. Indeed, some studies have shown no relation between RFI of beef or dairy heifers and whole-tract digestibility of dry matter (Lawrence et al., Reference Lawrence, Kenny, Earley, Crews and Mc Gee2011; Rius et al., Reference Rius, Kittelmann, Macdonald, Waghorn, Jansen and Sikkema2012), whereas other studies report that diet dry matter digestibility (DMd) is negatively correlated with RFI (Nkrumah et al., Reference Nkrumah, Okine, Mathison, Schmid, Li, Basarab, Price, Wang and Moore2006, Krueger et al., Reference Krueger, Carstens, Gomez, Bourg, Lancaster, Slay, Miller, Anderson, Horrocks, Krueger and Forbes2009a). It is unclear, however, whether apparently improved digestive ability of feed-efficient animals is inherent or simply due to a slower passage of digesta through the rumen in relation to lower dry matter intake (DMI (Kenny et al., Reference Kenny, Fitzsimons, Waters and Mc Gee2018)). In some instances, the absence of differences in DMd between cattle of varying RFI phenotype may be related to the nature of the diets offered, as the effect of feed intake on digestion is lower with forage than with concentrate-based diets. The results from recent studies show that the proportion of the different microbial populations in rumen fluid differed between high and low RFI cattle, but such differences appeared to be modulated by the nature of the diet offered. Carberry et al. (Reference Carberry, Kenny, Han, Mc Cabe and Waters2012) reported a stronger relationship between RFI classification and rumen microbial diversity when animals were fed a high forage diet (100%) in comparison to a low forage diet (30%). In contrast, Hernandez-Sanabria et al. (Reference Hernandez-Sanabria, Goonewardene, Wang, Durunna, Moore and Guan2012) observed differences in rumen microbial populations between low and high RFI cattle only when the animals were fed a high concentrate diet (100%). Collectively, these studies suggested that FE, reflected by RFI classification, may be partly explained by the digestive ability of the animal, but with a strong interaction with the type of diet consumed. However, this interaction has yet to be investigated in more depth. Therefore, the objective of this study was to investigate the digestive ability of 15 beef cows selected for divergence in RFI as heifers using two contrasted diets: a high forage diet (100% hay of permanent grassland) and a fattening diet (whole-plant maize silage diet/concentrate, 67/33). For that purpose, and assuming that RFI is a repeatable trait across time and stage of production (Kenny et al., Reference Kenny, Fitzsimons, Waters and Mc Gee2018), the effects of RFI phenotypes on feed intake and apparent whole-tract digestibility and the behaviour of rumen fermentation variables were studied according to diet.
Material and methods
Animals, diets and experimental design
The experiment was performed at the National Institute for Agricultural Research (INRA) at the Saint-Genès-Champanelle (France) experimental farm in full compliance with national legislation on animal care (authorisation to experiments on living animals, no. C6334517, Ministry of Agriculture, France).
This experiment was conducted in association with a larger study designed to evaluate, inter alia, the relationship between FE and methane emission of 153 Charolais beef heifers (Renand et al., Reference Renand, Vinet and Maupetit2016). Briefly, in the trial performed during the winter of 2013 to 2014, two batches of 22 and 47 non-bred heifers aged 22 months were tested in November–December and February–March. The mean age and weight at the beginning of the test period were 675 days (s.d. = 9.3) and 494 kg (s.d. 50.3), respectively. Heifers were accommodated in pens equipped with individual troughs and automatic gates (American Calan Inc., Northwood, NH, USA) and floor covered with wood shavings. After an adaptation and training period of 4 weeks, they were offered ad libitum access to a grass silage diet, without supplementary concentrates, over an 8-week test period. The dry matter content of offered silage and refusal samples was measured, and the daily DMI was averaged over the whole test period. The diet distributed to the two batches had a DM content of 20.2 and 21.8 g/kg, respectively, and an estimated metabolisable energy concentration of 9.01 and 9.13 MJ/kg DM (INRA, 2007). Heifers were weighed every two weeks. A regression of weight on the test day was performed individually. The slope of the regression was used to calculate the average daily gain (ADG), and the predicted weight after 28 testing days was used as the mid-test weight (MW). The residual feed intake of heifers was calculated as the residual of a multiple regression of DMI on mid-test metabolic weight (MW0.75) and ADG in a model fitted for the batch contemporary group. The 69 heifers were inseminated. Among the females that calved at 3 years of age, eight females with the highest (inefficient heifer, high-RFI) or the lowest RFI (efficient heifer, low-RFI) values were not bred and were kept for the present study. After their first lactation (46 months on average), 15 of these 16 non-pregnant and non-lactating cows could enter the digestibility measurement barn (7 low-RFI and 8 high-RFI). Growth and efficiency traits (RFI, DMI and ADG) and body weight (BW) of the low-RFI and high-RFI heifers selected are presented in Supplementary Material Table S1. No differences between high- and low-RFI heifers in ADG and BW were observed. RFI averaged −0.73 and 1.02 kg DM/d in low-RFI and high-RFI heifers, respectively.
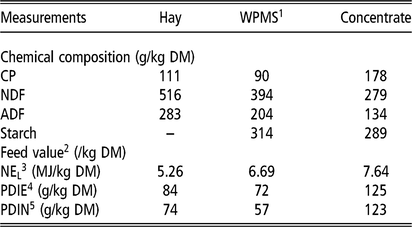
The 15 cows were housed in individual stalls and fed ad libitum a hay diet during a 2-week adjustment period. After that, both RFI groups were offered successively two different diets (hay or fattening diet) over four experimental periods (P1 to P4) each of 3-week duration. For each experimental period, cows were fed ad libitum during the first two weeks of adaptation and at 95% of individual ad libitum intake during week 3, to reduce the experimental errors when digestibility measurements were performed. The experimental scheme was designed to measure the between-animal variation of intake and apparent digestibility using two contrasted diets. These measurements were performed during two consecutive periods for each diet. During P1 and P2, cows received a hay diet consisting of 100% hay from permanent grassland distributed three times a day to minimise waste. After 1 week of transition, cows were fed twice a day during P3 and P4 with the fattening diet, which consisted of 67% of whole-plant maize silage (WPMS) and 33% of high starch concentrates on a DM basis. Water and salt block were available ad libitum and all cows received 250 g/d of mineral-vitamin supplement (Ca:P:Mg:Na = 20:2.5:4.5:3.5%, Galaphos Midi Duo Granule, CCPA, 15006 Aurillac, France). The chemical and nutrient compositions of diets are presented in Table 1.
Ingredients and chemical composition of cows’ diets

1 WPMS corresponds to whole-plant maize silage.
2 Calculated according to INRA (2007).
3 NEL corresponds to the net energy of lactation.
4 PDIE corresponds to ‘protéines digestibles dans l’intestin permises par l’Energie’.
5 PDIN corresponds to ‘protéines digestibles dans l’intestin permises par l’Azote’.
Measurements and sampling
Body weight and condition score
Cows were weighed at the start of week 2 and at the end of week 3 in each experimental period (P1 to P4). BW changes (final BW minus initial BW in kilograms) over both diets were calculated considering the BW measured in week 2 of P1 or P3 as initial BW and BW measured in week 3 of P2 or P4 as final BW. The body condition was assessed two times during the experiment (in week 2 of periods 1 and 3) by the same two experienced assessors on a 0 to 5 scale (Agabriel et al., Reference Agabriel, Giraud and Petit1986).
Intake
For each experimental period, intake and refusals were individually recorded every day. The total daily dry matter intake (DMI) was computed as daily DM offered minus DM refused for each animal. The DM content (24 h in 103°C forced-air dry oven) of feeds was measured once a week for the pelleted concentrate and twice a week (weeks 1 and 2) or every day (week 3) for hay and corn silage offered and refused. The DMI of WPMS was corrected for losses of volatile compounds (ethanol, NH3 and acetic and lactic acids, Dulphy et al., Reference Dulphy, Demarquilly, Henry, Jamot and L’hotelier1975). For chemical composition analysis, 100 g of each ingredient of the diet was collected daily during week 3 of each period, then pooled per period and stored at −20°C for corn silage and at room temperature for hay. In week 3 of each experimental period, 10% of refusals were sampled daily, pooled per animal × period and stored until analysis.
Total-tract digestibility and rumen fermentation traits
Total-tract apparent digestibility of DM, organic matter (OM), neutral detergent fibre (NDF) and acid detergent fibre (ADF) was determined by collecting total faeces and urine over 6 days in week 3 of each period. The fresh weight of excreta (faeces and urine mixture) and DM content were determined daily at 09.00. The total daily excretion of each cow was mixed, and a 1% aliquot was dried at 103°C for 24 h to determine the DM content. Another 6% aliquot was immediately dried at 60°C for 72 h and then pooled per animal and period to determine chemical composition (OM, NDF and ADF). The rumen fermentation traits were determined according to the description reported in Supplementary Material S1.
Chemical analysis
Diet ingredients, refusals and faeces were analysed for DM (103°C for 24 h) and ash (550°C for 6 h). NDF using α-amylase and ADF (Van Soest et al., Reference Van Soest, Robertson and Lewis1991) were analysed on samples dried at 60°C for 72 h and ground through a 1-mm screen.
Measurements of feeding and physical behaviours
The Rumiwatch® system (RWS, Itin + Hoch, Liestal Switzerland) was used to record continuously both feeding (eating and ruminating time) and locomotion (lying and standing time) activities (Zehner et al., Reference Zehner, Niederhauser, Nydegger, Grothmann, Keller, Hoch, Haeussermann and Schick2012). The details of implementation are reported in Supplementary Material S2.
Statistical analysis
Data were analysed by ANOVA using the mixed procedure of SAS software, version 9.3 (SAS Institute Inc., Cary, NC, USA). Data recorded over only one period per diet (body condition score, all fermentation parameters, feeding and locomotion activities) were analysed using a mixed model that included RFI group (low-RFI and high-RFI), diet (hay and fattening diet) and RFI × diet interaction as fixed effects and the cow as a random effect. Data recorded over two periods per diet (feed intake and apparent whole-tract digestibility) were analysed using a mixed model that included RFI group (low-RFI and high-RFI), period (P1 to P4) and their interaction as fixed effects, period as a repeated effect and the cow as a random effect. The specific effect of diet (hay v. fattening diet) was tested by contrast (P1 and P2 v. P3 and P4, respectively). Main effects were considered significant at P < 0.05. Differences were localised post hoc by the Tukey t test. For feed intake and nutrient digestibility, Pearson correlation coefficients between periods within and between diets were determined using the CORR procedure of SAS.
Results
Age, body weight and body condition score
Initial and final BW, mean metabolic BW and mean body condition score (BCS) according to the RFI group and the diet are presented in Table 2. There was no effect of RFI group and RFI × diet interaction on these variables. A significant effect of the diet type was observed (P < 0.0003): WPMS v. hay diet resulted in a higher initial (710 v. 663 kg) and final (752 v.675 kg) BW, a higher metabolic BW (140 v. 131 kg BW0.75) and a higher BCS (3.3 v. 2.8).
Body weight and body condition of cows as a function of residual feed intake (RFI) phenotype and diet

1 WPMS corresponds to whole-plant maize silage.
2 Low-RFI is efficient.
3 High-RFI is inefficient.
4 Initial BW corresponds to the BW measured at the beginning of week 2 in period 1 for the hay diet and period 3 for the WPMS diet.
5 Final BW corresponds to the BW measured at the end of week 3 in period 2 for the hay diet and period 4 for the WPMS diet.
6 BW0.75 corresponds to the mean of metabolic body weight measured during periods 1 and 2 for the hay diet and periods 3 and 4 for the whole-plant maize silage diet.
7 BCS corresponds to the average body condition score in the hay and WPMS diets and was measured by two experienced assessors according to the method of Agabriel et al. (Reference Agabriel, Giraud and Petit1986) using a 0 to 5 scale.
Feed intake and apparent whole-tract digestibility
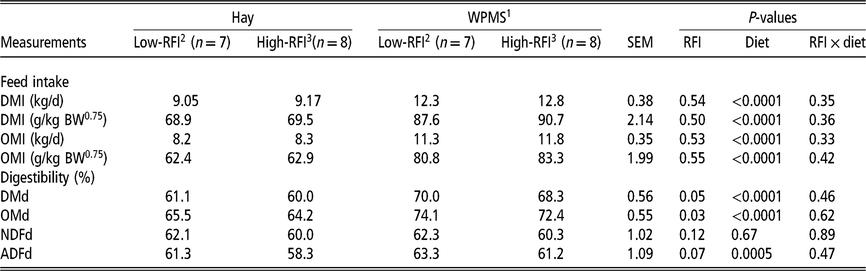
The effect of diet and RFI group on feed intake and apparent whole-tract digestibility coefficients is presented in Table 3. A significant effect of diet type was observed on all these parameters except NDF digestibility (NDFd). The DMI expressed in kg per day or in g per kg of metabolic weight and per day was higher (P < 0.0001) in cows fed the WPMS diet than in those fed the hay diet (38 and 29%, respectively). Similarly, the OM intake, regardless of the units used, was higher (P < 0.0001) when animals received the WPMS diet (40 and 31%, respectively). The total-tract apparent digestibility of DM, OM and ADF was also subject to an effect of the diet. The digestibility coefficients were higher (P < 0.0005) when offered the WPMS diet than when cows consumed the hay diet and were 8.5, 8.3 and 2.4 higher on average, respectively. The NDF digestibility coefficients were similar whatever the type of diet consumed by the cows or the RFI class.
Effects of residual feed intake (RFI) phenotype and diet on feed intake and apparent whole-tract digestibility of cows

DMI = DM intake; OMI = organic matter intake; DMd = DM digestibility; OMd = organic matter digestibility; NDFd = NDF digestibility; ADFd = ADF digestibility.
1 WPMS corresponds to whole-plant maize silage.
2 Low-RFI is efficient.
3 High-RFI is inefficient.
A significant effect of RFI class was observed for DM (P = 0.05) and OM apparent digestibility (P = 0.03). These digestibility coefficients were on average 1.8 g/100 g and 2.3 g/100 g higher in low- than in high-RFI cows fed hay and WPMS, respectively. No effects of RFI group and RFI × diet interaction on DMI, organic matter intake and NDF digestibility parameters were observed. A trend (P = 0.07) was only observed for ADF digestibility, which was slightly higher in the low-RFI group.
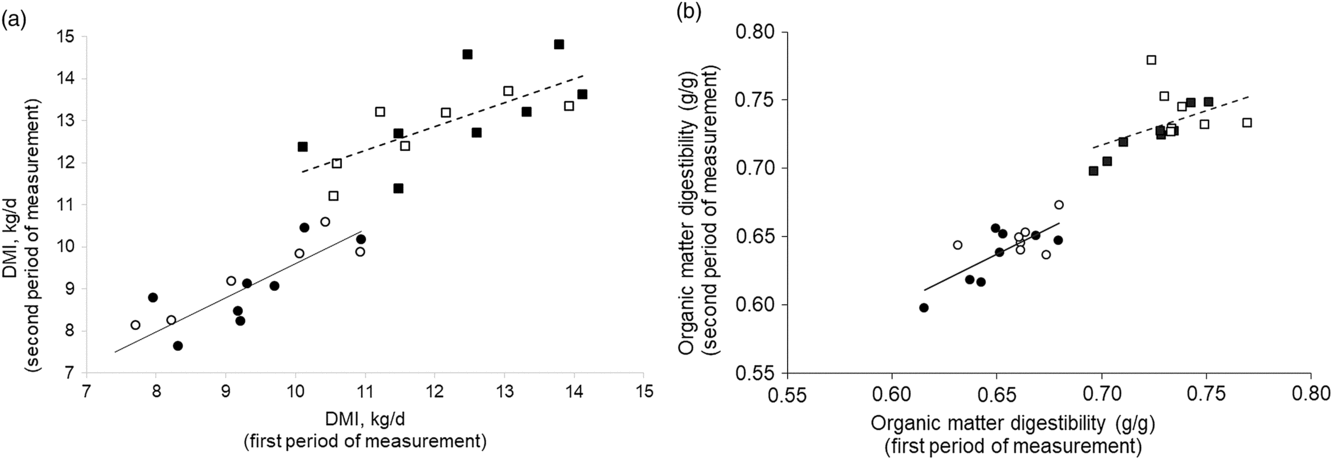
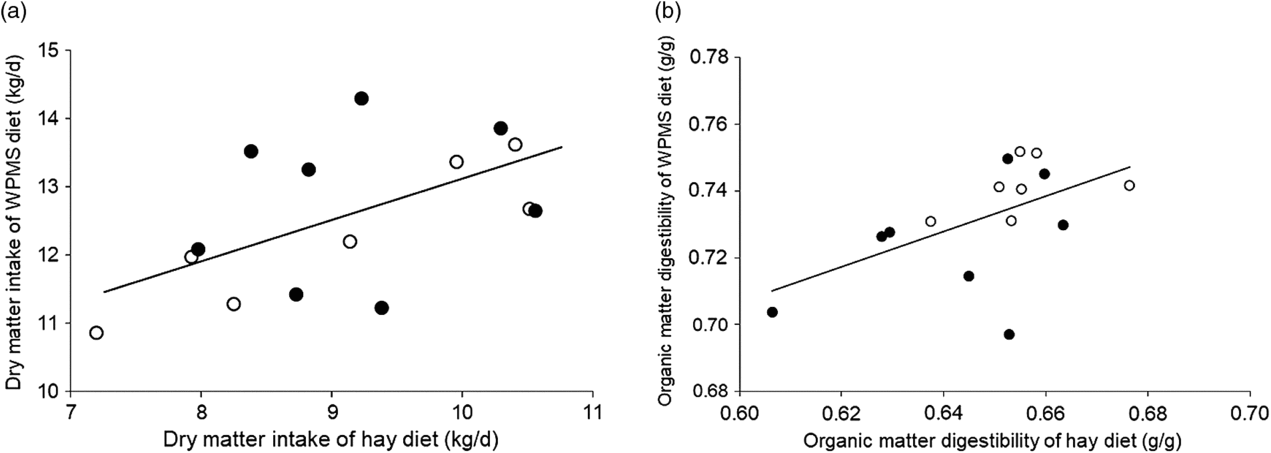
The repeatability of DMI and organic matter apparent digestibility (OMd) measurements between periods and within diets is illustrated in Figure 1a and b. For each diet, DMI and OMd measured in the first period were positively correlated with measurements performed in the second period. These within-diet correlation coefficients ranged from 0.71 to 0.87 for DMI and from 0.48 to 0.73 for OMd. The relationship between hay and WPMS diet measurements (mean/animal/diet) is illustrated in Figure 2 for both DMI (a) and OMd (b). A positive and significant correlation was observed for both intake (r = 0.55, P = 0.033) and OMd (r = 0.54, P = 0.03).
Relationship between the two subsequent periods of measurements of dry matter intake (DMI, kg/d) (a) and of organic matter digestibility (OMd, g/g) (b) for hay and whole-plant maize silage (WPMS) diets measured in divergent residual feed intake (RFI) cows. Hay diet (circles and solid line): DMI_P2 = 1.50 ( ± 1.18) + 0.811 ( ± 0.127) × DMI_P1; n = 15; P = 0.0001; RMSE = 0.540; r = 0.87. WPMS diet (squares and dashed line): DMI_P4 = 6.07 ( ± 1.88) + 0.66 ( ± 0.154) × DMI_P3; n = 15; P = 0.003; RMSE = 0.745; r = 0.71. Low-RFI cows are represented by open symbols, and high-RFI cows are represented by closed symbols Hay diet (circles and solid line): OMd_P2 = 0.143 ( ± 0.127) + 0.761 ( ± 0.193) × OMd_P1; n = 15; P = 0.002; RMSE = 0.013; r = 0.73. WPMS diet (squares and dashed line): OMd_P4 = 0.364 ( ± 0.188) + 0.504 ( ± 0.257) × OMd_P3; n = 15; P = 0.072; RMSE = 0.018; r = 0.48. Low-RFI cows are represented by open symbols, and high-RFI cows are represented by closed symbols.

Relationship between measurements of dry matter intake (DMI, kg/d) (a) and between measurements of organic matter digestibility (OMd, g/g) (b) when divergent residual feed intake (RFI) cows were fed the hay and whole-plant maize silage (WPMS) diets (mean of the data of the two subsequent periods). DMI_WPMS = 7.48 ( ± 2.15) + 0.558 ( ± 0.234) × DMI_hay; n = 15; P = 0.033; RMSE = 0.930; r = 0.55. Low-RFI cows are represented by open symbols, and high-RFI cows are represented by closed symbols. OMd_WPMS = 0.389 ( ± 0.147) + 0.529 ( ± 0.226) × OMd_hay; P = 0.036; n = 15; RMSE = 0.014, r = 0.54. Low-RFI cows are represented by open symbols, and high-RFI cows are represented by closed symbols.

Ruminal fermentations
The effects of diet and RFI group on rumen pH, ammonia, total volatile fatty acid (VFA) and molar proportions of fermentation acids are presented in Supplementary Material Table S2. There was an effect of the diet on N-NH3 and total VFA concentrations. The N-NH3 concentration was higher in cows fed the WPMS diet than in those fed hay (P < 0.002), whereas the concentration of total VFA was 1.3 times higher in the hay diet than in the WPMS diet (P < 0.0017). There were no effects of RFI group and RFI × diet interaction (P > 0.05) on pH, N-NH3 and total VFA concentrations.
Proportions (mol/100 mol of total VFA) of acetate, iso-butyrate, iso-valerate and the acetate:propionate ratio were significantly different between the two types of diets (P < 0.009). The molar proportions of iso-butyrate and iso-valerate were greatest in the WPMS diet. In contrast, the molar proportion of acetate and the acetate:propionate ratio were higher in cows fed the hay diet than in those fed the WPMS diet. A significant interaction (P = 0.05) between RFI phenotype and diet was observed for proportion of valerate: its concentration was 1.8 times higher in high-RFI cows fed the WPMS diet than in low-RFI cows fed the hay diet. The VFA profiles did not differ between the RFI groups.
Budget time of feeding and locomotion behaviours
The effects of RFI phenotype and diet on feeding and locomotion behaviours are reported in Supplementary Material Table S3. There were no effects of RFI group and RFI × diet interaction on feeding and locomotion behaviours; only a significant effect of the type of diet was observed. Cows fed the WPMS diet spent (P < 0.01) less time eating and ruminating in comparison with cows fed the hay diet. Concerning the locomotion activities, cows fed the hay diet spent more time per day in a standing position than those fed WPMS (633 v. 525 min/d, respectively, P < 0.005). Conversely, time spent lying was greater in cows fed the WPMS diet than in those receiving the hay diet (914 v. 806 min/day, respectively, P < 0.005).
Discussion
In this study, the digestive ability of 15 cows selected for divergence in RFI as heifers was investigated. The average difference in RFI detected between high- and low-RFI heifers was 1.75 kg DM/day of grass silage. These values were within the range of those reported by other authors who studied RFI and animal performances including digestibility measurements in animals differing in breed, gender, diet and age (1.470 and 2.03 kg/d for red angus steers in growing and finishing phase, respectively (McGee et al., Reference McGee, Welch, Ramirez, Carstens, Price, Hall and Hill2014); 1.59 kg/d for dairy cows (Xi et al., Reference Xi, Wu, Zhao, Yang, Li, Han and Wang2016)). In these studies, the RFI measurement period just pre-dated the digestibility trials, which is not the case in our work since the digestibility trial was performed in dried-off cows, whereas RFI was measured when they were heifers. However, as suggested by Kenny et al. Reference Kenny, Fitzsimons, Waters and Mc Gee2018, it was assumed that the RFI index is repeatable across time and stage of production. Moreover, the duration of the digestibility trial is not sufficient to calculate an RFI index since each diet feed intake was recorded during 6 weeks, including 2 weeks when cows were fed at 95% of individual ad libitum intake.
Feed intake and residual feed intake classification
RFI is gaining widespread acceptance as the most appropriate measure of FE for beef cattle (McDonnell et al., Reference McDonnell, Hart, Boland, Kelly, Mc Gee and Kenny2016) and is characterised by a significant difference in ingestion between animals for a given level of production. In our work, dry matter intake of both diets did not differ across RFI groups, expressed in kg DM/d, g DM/kg BW0.75 or per 100 kg BW (data not shown). This result may seem surprising, but the calculation of RFI was done when the animals were heifers, whereas the digestibility trial was performed in the same animals two years later after their first lactation. This delay could explain, at least in part, the lack of significance between these two variables. Indeed, RFI is a moderately repeatable trait across time (maturity), stage of production and type of diet (Kenny et al., Reference Kenny, Fitzsimons, Waters and Mc Gee2018) and a decrease in RFI divergence evaluated in the same animals during growth and lactation has previously been reported (MacDonald, Reference MacDonald, Pryce, Spelman, Davis, Wales, Waghorn, Williams, Marett and Hayes2014). However, under our conditions, low-RFI cows consumed 0.12 kg DM/d less hay than high-RFI cows, while the BW gain was comparable in both groups: 13 and 11 kg, respectively. Although RFI could not be measured in these short testing periods, these results suggest that cows characterised as low-RFI heifers were more efficient during the experiment than those characterised as high-RFI heifers. Similar results were observed when cows were fed the WPMS diet, low-RFI cows consuming 0.5 kg DM/d less, while the BW gain was similar to that of high-RFI cows (42 kg on average). In this study, measurements were performed for each diet over two consecutive periods of three weeks and the results observed between weeks of measurements within diet were similar. The repeatability of these measurements is high for both the WPMS diet (r = 0.71) and the hay diet (r = 0.87). When the overall data were used, a positive correlation (r = 0.55, P < 0.04) between DMI of hay diet and DMI of WPMS diet was observed, showing that the cows that eat the most hay are those that eat the most WPMS diet.
Cows were restricted to 95% ad libitum during the digestibility measurements. Under these experimental conditions, no correlation between the average DMI measured during the two periods of hay diet and phenotypic RFI was detected (r = 0.07, P = 0.76). However, when the cows were offered the WPMS diet, the relation between the average DMI measured during P3 and P4 and the phenotypic RFI was better, albeit not significant (r = 0.23, P = 0.40). These results are consistent with previous results (Lawrence et al., Reference Lawrence, Kenny, Earley, Crews and Mc Gee2011; McDonnell et al., Reference McDonnell, Hart, Boland, Kelly, Mc Gee and Kenny2016) reporting a positive correlation between RFI and DMI when cows were fed total mixed rations (r = 0.50, P < 0.01), but not when they were fed grass silage (r = 0.07). Indeed, compared with feeding diets based on high levels of concentrate, feeding high forage diets may limit voluntary intake and thus reduce the expression of inherent DMI potential (Forbes Reference Forbes, Dijkstra, Forbes and France2005).
Nutrient digestibility
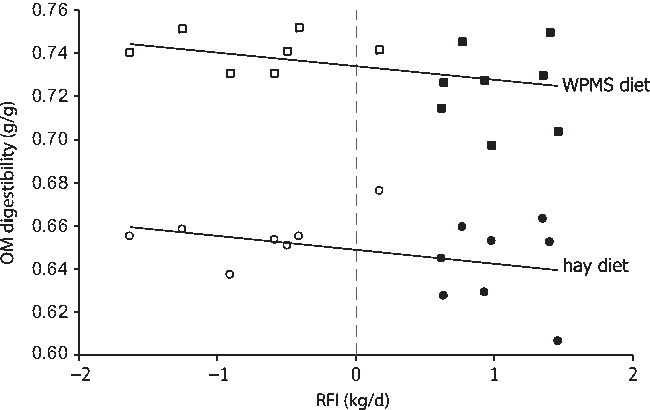
Nkrumah et al. (Reference Nkrumah, Okine, Mathison, Schmid, Li, Basarab, Price, Wang and Moore2006) reported a negative correlation between RFI and apparent digestibility of DM (r = −0.33, P < 0.10) and showed that differences, measured over a 5-day total collection of faeces, accounted for 5% between high- and low-RFI crossbreed steers (P < 0.05). Similar results have been obtained by Rius et al. (Reference Rius, Kittelmann, Macdonald, Waghorn, Jansen and Sikkema2012) who reported a trend (P < 0.1) for greater DM and OM digestibility in low-RFI compared with high-RFI lactating cows. A recent study (Potts et al., Reference Potts, Boerman, Lock, Allen and VandeHaar2017) in lactating Holstein cows yielded comparable results. These authors observed a negative correlation between DM digestibility and RFI (r = −0.30, P < 0.01) when cows were fed a low-starch diet (14% starch and 40% NDF), but not when they received a high-starch diet (30% starch and 27% NDF). In contrast, other authors, using either beef steers or heifers, failed to establish such a relation between these two traits (Lawrence et al., Reference Lawrence, Kenny, Earley, Crews and Mc Gee2011). However, these studies relied on internal markers (lignin and acid-insoluble ash) to estimate the digestibility from faecal grab samples. Systematic and random errors can increase markedly when using markers which limit the ability to detect differences in digestibility between individuals (Rius et al., Reference Rius, Kittelmann, Macdonald, Waghorn, Jansen and Sikkema2012; Fischer et al., Reference Fischer, Delagarde and Faverdin2016). In our experiment, where the total faeces collection was used to measure apparent whole-tract digestibility, beef cows classified as low- or high-RFI when they were heifers differed significantly (P = 0.03) in their ability to digest OM by about 2 to 2.3 g/100 g OM when they were fed hay or the WPMS diet, respectively (Table 3). Similar results were obtained with DMd (P = 0.05). Taken together, a negative within-diet relationship between RFI values and the apparent digestibility of OM (P = 0.044, Figure 3) and DM (P = 0.070, not shown) was detected. In addition, no interaction between RFI classes and nature of diet was observed, suggesting that the nature of the diet did not modulate the ranking of cows in their ability to digest nutrients, contrary to some published results (Nkrumah et al., Reference Nkrumah, Okine, Mathison, Schmid, Li, Basarab, Price, Wang and Moore2006; Rius et al., Reference Rius, Kittelmann, Macdonald, Waghorn, Jansen and Sikkema2012; Potts et al., Reference Potts, Boerman, Lock, Allen and VandeHaar2017). Besides the method of sampling and analysis of digestibility, discrepancies in the relationships between RFI and nutrient digestibility among studies could be partially explained by differences in the level of feeding. In a recent review, Cantalapiedra-Hijar et al. (Reference Cantalapiedra-Hijar, Abo-Ismail, Carstens, Guan, Hegarty, Kenny, McGee, Plastow, Relling and Ortigues-Marty2018) conducted a meta-analysis of 15 published studies and found between individuals and within diet a negative correlation between DM digestibility and DM intake. In our experiment, such a relationship was not observed, which is not surprising since intake was limited to 95% ad libitum during the digestibility measurement.
Relationship between the residual feed intake (RFI) measured in heifers and the organic matter apparent digestibility (OMd, g/g) of the whole-plant maize silage diet (WPMS, squares) and the hay diet (circles) measured in the same animals when they become cows. Each point indicates the average digestibility measured in each diet. High-RFI cows are represented by closed squares and circles; low-RFI cows are represented by open squares and circles. OMd = a − 0.0063 ( ± 0.003) × RFI, with a = 0.649 ( ± 0.003) with hay diet, or 0.734 ( ± 0.003) with WPMS diet; n = 30; n diet = 2, P = 0.044; r = −0.94. One point corresponds to the average value of two periods of digestibility measured per diet and per cow.

Rumen fermentation parameters
VFAs are the major end-products of ruminal fermentation and are largely determined by the diet type, which modulates microbial populations. In our study, there was no relationship between RFI phenotype and rumen VFA concentrations or molar proportions except for the concentration of valerate, since an interaction between RFI phenotype and diet was observed (P < 0.04). These results are in contrast to other reports suggesting that inter-animal variations in VFA concentrations are related to the variation in RFI, but the results are highly variable among studies. For example, Krueger et al. (Reference Krueger, Carstens, Gomez, Bourg, Lancaster, Slay, Miller, Anderson, Horrocks, Krueger and Forbes2009a) observed that low-RFI heifers consuming a high-forage diet had a higher ruminal acetate:propionate ratio and a lower propionate concentration than their high-RFI contemporaries. In contrast, Lawrence et al. (Reference Lawrence, Kenny, Earley, Crews and Mc Gee2011) reported a greater concentration of propionate in low-RFI heifers fed a pasture silage plus concentrate diet. In another study, lower concentrations of butyrate and iso-valerate were reported in low-RFI steers fed a high-grain ration (Hernandez-Sanabria et al., Reference Hernandez-Sanabria, Goonewardene, Wang, Durunna, Moore and Guan2012), whereas Krueger et al. (Reference Krueger, Carstens, Paddock, Calloway, Anderson, Krueger, Gontcharova, Dowd, Gomez and Pinchak2009b) did not observe any differences in ruminal pH and VFA concentration among divergent RFI cattle fed a high-corn diet. In this study, as there was no relationship within diet between RFI and VFA concentration, it is unlikely that changes in VFA concentration contribute to the inter-animal variation in RFI.
Posture activities and feeding behaviour
As cows were tied up in individual stalls, the detection of only lying and standing behaviours was performed. In our study, the times spent lying (between 53 and 63%) and standing (between 37 and 47%) are generally within the range of those reported by Mialon et al. (Reference Mialon, Martin, Garcia, Menassol, Dubroeucq, Veissier and Micol2008) in young bulls. These authors reported that the lying time ranged from 59.5% to 62.3% in bulls fed the hay-concentrate (44/56) and maize silage-concentrate (57/43), respectively. Besides the effect of the nature of diet on postural behaviours, no differences in time spent standing or lying were observed between the two RFI divergent groups of cows. These results are similar to those reported in dairy heifers (Lawrence et al., Reference Lawrence, Kenny, Earley, Crews and Mc Gee2011). The feeding behaviours (ruminating and eating activities) were assessed by using a nose sensor-based system recently validated in dairy cows (Ruuska et al., Reference Ruuska, Kajava, Mughal, Zehner and Mononen2016; Zehner et al., Reference Zehner, Umstätter, Niederhauser and Schick2017). In our study, no differences in eating and rumination time or in eating rate were observed between the two RFI groups. These results differ from reports that there is a positive phenotypic or genetic correlation between RFI and daily feeding durations in growing cattle (Nkrumah et al., Reference Nkrumah, Crews, Basarab, Price, Okine, Wang, Li and Moore2007) and in lactating cows (Xi et al., Reference Xi, Wu, Zhao, Yang, Li, Han and Wang2016). However, in these studies, differences in feeding behaviour were also associated with intake differences. Those results were confirmed in a recent meta-analysis by Kenny et al. (Reference Kenny, Fitzsimons, Waters and Mc Gee2018), in which high-RFI cattle receiving an energy-dense high-concentrate diet spent 12% more time eating than their low-RFI contemporaries. At the same time, high-RFI animals exhibited a 17% higher DM intake than low-RFI animals, implying a faster eating rate. Due to the diversity of methods of measuring feeding behaviour (observations, electronic gate, automatic weighing, portable device, etc.) and to the contradictory results reported in the literature, it is difficult to conclude how the feeding pattern helps to explain part of the differences in RFI among animals.
Conclusions
The experimental design and the sample collection and analyses adopted during this study appear to detect consistently small differences in apparent digestibility in beef cows selected for divergence in RFI as heifers. The correlation between intake and RFI, even though not statistically significant, and between apparent digestibility of OM and RFI, supports the fact that low-RFI cows ingest slightly less and digest slightly more efficiently than high-RFI cows. The lack and/or the weakness of significance on intake could be explained firstly by a restriction of intake to 95% ad libitum during periods of measurements and secondly by a possible re-ranking of RFI between the period during which RFI was measured (20 to 22 months) and the period of the digestibility experiment (36 months), due to a decrease in RFI divergence with age and/or physiological stage.
In addition, our results suggested that there was no interaction between RFI phenotypes and the nature of the diet in terms of the measured ingestive and digestive traits. These results suggest that the nature of the diet did not modulate the ranking of cows in their ability to ingest and digest nutrients. Further research is warranted to clearly establish the underlying metabolic and physiological processes that contribute to the divergence of RFI among individuals.
Supplementary material
To view supplementary material for this article, please visit https://doi.org/10.1017/S1751731119001137.
Acknowledgements
The authors thank the staff of the INRA experimental Unit Bourges (UE0332), especially David Maupetit for animal management during the RFI test, and Herbipôle (UE1414), especially Sylvie Rudel for planning the experiments, and Dominique Roux, Viviane Tate and Christophe Mathevon for animal management and sample collection. We also acknowledge Isabelle Constant, Lucette Genestoux and Fabienne Picard, INRA France, for technical assistance; José Pires, INRA France, for statistical assistance and David Marsh for review of our English. Additionally, the authors wish to thank APIS-GENE for their financial support of this project, which forms part of the national program BEEFALIM 2020.
Anne De La Torre, 0000-0001-6628-5414
Declaration of interest
None.
Ethics statement
The experiment was approved by the Ethics Committee of the Auvergne-Rhône-Alpes region and the French Ministry of Higher Education, Research and Innovation (ref APAFIS#812-2015061108596805v2).
Software and data repository resources
None of the data were deposited in an official repository.