I. INTRODUCTION
As an industrially relevant candidate, nanoscale titanium dioxide (TiO2) system is widely used in paints,Reference Braun, Baidins and Marganski1 pigments,Reference Pfaff and Reynders2 ointmentsReference Yuan, Chen and Hu3 etc. In addition to its non-hazardous nature, TiO2 is regarded as one of the best photosensitive, wide band gap (e.g., E g = 3.1 eV at 300 K for anatase phase) semiconductor systems in the family of oxides such as, ZnO, WO3, and SnO2.Reference Lin, Wu and Onn4 It was demonstrated that, as an efficient heterogeneous photocatalyst, nano-sized TiO2 is very useful in degrading pollutants and dyes.Reference Chatterjee and Mahata5,Reference Yu, Lee, Yu and Ao6 Furthermore, owing to its good mechanical, optical, and thermal properties, TiO2 is believed to be the ideal host system for incorporating rare-earth (RE) impurity ions as dopants. One of the major advantages offered by these materials is the ability to tailor size dependent optical properties and to achieve high luminescence response through the sensitization by the host.Reference Yin, Xiang and Zhao7 Several reports have demonstrated the intense RE3+ emission response of RE incorporated TiO2 nanoscale systems along with a suitable explanation of the energy transfer mechanism.Reference Conde-Gallardo, Garcia-Rocha, Hernandez-Calderon and Palomino-Merino8–Reference Hu, Song, Pan, Yan, Qin, Dai, Fan, Li and Bai10 Compared to other trivalent RE ions, Eu3+ gives strong red emission due to intra 4f carrier transitions thus making the system more useful in technologically important optoelectronic and display elements.Reference Wilke and Breuer11,Reference Frindell, Bartl, Popitsch and Stucky12 Besides that, Eu-doped TiO2 nanomaterials could exhibit better photocatalytic activity as compared to their undoped counterpart. This is because of generation of adequate number of electron trap centers by Eu3+ ions as a result of which recombination time of the charge carriers can be suppressed drastically.Reference Yang, Lu, Hua and Du13 On the other hand, the RE ions can promote the degradation process (photocatalysis) of many hazardous pollutants and dyes through active interaction with the organic molecules of the pollutants.Reference Xiaohong, Wei, Xianbo, Yang, Huiling and Zhaohua14,Reference Xiao, Si, Yu and Qiu15 The incorporation of lanthanide ions into the TiO2 host may help organic pollutants to concentrate on the semiconductor surface. Earlier, the efficiency of photocatalysis was found to be dependent on the crystal phase of the product and was prominent when comprised of a single anatase phase.Reference Ranjit, Willner, Bossmann and Braun16 The effect of mixed phase and synergistic response initiated by nanoscale titania on photocatalytic performance was also demonstrated in the past.Reference Hurum, Agrios, Gray, Rajh and Thurnauer17,Reference Ohno, Tokieda, Higashida and Matsumura18
It is known that sol-gel routes are capable of synthesizing high surface area TiO2 nanoparticles.Reference Diebold19 In the present work, we used an easy to use sol-gel mediated rapid condensation technique to synthesize un-doped and Eu3+ doped TiO2 nanostructured systems. Apart from the nature and origin of radiative emission characteristics, photocatalytic activity on methyl orange (MO) dye was assessed for varying Eu content. The incorporation of Eu3+ ions into the TiO2 host has a 2-fold aim: to enhance the catalytic performance and to yield a system that is capable of displaying tunable optoelectronic transitions along with select emission response.
II. EXPERIMENTAL DETAILS
The synthesis protocol and techniques used for studying various properties are as detailed below.
A. Growth of Eu3+doped TiO2 nanoscale powder
We have synthesized un-doped and Eu3+ doped TiO2 nanoparticles by hydrolyzing titanium isopropoxide (TTIP, Aldrich, 99.9% pure, St. Louis, MO) in an alcoholic medium followed by a rapid condensation process.Reference Yin, Xiang and Zhao7 In a typical reaction, 3 mL of TTIP was transferred to a conical flask containing 15 mL of propanol and then, the sol was subjected to stirring (∼250 rpm) for 30 min. A hydrolyzer solution of 1 mL of HCl in 5 mL of H2O was added to it followed by stirring at moderate temperature (∼75 °C) for 3 h. The precursor solution was then kept in the dark overnight for homogenous growth of TiO2 nanoscale colloids. The gel formed was separated through filtration and high-speed centrifugation. Finally, the as-received gel was dried at room temperature and subsequently, annealed at different temperatures to yield fine powders of TiO2. For doping purpose, we took a suitable amount of europium acetate (EuAc, 99.9% pure, CDH) in the hydrolysis step. In the host, the doping level of Eu3+ was varied as 1, 2.5, and 5%.
B. Analytical tools used for structural and optical studies
The crystallographic information such as, diffraction plane and structural phase of the un-doped and doped samples was revealed by x-ray diffraction (XRD) studies by using a Rigaku MiniFlex diffractometer (Shibuya-Ku, Tokyo, Japan) equipped with an intense Cu Kα radiation (λ = 1.54 Å). The diffraction signal was monitored for the Bragg’s diffraction angle (2θ) in the range of 20–60°. The particle size and morphology of the un-doped and doped nanoparticles were assessed using a JEOL JEM-2100 transmission electron microscope (TEM; Akishima, Tokyo, Japan) operating at an accelerating voltage of 200 kV. The energy dispersive x-ray (EDX) analysis was performed on a JEOL, 6390 LV (Singapore), scanning electron microscope. The optical absorption features and photoluminescence (PL) characteristics of the synthesized samples were examined using a Shimadzu-2450 UV–Vis spectrophotometer (Japan) and PerkinElmer LS 55 Fluorescence spectrophotometer (Singapore), respectively. Finally, the nanostructure-surface area estimation was performed through a vivid analysis of N2 adsorption/desorption isotherms obtained at 77 K (Quantachrome Nova 1000e, Boynton Beach, FL).
C. Analytical techniques used for photocatalytic studies
The photocatalytic activity of un-doped and Eu3+ doped TiO2 nanoparticles were evaluated by examining the degradation of MO dye under UV light. Methyl orange (MO, C14H14N3NaO3S), a common target is known to be carcinogenic and mutagenic, was chosen in our photocatalytic study. A suspension of 0.25 g/L of TiO2 catalyst was added to MO solution (10 mg/L) and then subjected to ultrasonic agitation and stirring (in the dark) for 15 min, and 1 h; respectively. The doped and un-doped samples were kept independently under a UV cabinet having a UV source power of 0.75 μW/cm2 and λ = 365 nm. The catalyst loaded dye solution was irradiated for 15, 30, 45, and 60 min and later subjected to centrifugation (∼5000 rpm) to separate out residue and supernatant free from the catalyst. To examine the product, 5 mL of the test specimen was taken for the optical absorption study knowing that the MO solution, without a catalyst, gives an absorption peak (C 0) at 464 nm.Reference Liao, Que, Jia, He, Zhang and Zhong20, Reference Choudhury, Borah and Choudhury21 The decrease in concentration (or degradation) of MO from its initial value was analyzed from the suppressed nature of the absorption peak maxima (C t) of the UV-exposed specimen.
III. RESULTS AND DISCUSSION
The crystallographic, morphological, optoelectronic and photocatalytic responses of the synthesized titania nanostructured systems are as discussed below.
A. Structure, phase, and morphological analysis
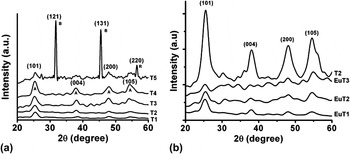
Figure 1(a) depicts a set of XRD patterns of the un-doped TiO2 nanopowder samples synthesized at different annealing temperatures of 200, 300, 400, 500, and 600 °C which are labeled as T1, T2, T3, T4, and T5; respectively. As can be noticed for samples T1 to T4, the diffraction peaks (101), (004), (200), and (105) correspond primarily to the tetragonal anatase phase of TiO2 (a = b = 3.785 Å, c = 9.514 Å; space group: D 194h).Reference Liao, Que, Jia, He, Zhang and Zhong20 But T5 sample exhibited a mixed phase of tetragonal anatase, rutile (a = b = 4.593 Å, c = 2.959 Å; space group: D 144h) and orthorhombic brookite (a = 5.143 Å, b = 5.456 Å, c = 9.182 Å; space group: D 152h).Reference Jaćimović, Vâju, Gaál, Magrez, Berger and Forró22 For T5 case, in addition to the (101) diffraction peak corresponding to the anatase phase, there exist three prominent peaks emanating from (121) and (131) planes of brookite and (220) of rutile phases and are consistent to others work reported elsewhere (JCPDS 36-1451).Reference Coronado, Gattorno, Espinosa-Pesqueira, Cab, de Coss and Oskam23 A significant phase transformation is thus realized at a comparatively higher annealing temperature (600 °C) with the intense diffraction signal at 2θ ∼ 31.38° which corresponded to (121) crystal plane of the brookite phase.
XRD patterns of (a) un-doped TiO2 nanopowders synthesized by annealing at different temperatures of 200 °C(T1), 300 °C(T2), 400 °C(T3), 500 °C(T4), and 600 °C(T5); (b) The corresponding diffractograms of un-doped (T2) and Eu-doped TiO2 samples with 1% (EuT1), 2.5%(EuT2), and 5%(EuT3) doping concentrations.

It was shown earlier that, the activation energy of nucleation has a size dependency along with the other parameters.Reference Zhang and Banfield24 Essentially, the anatase phase is thermodynamically stable for crystallite sizes smaller than ∼11 nm. Whereas, a stable brookite phase is evident for an average size in the range of 11–35 nm.Reference Zhang and Banfield24 Using the popular Williamson-Hall method,Reference Qadri, Skelton, Hsu, Dinsmore, Yang, Gray and Ratna25 the average crystallite size is estimated as ∼5, 5.6, 6, 9, and 23 nm for T1, T2, T3, T4, and T5 samples, respectively. The phase transformation (occurred for T5 sample) is also accompanied by an increment in the crystallite size, which is in agreement with the earlier works.Reference Zhang and Banfield26 The phase contents of the nano-TiO2 samples were calculated from the integrated intensities using the following formulaeReference Bakardjieva, Stengl, Szatmary, Subrt, Lukac, Murafa, Niznansky, Cizek, Jirkovsky and Petrova27:
 $$W_{\rm{b}} = K_{\rm{b}} A_{\rm{b}} /K_{\rm{a}} A_{\rm{a}} + {\rm{ }}A_{\rm{r}} + {\rm{ }}K_{\rm{b}} {\rm{ }}A_{\rm{b}}\quad ,$$
 $$W_{\rm{a}} = K_{\rm{a}} A_{\rm{a}} /K_{\rm{a}} A_{\rm{a}} + A_{\rm{r}} + K_{\rm{b}} A_{\rm{b}} \quad,$$
 $$W_{\rm{r}} = A_{\rm{r}} /K_{\rm{a}} A_{\rm{a}} + A_{\rm{r}} + K_{\rm{b}} A_{\rm{b}} \quad,$$
where W a and W b represent the respective weight fractions of anatase and brookite phases, and A b the integrated intensity of the brookite peak. The authors introduced the optimized correction coefficients K a and K b with values of 0.886 and 2.721, respectively.Reference Bakardjieva, Stengl, Szatmary, Subrt, Lukac, Murafa, Niznansky, Cizek, Jirkovsky and Petrova27 The wt% of different phases of T5 sample was calculated to be 73.68, 14.89, and 11.43% for brookite, rutile, and anatase phases, respectively. The diffractograms of un-doped (T2) and Eu-doped (EuT1, EuT2, and EuT3 synthesized from independent precursors of 1, 2.5, and 5% of Eu) nano-titania samples have exclusively revealed the existence of TiO2 anatase phase [Fig. 1(b)]. Previously, a dominant anatase phase was also observed in the case of Ag-doped TiO2 particles obtained from a rapid quenching technique.Reference Paul, Patowary, Pegu and Mohanta28 Since the anatase phase is superior to other phases of TiO2 in terms of photocatalytic response,Reference Diebold19 we took interest in obtaining the anatase phase. As the diffraction peak positions remained intact for un-doped and Eu-doped TiO2 nanopowder samples, it is possible that Eu3+ has undergone substitutional doping into the titania host lattice. As can be found, the intensity of the diffraction peaks gets suppressed with the increase in dopant concentration thus signifying loss of crystallinity due to lattice distortion.Reference Pal, Pal, Jiménez and Pérez-Rodríguez29 The average crystallite size was calculated to be 5.6, 5, 4, 3.4 nm for T2, EuT1, EuT2, and EuT3, respectively. An apparent suppression of the diffraction signal with the increase in Eu content indicates increased micro-strain in the lattice.
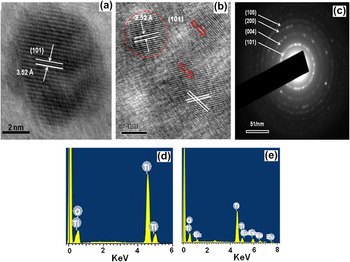
Both un-doped and doped TiO2 nanoscale specimens were also viewed under the electron microscope (HRTEM) and the micrographs are presented in Fig. 2. As revealed from the micrograph, the un-doped system is comprising apparently spherical particles of ∼7 nm size [Fig. 2(a)]. The system was believed to be highly crystalline owing to the existence of distinct lattice fringes and having an interplanar spacing of ∼3.52 Å [Fig. 2(a)]. The predicted value of the interplanar distance corresponds to the spacing between the consecutive (101) crystal planes of the tetragonal anatase phase of the TiO2 system, which is also evident from one of the major diffraction peaks of the XRD pattern. The HRTEM image of EuT2 specimen, shown in Fig. 2(b), depicts a number of crystalline particles with well-resolved crystal planes. A dotted red circle signifies a ∼7 nm sized particle with an interplanar spacing of ∼3.52 Å. A number of nanoscale defects were also evident from the closer look of the micrograph. Several vacancies, missing planes as well as edge-dislocations are denoted by open-red arrows. Although different defects might have their own origin but the chief reason is the difference in ionic radii of Ti and Eu (ionic radii: Ti4+ = 64 pm and Eu3+ = 94 pm). It may be noted that a particle may comprise several crystallites and that the crystallite and particle sizes are generally not the same in polycrystalline systems. That is why we observed a difference in the average size predicted through XRD and TEM analysis. The selected area electron diffraction (SAED) pattern of EuT2 sample is shown in Fig. 2(c). Though the diffraction rings are distinguishable they are not sharp owing to the introduction of appreciable amount of polycrystallinity. The rings were indexed as (101), (004), (200), and (105) and are concomitant with the XRD patterns [Fig. 1(b)].Reference Liao, Que, Jia, He, Zhang and Zhong20 The compositional analysis was performed by EDX studies. The EDX pattern of T2 specimen is characterized by strong diffraction signals arising from Ti and O elements [Fig. 2(d)]. In contrast, for EuT1 specimen, in addition to Ti, O, the signal from Eu is also clearly observable [Fig. 2(e)].
HRTEM image of synthesized TiO2 nanopowders: (a) un-doped (T2), (b) doped (EuT2) nano-titania samples, (c) The corresponding SAED pattern of EuT2 sample. The EDX spectra highlighting constituent elements present in the samples of (d) T2 and (e) EuT2.

B. Optical and optoelectronic characteristics
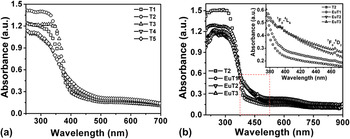
The UV-visible absorption spectroscopy is an important tool to study carrier transition aspects of dopants in the host. Figure 3(a) shows the UV-visible absorption spectra of T1-T5 titania nanopowder samples. As can be seen from the spectra, the absorption edge of the samples prepared at a higher annealing temperature is broadened and extending upto the visible region. The feature is more prominent in the case of T5 sample, which comprised of the mixed phase, with a proportionately large amount of the brookite phase and a small amount of anatase and rutile contents.Reference Tseng, Kuo, Huang, Li, Chou, Cheng and Wong30
UV-Vis absorption spectra of (a) un-doped (T1 to T5) and (b) Eu-doped TiO2 (EuT1, EuT2, and EuT3) samples. For comparison sake, response of T2 is also depicted in (b). The inset of (b) shows important electronic transitions of Eu.

The absorption spectra of Eu-doped TiO2 samples with different Eu concentrations are presented in Fig. 3(b). There exists a broad absorption edge in the visible region, for all the cases (EuT1, EuT2, and EuT3). For the un-doped sample, the sharp absorption edge was found to be located at ∼380 nm. The extent of broadening in the spectra increases with increasing Eu concentration. The optical band gap, as predicted from the Tauc’s plotReference Murphy31 (not shown), shows a decreasing trend with respective values of 3.2, 3.16, 3.06, 2.93 eV for T2, EuT1, EuT2, and EuT3 samples, respectively. The variation in the optical band edge could occur due to the incorporation of localized impurity states owing to Eu3+ doping. Apart from the band edge absorption, we noticed two distinct absorption peaks (for doped samples of EuT1, EuT2, and EuT3) corresponding to 7F 0→5L 6 and 7F 0→5D 2 excitations which were positioned at ∼394 and 464 nm, respectively.Reference Singh and Karmakar32 However, such transitions did not exist for the un-doped sample (T2).
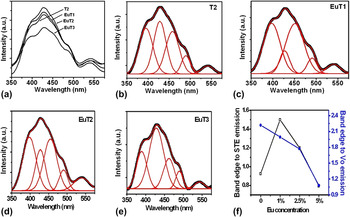
The interaction of photons with matter can also be visualized from the light emission characteristics through PL spectroscopy. The radiative/nonradiative nature along with the intra- and inter-band transitions can be explored from the PL measurements. Figure 4(a) illustrates the room temperature PL spectra of the un-doped and Eu3+ doped TiO2 systems excited at a wave length of 300 nm. The asymmetrically broadened features have indicated that, the overall spectrum, in each case, is due to the superimposition of independent peaks of different origin. To infer a clear idea about the peak positions, we have introduced the normalized Gaussian fitting on each of the experimental curve and the results are presented in Figs. 4(b)–4(e). Essentially, five peaks could be extracted which are located at ∼392, 430, 460, 490, and 540 nm. As a general trend, all the spectra exhibited a strong UV emission peak (∼392 nm) due to phonon assisted indirect transition from the edge (X) to the zone center (Γ) of the Brillouin zone, i.e., X1b to Γ3. As predicted earlier, the emission band at ∼430 nm is assigned to the intrinsic self-trap excitons (STE) localized on TiO6 octrahedra.Reference Lei, Zhang, Meng, Li, Zhang, Liang, Chen and Wang33 The peaks at ∼460 and 540 nm are due to color centers associated with the oxygen vacancy of two-trap electron (F center) and single-trap electron (F+ center), respectively.Reference Li, Haneda, Labhsetwar, Hishita and Ohashi34 The peak positioned at ∼490 nm is ascribed to the charge transfer from Ti4+ to oxygen ions in the TiO6 octahedron associated with the oxygen vacancies.Reference Yu, Yu, Ho, Jiang and Zhang35 The variation of the intensity ratio of the band edge emission to the STE and oxygen defect-related emissions is highlighted in Fig. 4(f). For a sufficiently large Eu concentration, the number of ionized oxygen defects tends to increase, owing to the introduction of charge imbalance created by Ti4+ and Eu3+ ions. Consequently, charge compensation would influence the radiative emission events, without affecting phase transformation and crystal growth. However, RE-doping related higher order transitions (and hence, emission) originated via luminescent centers of Eu3+ ions were found to be absent.
(a) Room temperature PL spectra (λex = 300 nm) of un-doped and Eu-doped TiO2 nanopowders; (b–e) respective Gaussian fitted curves for T2, EuT1, EuT2, and EuT3 samples. The intensity ratio of NBE to STE and defect emission peaks versus Eu-content are shown in (f).

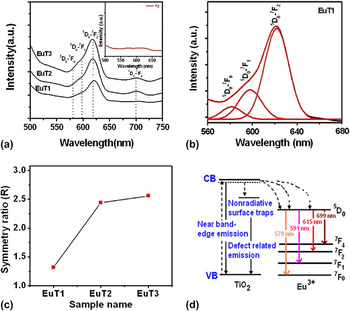
In Fig. 5(a), we demonstrate the room temperature PL spectra of the un-doped and Eu3+ doped TiO2 nanostructured systems excited at a wave length of ∼405 nm. Each of the spectra is characterized by four important peaks of Eu3+, which are located at ∼579, 591, 615, and 699 nm and corresponded to 5D 0→7F 0, 5D 0→7F 1, 5D 0→7F 2, and 5D 0→7F 4 transitions.Reference Singh and Karmakar32 Note that, the overall-intensity of the PL emission increases with the increase in Eu content of the host. The most striking feature was the enhancement of electrically allowed 5D 0→7F 2 transition, which is sensitive to the surrounding environment of Eu3+ ions, while magnetically allowed 5D 0→7F 1 transition is affected only weakly.Reference Tachikawa, Ishigaki, Li, Fujitsuka and Majima36 To uncover superimposed peaks, the PL spectrum of the EuT1 specimen was subjected to the normalized Gaussian fitting, as shown in Fig. 5(b). In reality, the relative intensity ratio (R) of 5D 0→7F 2 to 5D 0→7F 1 transitions would describe the breaking of centro-symmetry and degree of disorderness around the Eu3+ ions.Reference Tachikawa, Ishigaki, Li, Fujitsuka and Majima36 The R value follows an increasing trend with the increase in Eu- level with representative values as ∼1.32, 2.44, and 2.56 for EuT1, EuT2, and EuT3, respectively [Fig. 5(c)]. In other words, electrically driven transitions (5D 0→7F 2) are more favorable than spin-exchange mediated magnetically allowed ones (5D 0→7F 1). The R value has a saturation trend at a higher Eu3+ doping concentration.
All the possible radiative transitional events are highlighted in the scheme of Fig. 5(d). We invoke that the substitutional doping that leads to a local charge imbalance and facilitating thereby electrically driven transition is not an indefinite process. As the R value for both the EuT2 and EuT3 samples is greater than 2, this type of phosphor is highly desirable for LED applications and can be comparable with the other reported oxide phosphors.Reference Das, Reddy, Ahmad, Nagarajan and Prakash37
(a) Room temperature PL spectra (λex = 405 nm) of Eu-doped TiO2 nanopowders, (b) Gaussian fitted spectra of EuT2, and (c) The intensity ratio of 5D 0→7F 2 and 5D 0→7F 1 transitions with Eu-doping level.

C. BET surface area and pore size analysis
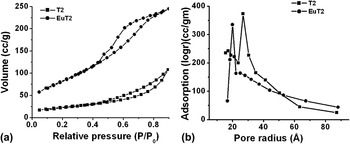
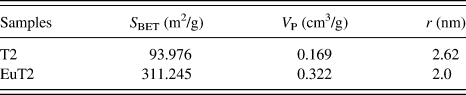
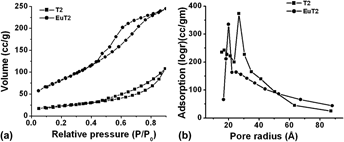
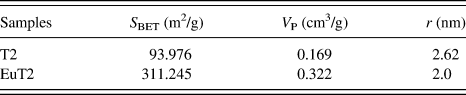
Figure 6(a) shows a set of N2 adsorption/desorption isotherms of un-doped (T2) and Eu-doped TiO2 (EuT2) nanostructured systems. The adsorption is rather slow up to a relative pressure of magnitude ∼0.5. Afterward, the isotherms exhibited a hysteresis pattern, in the relative pressure range of 0.5–0.9. The hysteresis loop is more steep and open for EuT2 specimen, as compared to the T2 one. In fact, a hysteretic feature is the indication of different adsorption and desorption rates of N2 molecules within the specimen under study. This is chiefly because of adequate pore-size distribution in the mesostructure region. From the pore-size distribution plot, shown in Fig. 6(b), the pore size (diameter = 2r) is estimated to be ∼5.2 and 4 nm for T2 and EuT2 samples, respectively. Owing to the larger ionic size, the introduction of Eu3+ into the host TiO2 lattice might have caused a higher space filling effect. Essentially, the pore filling (adsorption) is mediated through capillary condensation while pore emptying (desorption) occurs through the abrupt evaporation as per Kelvin’s expressionReference Zhang, Leung-Yuk Lam, Yan and Hu38: ln (P/P 0) + 2 γsV m/(rRT) = 0. Here, P and P 0 are the actual and saturated vapor pressures and γs is the surface tension of liquid N2. The parameters V m, r, R, and T representing molar volume, radius of the N2 droplet, the universal gas constant (8.31 SI units) and working temperature (77 K), respectively. Interestingly, the Brunauer-Emmett-Teller (BET) surface area was found to be 311.24 m2/g for the doped specimen (EuT2), which is about 3.3 times larger than that of the un-doped (T2) sample (93.98 m2/g) (Table I). It is possible that, smaller crystallite size of the EuT2 specimen (as revealed from XRD) may experience a larger surface area, as compared to the T2 specimen. Again, corresponding to the optimal pressure variation, the amount of nitrogen adsorption was found to get enhanced drastically from a value of 90.2 to 187.4 cc/g for EuT2 and T2 systems, respectively. In contrast, earlier we have observed adequate reduction in the BET surface area as well as molar volume due to PbS molecular adsorption in TiO2 pores.Reference Dutta, Mohanta and Choudhury39 In the present case, a substantial increase in the surface area (S BET) and the pore volume (V P), despite suppression of the pore size (r) in EuT2 specimen, is expected to be due to plentiful interfacial regions associated with the point defects and dislocations that were also evident in TEM studies. Consequently, a significant reduction in the N2 desorption rate can be found wrt the adsorption process, resulting in a more open hysteresis trend of the EuT2 specimen.
BET surface area analysis: (a) N2 adsorption/desorption isotherms and (b) Pore size distribution of T2 and EuT2 nanosystems.

Textural parameters of various samples obtained from the BET surface analysis.
D. Free radical generation and photocatalytic activity
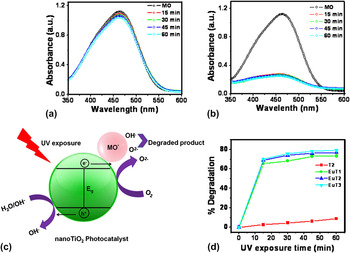
The photocatalytic activity of un-doped and Eu3+ doped TiO2 nanoparticles was studied considering MO dye as the targeting agent. The optical absorption response of MO targeted un-doped and doped samples, with and without UV-exposure, are depicted in Fig. 7. As shown in Fig. 7(a), in the presence of a catalyzing medium (un-doped TiO2), the absorbance of the MO-dye decreases only slowly with the UV-exposure time. In contrast, the absorbance gets suppressed by substantial amounts in the case of the use of Eu-doped TiO2 catalysts [Fig. 7(b)]. Essentially, upon UV light irradiation, the host TiO2 semiconductor releases electrons (e −CB) into the conduction band and holes (h +VB) to the valence band and the charge carriers can either be trapped as Ti3+ and O− defects or recombine to dissipate energy.Reference Testino, Bellobono, Buscaglia, Canevali, D'Arienzo, Polizzi, Scotti and Morazzoni40 Alternatively, the charge carriers can migrate to the catalyst surface and initiate redox reaction with adsorbed species (organic molecules) of the surrounding environment and convert into CO2 and H2O. The holes, upon trapped by the surface adsorbed H2O, release H+ and OH· radicals, which are regarded as extremely powerful oxidizing agents. The electrons in the conduction band are rapidly trapped by the surface adsorbed molecular oxygen and are reduced to O2−· radicals that may further react with H+ to generate ·OOH and H2O2.Reference Hoffman, Carraway and Hoffman41,Reference Mahdavi, Burton and Li42 The generation of free radicals by the photocatalyst is schematically shown in Fig. 7(c). The recombination events, however, could be obstructed by incorporation of new energy levels (due to the impurity ions) in the main energy band (of the titania host). TiO2 nanosystem being abundant with oxygen vacancies, the unoccupied energy states would act as photogenerated electron scavengers with the surface adsorbed OH group acting as the hole trap.Reference Li, Li, Hou, Cheah and Choy43 The oxygen vacancy centers can help transferring electrons to the adsorbed oxygen producing thereby superoxide radicals. During the process of photocatalytic reaction, oxygen vacancies and defects capture photogenerated electrons and consequently, recombination of e and h gets inhibited. Moreover, oxygen vacancies could promote the adsorption of O2 molecules and the photoinduced electrons bound to the oxygen vacancies could make easy adsorption of O2 while generating free radicals. Thus, oxygen vacancies and defects were in favor of photocatalytic reactions (provided that UV excitation energy is higher than the band gap of the TiO2 system) in the sense that, O2 is an active agent to promote the oxidation of organic substances.Reference Hoffman, Carraway and Hoffman41 In the photocatalytic degradation curve, shown in Fig. 7(d), it is quite evident that, the Eu-doped TiO2 specimen is about 10–12 times more efficient than the un-doped counterpart. The photocatalytic degradation experienced a saturation trend beyond 45 min of the UV-exposure. As can be seen from the absorption spectra, the absorption edge of the TiO2 nanosystem, upon Eu-doping, gets red-shifted owing to the band gap narrowing enabling enhanced photodegradation. The reason for the increased photodegradation efficiency is ascribed to the introduction of Eu3+ doping states, which helped inhibiting e-h pair recombination while enhancing interfacial charge transfer reaction.
UV-Vis absorption spectra of MO loaded (a) un-doped TiO2 (T2) and (b) Eu-doped TiO2 (EuT2) catalysts under UV irradiation; (c) a scheme of free radical generation upon UV exposure and MO degradation. The effective MO degradation by the photocatalyst is shown in (d).

As predicted earlier, the presence of intermediate trap centers such as, impurity states and defect states are capable of reducing the recombination time thus enhancing photocatalytic activity.Reference Xu, Chen, Yang, Li and Wang44 Being Eu-doped samples more effective under UV irradiation, the MO degradation activity of each of the samples increases rapidly [Fig. 7(d)]. But increasing the Eu doping concentration from 1 to 5% has showed only weak photocatalytic activity. From the above discussion, it is now apparent that, Eu-doped TiO2 nanoparticles are a better choice over the un-doped ones, owing to the effective free radical generation via participation of new energy levels and lower rate of e − and h + recombination that would facilitate photocatalytic reactions. With relatively small crystallite size and higher surface area, an enhanced photo response in the UV region could make the specimen a more efficient photocatalyst. Moreover, doped specimens would ensure improved photocatalysing power even for a short exposure time.
IV. CONCLUSIONS
The sol-gel assisted rapid condensation route was used to produce un-doped and Eu3+ doped nanoscale titania particles. The co-existence of the mixed phases (brookite, rutile, and anatase) was observed when the sample was prepared at higher annealing temperature. The overall PL spectra were found to be dominated by the emission due to self-trap exciton as well as oxygen defect related emissions. The Eu3+ related D–F transitions were revealed from the PL spectra acquired at a higher excitation wave length (λex = 405 nm). With the increase in Eu-doping level, the electrically driven transition was found to be dominant over magnetically driven ones. The nanopore size, owing to Eu-doping into titania host, gets reduced from a value of ∼5.2–4 nm while the BET surface area was enhanced by a factor of 3.3. Furthermore, Eu-doped TiO2 nanopowder showed an enhanced photocatalytic response wrt degradation of MO dye under the UV illumination. Further investigation is necessary to make out a quantitative correlation among the optoelectronic and photocatalytic performances based on appropriate energy level schemes.
ACKNOWLEDGMENTS
One of the authors (NP) acknowledges DST, New Delhi for providing fellowship through INSPIRE scheme. We thank SAIF, NEHU, Shillong for extending TEM facility. NP would like to thank Ms. Giti Das for her assistance during synthesis steps. The authors also thank Prof. R.C. Deka, Dr. G.A. Ahmed, and Ms. Rasna Devi for their help and support in BET surface analysis through N2 adsorption/desorption study. A part of the work was carried out through project no. UFR-50307/2011 supported by IUAC, New Delhi.