

Political science has a rich tradition of empirical work on women and gender in governmental institutions. Legislative studies, in particular, have benefited from the attention of scholars who have sought to “gender political institutions” by emphasizing the gendered aspects of the formal governmental arena.Footnote 1 These studies focus on questions around the substantive representation of women; the recruitment, promotion, and behavior of female representatives within legislatures; how to shift gendered institutional cultures; and whether and how best female representatives can access centers of power, accumulate institutional resources, and affect decisions on an equal basis once present in governmental institutions (see, e.g., Childs and Krook Reference Childs and Krook2006; Dahlerup Reference Dahlerup1988; Kanter Reference Kanter1977; Thomas Reference Thomas1994).
In common with much institutionalist work (e.g., Hall and Taylor Reference Hall and Taylor1996; Helmke and Levitsky Reference Helmke and Levitsky2004; March and Olsen Reference March and Olsen1984), feminist institutionalism emphasizes the sources of stability and continuity in politics and the functions of institutions in generating patterned, although not predictable, social behavior. Perhaps in distinction to other institutionalist strands, feminist institutionalism places special emphasis on gender, power, and informal institutions to explain how gendered power imbalances both shape and are reproduced by formal and informal institutions. The claim that (in)formal institutions can themselves possess and help reproduce gender biases is therefore central to the feminist institutionalist approach, which has sought to expose and explain these biases by, among other methods, “counting the places occupied by women and men, considering the differences in positions occupied by women and men, and identifying the continuum of masculinity and femininity associated with various positions and processes within the organisation and in the organisation as a whole” (Lovenduski Reference Lovenduski1998, 347; see also Rai and Johnson Reference Rai and Johnson2014). This article seeks to contribute to and develop such legislative studies and institutionalist literatures by assessing the different parliamentary career paths and policy specializations pursued by female and male members of Parliament (MPs) as expressed through the select committee system of the U.K. Parliament.
The select committee system presents a number of advantages in assessing gendered patterns of participation in comparison with other frequently used approaches,Footnote 2 such as the analysis of ministerial appointments or the simple presence of women in legislative chambers.Footnote 3 First, the committee system engages members from all parties in Parliament, not just the governing party. Second, the number of committee appointments far exceeds the number of ministerial appointments, providing a larger data set that is less prone to unreliable results on the basis of a small number of data points. Third, the variety of roles available through the committee system allows an analysis of the character and quality of female participation in the system beyond simple head counts of female representatives in Parliament. Fourth, in the U.K. context, the reformed House of Commons (HoC) select committee system since 2010 allows parliamentarians to propose themselves for committee roles rather than relying on the patronage of party managers or leaders. Whereas committee appointments prior to 2010 relied on the favor of party managers, the reforms now allow MPs to nominate themselves. This permits us to assess the impact, if any, of a shift from a system of patronage to a system of election on gendered patterns of participation.
Previous studies of women and ministerial or committee appointments in various jurisdictions have identified two types of gendered divisions of labor: horizontal and vertical. As Raaum explains, “The vertical division of labour is concerned with the position of men and women in political hierarchies, while the horizontal division of labour focuses on the various policy areas in which men and women work” (Reference Raaum, Karvonen and Selle1995, 29). In this article, we examine one dimension of the horizontal division of labor—portfolio allocation—and one dimension of the vertical division—low-status versus high-status select committees (SCs).
We proceed in two stages. First, we map gendered patterns of membership across committees and the SC system as a whole. Drawing in particular on Krook and O'Brien (Reference Krook and O'Brien2012), we test hypotheses concerning gendered patterns of membership across high-, medium- and low-status committees (the vertical division of labor) and those coded masculine, feminine, and neutral (the horizontal division of labor). Second, using ARIMA(X) interrupted time-series analyses, we analyze changes in the gendered division of labor over time. We test for the impact of the introduction of membership elections in 2010, as well as changes in the party of government, the proportion of female representatives in the legislature as a whole, and the sharp increase in female representatives after 1997 (when the proportion of female MPs nearly doubled, from 9.2% to 18.2%). Drawing in particular on the work of Heath, Schwindt-Bayer, and Taylor-Robinson (Reference Heath, Schwindt-Bayer and Taylor-Robinson2005) and O'Brien (Reference O'Brien2012), we test hypotheses concerning whether the introduction of elections was beneficial for female and male candidates standing for election as members of committees on which female and male MPs, respectively, had been traditionally underrepresented.
Our analysis identifies strong gendered patterns in the division of labor within the HoC, whereby female representatives participate differently than their male counterparts. With some notable exceptions, women are much more likely than men to be assigned to committees covering lower-status, feminized policy areas than men, and this gender coding of policy areas tends to remain stable over time. “Masculine” policy areas, which are often also the best-resourced and most powerful, almost always remain the province of male parliamentarians, while female parliamentarians tend to be integrated largely into already “feminized” policy areas. Since these feminized policy areas also tend to be those that are less prestigious (although not less important) and control fewer resources, the impact of a greater female presence in Parliament is diluted. In several high-status, masculinized policy areas, policy continues to be made and scrutinized with minimal involvement from female parliamentarians; this has (potential) ramifications for the substantive representation of women and the quality and effectiveness of committee work. We also find that increases—including sharp increases—in the proportion of female MPs, the presence of a Labour government, and membership elections do not systematically lead to more proportionate committees; indeed, in some cases, they exacerbate gendered membership patterns of individual committees. This raises questions about reforms necessary to disrupt the gendered division of labor and the sorting of male and female representatives into these gendered patterns of participation.
The contribution of our article, then, lies (1) in its focus on the committee system of the U.K. HoC; (2) in the size of its data set (the analysis includes every SC appointment from the creation of the modern SC system in 1979 until 2016); (3) in its ability to test the impact of changes over time, including major changes to the appointment system, as well as a number of other variables often associated with changes in patterns of behavior among female representatives; and (4) in the development of a 7-point scale of the “femaleness” and “maleness” of committees that allows for comparisons across countries and legislatures. The importance of the article is its ability to demonstrate that several factors thought to be associated with an equalization of the gendered division of labor—such as changes to the system of appointment, a rising female contingent in Parliament, and the presence of a left-of-center party in government—in fact produce no clear effect. This suggests that at least some proposed solutions to the problem of gendered divisions of labor may need to be reconsidered.
The article has six further sections. First, we provide an overview of SCs in the U.K. Parliament and recent reforms to them. Second, we review the literature on gender, parliaments, and parliamentary committees from which our hypotheses are derived. In the third section, we describe our data set and methods before outlining and discussing our findings in the fourth and fifth sections, respectively. The sixth section contains our conclusion.
THE U.K. SELECT COMMITTEE SYSTEM AND THE 2010 WRIGHT REFORMS
The modern SC system, as established in 1979 and remaining largely in place until the present, is composed of a number of different types of committee. The main categories of SCs are departmental committees, nondepartmental scrutiny committees, and domestic/administrative committees. Departmental committees have oversight of the finances, policy, and administration of government departments and their associated public bodies. For example, the Health Committee is responsible for examining government health policy and the activities of arm's-length bodies such as Public Health England and the Human Fertilisation and Embryology Authority. Nondepartmental scrutiny committees—such as the Public Accounts Committee—scrutinize particular areas of activity, such as public expenditure, that are relevant across government and not specific to any one department. Domestic and administrative committees are those that have a remit to scrutinize the internal operations of the HoC (such as the Procedure and Backbench Business Committees). All committees can establish subcommittees if members so wish. The governing party holds a majority on all committees, with chairships allocated to parties largely through negotiation among party managers with the exception of some committee chairs allocated to government or opposition by convention (e.g., the Treasury Committee is always chaired by an MP from the governing party) or by a formal standing order (e.g., the Public Accounts and Backbench Business Committees, which both must be chaired by a member of the main opposition party). The number of departmental SCs rose from 14 in 1979 to 20 at the end of the 2015–16 parliamentary session, and the overall number of committees rose from 33 to 44 (with a low of 26 in the late 1980s and a high of 50 during 2009–10).
The system for selecting committee members and chairs was revised in 2010 as a consequence of the reforms recommended by the Committee on Reform of the House of Commons (known as the Wright Committee after its chair, Labour MP Tony Wright). Whereas all appointments to SCs previously were arranged through “the usual channels” (in practice, through negotiation among the main party whips) and chairs were selected by committees from among this party-approved membership, the new system gave far less power over appointments to party managers. Since 2010, committee chairs have been elected by the whole membership of the HoC, with other members determined by the outcome of votes within party caucuses.
The parliamentary committee system has historically been regarded as rather marginal to the chamber-focused British legislative system, lacking many of the powers held by committee structures in other jurisdictions (Strøm Reference Strøm, Strøm, Müller and Bergman2003). Yet more recently, scholars, politicians, and commentators have come to see SCs as increasingly important and influential. This is partly a consequence of the Wright reforms, which aimed to empower the HoC committee system and, as in the title of one Liaison Committee report (2000), “shift the balance” between an often power-hoarding executive and the legislature.Footnote 4
THE GENDERED DIVISION OF LABOR ON PARLIAMENTARY COMMITTEES
Analyses of committee assignments in other jurisdictions have found evidence of both vertical and horizontal patterns of gendered division of labor. A vertical division of labor occurs when there is patterned participation in committees according to the status of members. A horizontal division of labor occurs when women participate disproportionately in committees covering portfolios that code “feminine” and, correspondingly, are underrepresented in committees covering portfolios that code “masculine.” The literature has found evidence from jurisdictions other than the United Kingdom of gendered divisions of labor, both horizontal and vertical, with women being both more likely to be appointed to more “feminine” and lower-status committees and to be appointed to less powerful roles within committees.Footnote 5 These findings generally hold even when women participate in the committee system at similar overall levels to men, or to the level of female representation in the wider legislature, with women still more likely to be assigned to low-status committees with lower budgets, less competition for places, and lower policy priority. These findings are consistent across many arenas with quite different political institutions and cultures.
Although these studies consistently identify gendered divisions of labor, they use different methods for constructing measures of committee status necessary to identify a vertical division of labor and schemas for classifying committees according to their “masculine” or “feminine” characteristics necessary to identify the horizontal division of labor. As Pansardi and Vercesi (Reference Pansardi and Vercesi2017) argue, the distinction between committee gender and status is often not made clear, with the implicit assumption being that “masculine” committees—however defined—are the most prestigious, a claim that elides horizontal with vertical aspects of gendered division of labor.
With regard to the horizontal dimension, while distinctions between more “masculine” and “feminine” policy areas make intuitive sense and are part of the political vernacular (see, e.g., Simons Reference Simons2013), it is not a simple task to operationalize these concepts in a way that makes systematic analysis possible. Some authors draw the distinction very narrowly, defining a separate category of “women's issues” such as workplace equality, domestic violence, or children/family bills (e.g., Escobar-Lemmon, Schwindt-Bayer, and Taylor-Robinson Reference Escobar-Lemmon, Schwindt-Bayer, Taylor-Robinson, Escobar-Lemmon and Taylor-Robinson2014). This provides a clear dividing line by which to assess the extent of horizontal differentiation. The difficulty with such an approach is that in drawing the boundaries so narrowly, most committee activity is excluded. In the U.K. Parliament, for example, such an approach would reduce most of the analysis to a single, very recently established committee, the Women and Equalities Committee, which is charged with oversight and scrutiny of “women's issues.”
An alternative approach to classifying policy portfolios draws on feminist literatures that emphasize the connection between notions of femininity and the social function of caring. On this reading, those areas of policy work that are primarily concerned with caring, or social and ethical considerations, will code feminine, whereas those concerned with protection and security will code masculine. Bolzendahl (Reference Bolzendahl2014) expresses the distinction in similar terms, describing those policy areas concerned with “people” as coding more feminine and those concerned with “things” as more masculine. The distinction can also be expressed as one between “hard”/“soft” or “high”/“low” policy areas; or between those concerned primarily with the public sphere (work, economics, international relations) and those concerned with the private sphere (household, family, domestic) (see, e.g., Barnes and O'Brien Reference Barnes and O'Brien2018; Elshtain Reference Elshtain1981; Escobar-Lemmon and Taylor-Robinson Reference Escobar-Lemmon and Taylor-Robinson2016; Krook and O'Brien Reference Krook and O'Brien2012). In this vein, this article adopts the framework developed by Krook and O'Brien (Reference Krook and O'Brien2012), which was derived from the work of Escobar-Lemmon and Taylor-Robinson (Reference Escobar-Lemmon and Taylor-Robinson2005) (see also Pansardi and Vercesi Reference Pansardi and Vercesi2017). This framework clearly separates the status dimension from the gender dimension of policy portfolios and thus offers a sound analytical basis for determining the degree of the gendered division of labor within and between parliamentary committees.
In relation to the horizontal dimension, Krook and O'Brien (Reference Krook and O'Brien2012) code departments as masculine, feminine, or neutral based on categories derived from feminist theory concerning the historical association and public/private location of particular fields of governmental activity. In relation to the vertical dimension, they differentiate portfolio status with regard to measures of visibility, control of resources, and policy influence (Krook and O'Brien Reference Krook and O'Brien2012, 844). The high-status category contains those portfolios with high visibility and significant financial resources; the medium-status category contains those with lower visibility but significant financial resources; and the low-status category is occupied by portfolios covering those areas with low visibility and low resources for patronage.
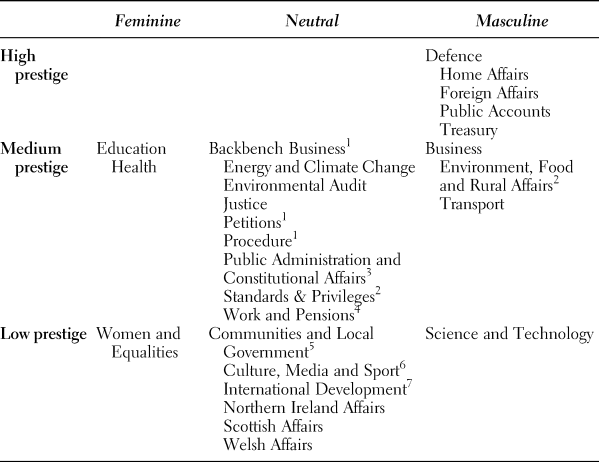
The Krook-O'Brien classification is used in their study to assess executive departments and so cannot be mapped directly onto the U.K. SC system, which is a feature of the legislature. However, it provides an excellent foundation for classifying the areas of scrutiny and legislative work that hold the greatest/least status and code masculine/feminine. Adapting Krook and O'Brien's approach to the U.K. SC system produces the classifications of committees in terms of status and gender, as outlined in Table 1. The committees are coded conservatively, in that when the status or gender character of a committee is mixed or ambiguous according to the Krook-O'Brien classification, it is classified as neutral, even when a strong intuitive case could be made for a different classification (e.g., in the case of International Development, which has elements that would justify a feminine coding but cannot be unambiguously classified as such with a strict application of the Krook-O'Brien criteria).
Select committees by gender category and level of prestige

1 All of these committees fall under the heading of Parliamentary Affairs, which Krook and O'Brien classify as neutral and medium prestige. Backbench Business is missing data for 2015–16 because it did not publish minutes for that year.
2 We have coded the Environment, Food and Rural Affairs Committee masculine overall because, while the environmental element is classified as neutral, it also comprises agriculture, food safety, fisheries, and livestock elements, which are classified as masculine, and much of the environmental brief is covered by Energy and Climate Change.
3 Public Administration and Constitutional Reform contains a civil service element, which is coded medium prestige, and a reform element, which is coded low prestige. We have coded this committee medium prestige because there has always been a committee focusing on the civil service since 1979, whereas this is not the case for constitutional reform.
4 We have coded the Work and Pensions Committee neutral overall because it comprises a labor element that is classified as masculine and a social welfare element that is classified as feminine.
5 Although Communities and Local Government contains a housing and planning element, which is classified as medium prestige, the local/regional element, which is classified as low prestige, is the main focus of the committee, and thus we have classified it as low prestige overall.
6 We have coded the Culture, Media and Sport neutral overall because it comprises a communication and information element that is classified as masculine, sports and tourism elements that are classified as neutral, and culture and heritage elements that are classified as feminine.
7 Krook and O'Brien do not include a corresponding category to International Development. A case could be made that it ought to be included under the feminine coding as it represents a division in the traditional Foreign and Commonwealth Office brief between the more “masculine,” traditional high politics understanding of foreign affairs as international diplomacy and the more “feminine,” people-oriented development aspects of international relations focused on aid, development, and conflict resolution. However, given that this distinction is not drawn in the taxonomies we use, we choose to code International Development as neutral in gender terms and low in prestige terms (because of its small budget).
Drawing on the foregoing discussion, we hypothesize the following with regard to the horizontal and vertical gendered division of labor in the U.K. SC system:
H1: Female MPs are less likely to be members of select committees coded masculine and high status and more likely to be members of those coded feminine and low status.
As mentioned earlier, the method for choosing SC chairs and members changed in 2010 from one of patronage to one of election. Some work on the impact of (changes in) committee appointment processes on gendered divisions of labor has already been undertaken. Heath, Schwindt-Bayer, and Taylor-Robinson (Reference Heath, Schwindt-Bayer and Taylor-Robinson2005), in their analysis of the Latin American context, found that floor votes to determine assignments were more favorable to women than allocation by party leaders, suggesting that the position of women within legislatures may be strengthened when access to power comes not from elites but from alliances forged with fellow parliamentarians. In the U.K. context, O'Brien (Reference O'Brien2012) focuses on another aspect of the vertical division of labor—that of seniority within committees—by focusing on SC chairs. Her analysis of the 2010 SC chair election results found that the introduction of elections produced an advantage for female candidates compared to the previous system.
Drawing on this work, our second hypothesis is as follows:
H2: The introduction of membership elections in 2010 was beneficial for female and male candidates standing for election as members of select committees on which male and female MPs, respectively, had been traditionally overrepresented.
Testing this hypothesis using the techniques described later also allows us to model for the possible effects of five other variables: whether the session was at (1) the start or (2) the end of a Parliament; whether (3) the Labour Party was in government; whether it was (4) the parliamentary session 1997–98, during which there was a relatively large influx of female MPs after Labour's election win; and (5) the proportion of female MPs in the HoC. The first two variables concerning parliamentary cycles derive from earlier research indicating that these factors could be important in explaining changes in SC membership (Wilson Reference Wilson2017a, Reference Wilson2017b). The last three variables derive from literature concerning the relationship between the descriptive and substantive representation of women and how (sharp) increases in female representatives and changes in government may lead to different patterns of behavior and participation within legislatures and executives.Footnote 6
DATA AND METHODS
To test the hypotheses, we use data drawn from the House of Commons Sessional Returns and, before 1986–87, Select Committee Returns for each of the 36 parliamentary sessions from 1979–80 through 2015–16. Sessional Returns are official HoC publications that provide information about the HoC and its committees.
This Sessional Returns data set covers 256 different committees and contains 19,518 discrete data points recording each member of each committee for each parliamentary session. This data set was then combined with another that recorded the party, gender, constituency, and other personal information of every MP who has sat in the HoC post-1979 (see Goodwin, Holden Bates, and McKay Reference Goodwin, Bates and McKay2019). For this research, we focus on one particular subset of the data: all SCs affected by the Wright reforms (n = 53) and their members over the period 1979–2016 (n = 9,767). These committees cover all departmental SCs as well as other key administrative or nondepartmental scrutiny committees, as set out in Table 1.
In addition to the descriptive statistics used to map the gendered nature of committee membership, female participation on SCs was modeled using an interrupted time-series design to test for the effects of reforms to the committee system in 2010. This method is quasi-experimental in that it seeks to examine the effects of a particular structural break in a time-series where the point in time at which this break occurs is known. In this case, the structural break occurs at the beginning of the 2010–12 parliamentary session, when the Wright reforms introducing elections for SC members and chairs were first implemented. The introduction of the Wright reforms serves as the “treatment” or “intervention.” The model tests for changes in the time-series pre- and post-treatment. This design was used to test H 2 concerning whether the 2010 reforms increased the proportions of female members of traditional masculine committees and decreased the proportion of female members of traditional feminine committees, which would be demonstrated by a change in the intercept or slope after the structural break in 2010.
The analysis uses the ARIMA (autoregressive integrated moving average) multivariate dynamic model, which can include lags on the dependent variable (the autoregressive element—in this case, the proportion of female members/chairs on SCs) or on the errors (the moving average element—to model shocks that endure for only a set period). Using ARIMA, the data can also be “differenced” to flatten the effect of upward or downward trending (nonstationary) time-series data to examine changes in the slope or intercept following a structural break. The overall purpose of the ARIMA model is to take into account the fact that the proportion of female members serving on SCs at any given time is, in part, a function of the proportion of female members serving at earlier points in time (e.g., the number of women on a SC this year is correlated with the number of women on the same committee last year). The model can also incorporate other exogenous control variables (producing an ARIMAX model).
The dependent variables for the main elements of this study were: (1) the proportion of committee sessions where the proportion of female members fell within the 95% confidence bounds of the average for all of the committees studied; (2) the average absolute divergence of committee membership from the 95% confidence bounds for female membership; and (3) the percentage of female members of individual SCs.Footnote 7 The time series we used started with the 1979–80 session and ended with 2015–16 for all analyses except those concerning committees that were established at a later point (e.g., the time-series for the Justice Committee started in 2007 when the Department of Justice and its corresponding committee were formedFootnote 8). To extend the modeling, we included five additional independent variables, as described earlier. As with all interrupted time-series analyses, our causal hypothesis was that observations after the intervention (i.e., after the introduction of the Wright reforms) will have a different intercept and/or slope, albeit possibly temporarily, from those before the intervention.
FINDINGS
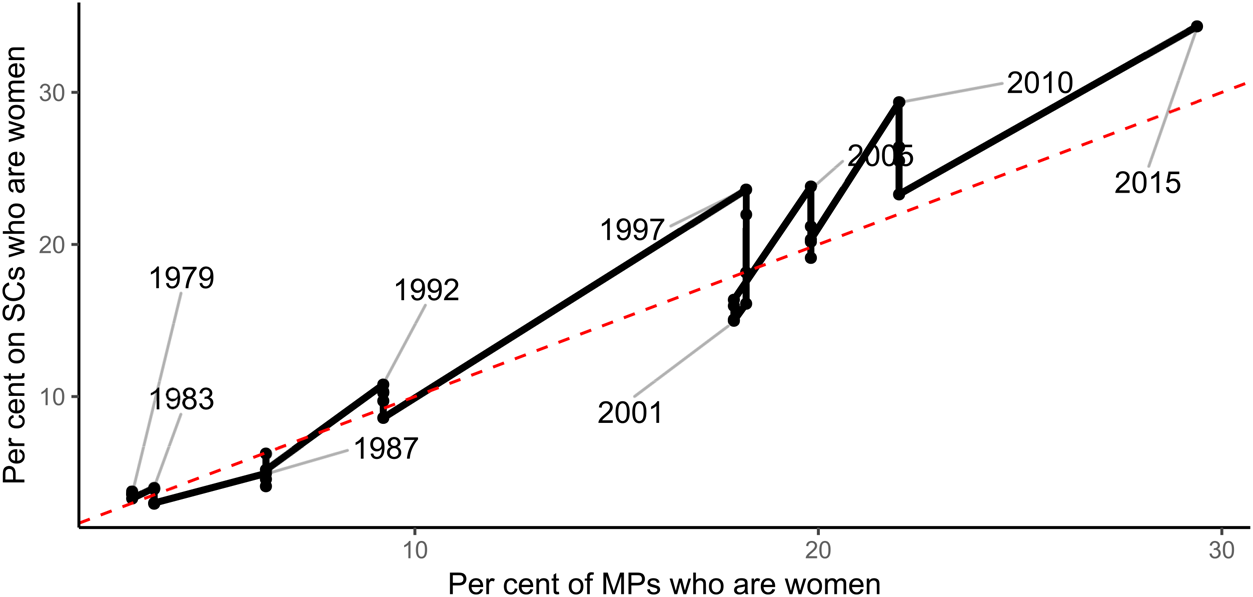
Taking all SCs affected by the Wright reforms, the overall pattern of participation shows that the proportion of women serving on these committees rises as a function of the increasing proportion of women in Parliament across the period (see Figure 1). While there are some parliamentary sessions during which female MPs are overrepresented as members on Wright SCs in relation to their presence in the HoC, there are also some sessions during which they are underrepresented. Over the whole period, female MPs are overrepresented on committees relative to the proportion of female MPs in the HoC as a whole, but only by an average of 0.7 percentage points. Therefore, they are neither systematically or disproportionately excluded from, nor disproportionately included in, the SC system; rather, in the aggregate, female participation in the system broadly reflects the overall gender balance of Parliament across the period of analysis (corroborating O'Brien's finding on this point [Reference O'Brien2012, 194–95]). The question, then, is how, rather than whether, women participate in the system.
Proportion of female MPs and female members of Wright select committees, 1979–2016.

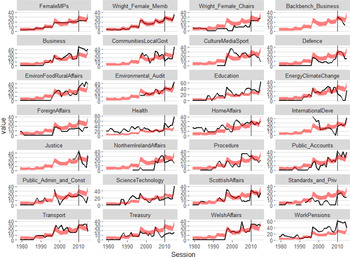
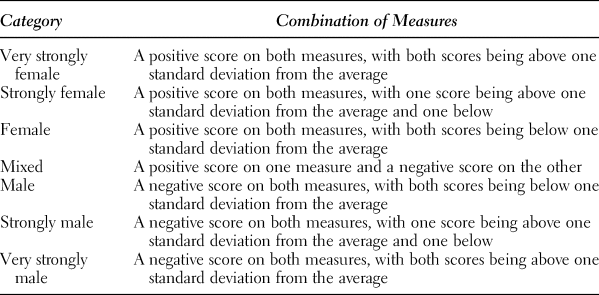
With respect to membership portfolio allocation (H 1), our findings suggest that there is evidence of a gendered division of labor within the SC system, with some committees being persistently “female” or “male”—that is, having a disproportionate number of male or female members over time. Figure 2 shows the percentage of female members by parliamentary session for each SC (and their forerunners), along with the 95% confidence bounds for female membership of those SCs affected by the Wright reforms during each parliamentary session (denoted by the shaded area). Each SC was categorized as strongly female, female, male, or strongly male, depending on whether they were more or less than one standard deviation away from the average of two measures: (1) the proportion of parliamentary sessions in which female membership was above the upper 95% confidence boundFootnote 9 minus the proportion of parliamentary sessions below the lower 95% confidence boundFootnote 10; and (2) the average absolute distance from the upper or lower confidence bound for each SC.Footnote 11 For each measure, a positive score indicates a disproportionately female committee on that measure, and a negative score indicates a disproportionately male committee. These categories across these two measures were then combined to produce a 7-point scale to rank each committee on the femaleness or maleness of its membership over the time period (see Table 2). The results of each measure and how we mapped the committees across these two measures can be seen in Figures A1–A2 and Table A2, which are available at https://doi.org/10.6084/m9.figshare.9824453.v1 Footnote 12.
Percentage of female MPs or female members of Wright select committees, 1979–2016 (with confidence bounds shaded and 2010 Wright reform intervention marked).

7-Point scale of femaleness/maleness of select committee membership

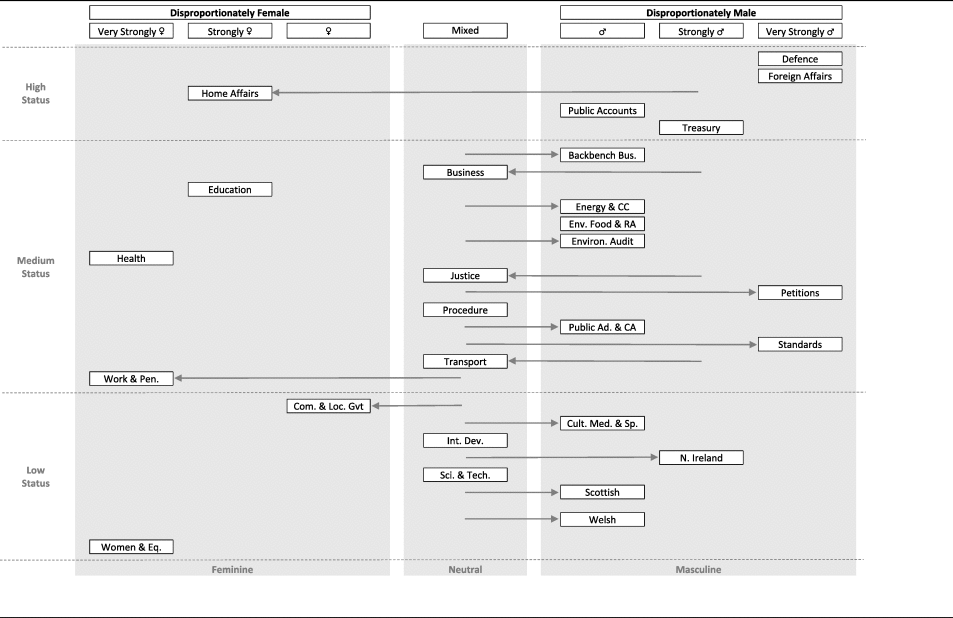
As Table 3 illustrates, a majority of SCs are disproportionately female or male in terms of their membership over the time period. Membership skews very strongly female on the Health; Women and Equalities; and Work and Pensions Committees; strongly female on the Education and Home Affairs Committees; and female on the Communities and Local Government Committee. Membership skews very strongly male on the Defence; Foreign Affairs; Petitions; and Standards and Privileges Committees; strongly male on the Northern Ireland Affairs and Treasury Committees; and male on the Backbench Business; Culture, Media and Sport; Energy and Climate Change; Environment, Food and Rural Affairs; Environmental Audit; Public Accounts; Public Administration and Constitutional Affairs; Scottish Affairs; and Welsh Affairs Committees. All other committees are classified as mixed.
Femaleness and maleness of select committees (arrows indicate movement away from shaded Krook-O'Brien classifications)

Some of these results are complicated by the (relatively) short time that some of the committees have been in existence. Women and Equalities and Petitions were only formed in 2015 and thus have only one data point in our analysis; Backbench Business was formed in 2010, and there are only four data points in our analysis; Justice was formed in 2007, and thus there are only eight data points in our analysis. Communities and Local Government was formed in 1997, and while more than 50% of sessions are above the upper confidence limit, there is also a sizable minority of sessions below the lower confidence limit. There are also clear gendered periodizations for other committees, which the overall picture masks. For example, over the whole period of study, Welsh Affairs is classified as male, but this is all driven by its composition before 1997. There were no female MPs on the Welsh Affairs Committee until 1997; since then, the committee has never had a disproportionate number of male members for any parliamentary session. Similarly, Public Accounts is again classified as male overall, but since 2005, there have been no parliamentary sessions in which the committee has been disproportionately male.
However, there are also certain committees on which female MPs are consistently over or underrepresented across the whole period of study. Committee membership of the Health, Home Affairs, Education, and Work and Pensions Committees are disproportionately female throughout; for Defence, Foreign Affairs, Northern Ireland Affairs, Treasury, and Standards and Privileges, the committees are disproportionately male. These committees mainly correspond to the types of committees and policy areas in which women most and least frequently work, as discovered by other studies. The results also show that female committee membership tends to be highly concentrated within a small number of committees. Female MPs’ participation is not distributed evenly across the system but is clustered within a few committees, which often carry a feminine coding within the Krook-O'Brien schema. As shown in Table 3, the most notable deviation from the gender-status pattern hypothesized earlier is in Home Affairs, within which the membership skews strongly female although it is coded masculine/high status.
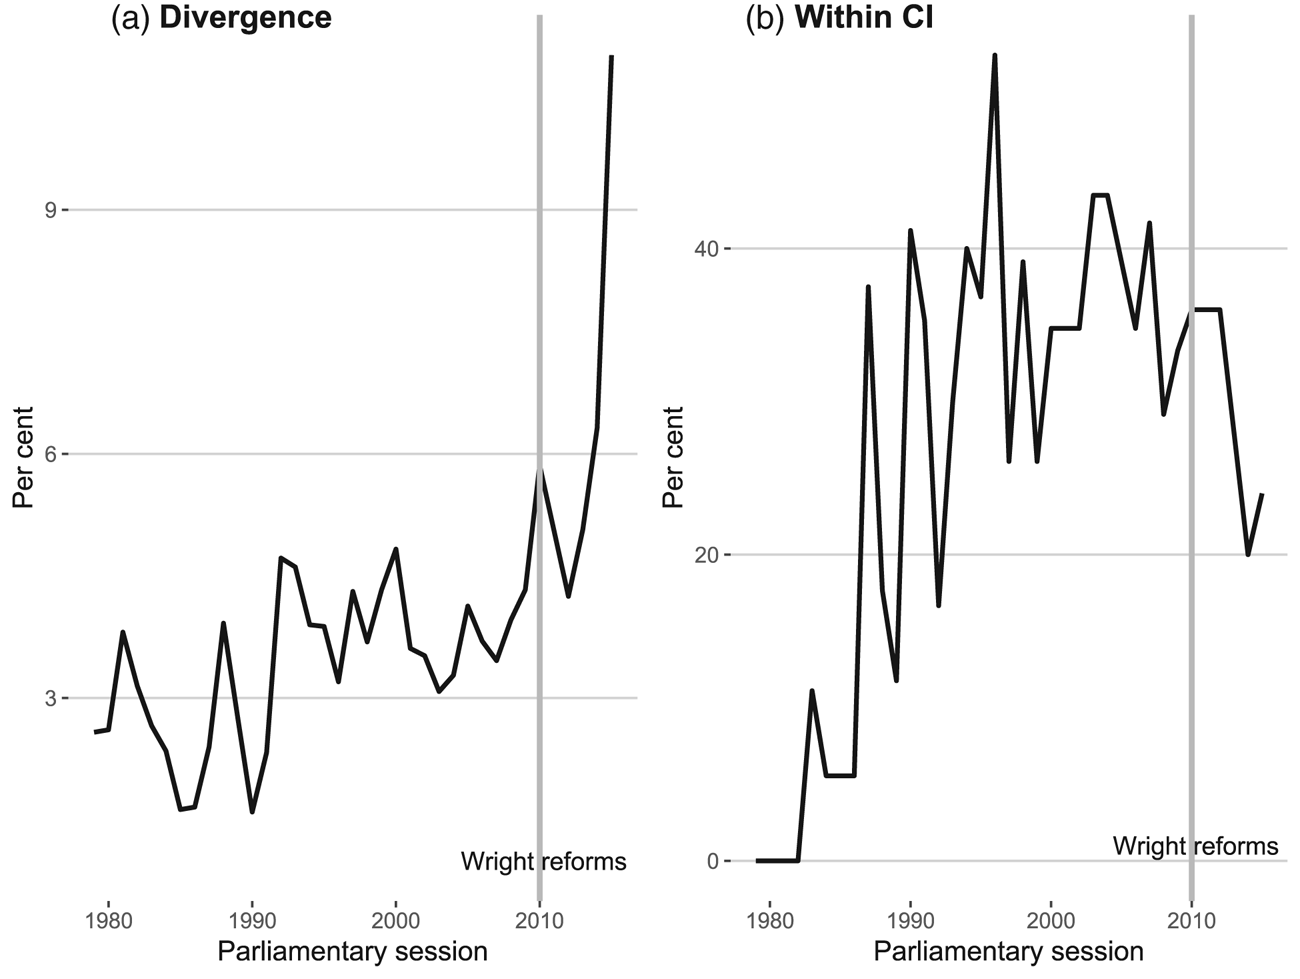
The second hypothesis (H 2) analyzes the impact of the Wright reforms and, specifically, the introduction of elections for SC members after the 2010 general election. If elections made the average committee more proportionate in gender terms, it would be expected that, after 2010, (1) the proportion of SCs falling inside the confidence bounds for female membership for each parliamentary session would increase; and/or (2) the absolute distance from the upper or lower bounds for those committees falling outside the confidence bounds would decrease. As can be seen in Tables 4–5 and Figures 2–3 and in Tables A3–A4 (available at https://doi.org/10.6084/m9.figshare.9824453.v1), neither of these things happened. Indeed, with regard to the proportion of committees that fell within the confidence bounds, the introduction of elections is associated with a change in the slope toward making committees less proportionate. The results for these two ARIMAX analyses are quite difficult to interpret given that the presence of a Labour government is significant for both but in opposing directions: a Labour government is associated with making committees less proportionate in terms of the proportion of committees within the confidence bounds but more proportionate in terms of the absolute divergence from the confidence bounds. Moreover, increases in female MPs are also associated with increasing the absolute divergence from confidence bounds (i.e., making committees less proportionate). Future research is perhaps necessary to identify more fully whether female MPs from different parties participate in the committee system differently but these finding imply, given both that Labour has consistently had a large majority of the female MPs in Parliament and that, when in government, Labour has a majority on every SC, that female Labour MPs are specializing (or being told to specialize) in a smaller range of committees than their male counterparts or female MPs in other parties but that, once they have specialized, they spread themselves out relatively evenly.
Divergence and stability of female representation, 1979–2016.

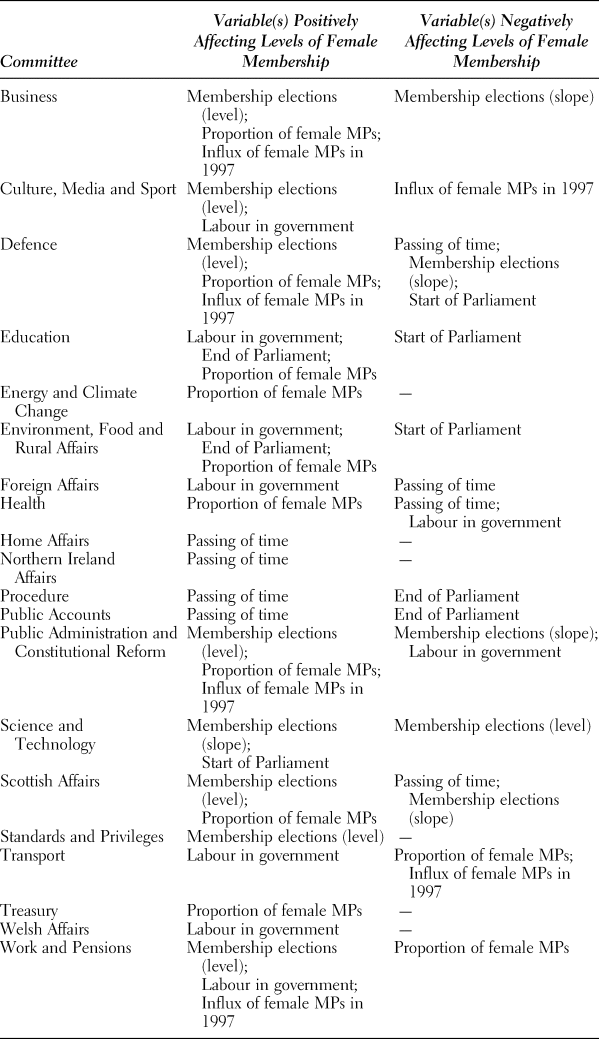
Summary of variables affecting proportion of female members for individual select committees (p < .05)

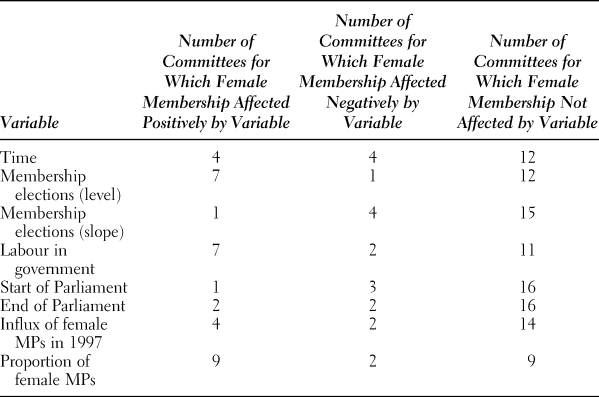
Summary of variable effect on female membership of individual committees

For individual SCs (see Figure 2, Tables 4–5, and Tables A3–A4 at https://doi.org/10.6084/m9.figshare.9824453.v1), there is no clear pattern of what affects levels of female membership. For example, there is evidence that six committees became more proportionate after the introduction of elections. However, there is also evidence that for two other committees, elections positively affected the proportion of female members but in a different direction to what would be expected given the longer-run trend of the committee: the Work and Pensions SC became even more female after the introduction of elections, and the Business SC became disproportionately female after 2010, having been proportionate in two thirds of parliamentary sessions from 1992 onward.
The gendered membership patterns of 12 committees were not affected by the reforms. Therefore, there is little evidence that the introduction of membership elections had the systematic effect of distributing male and female MPs more evenly across committees. Indeed, none of the variables included in our models had a consistent effect on female membership levels within individual committees; the effects were consistently inconsistent. For example, while increases in the proportion of female MPs in the HoC were associated with increases in female membership on nine committees, on another nine committees, there was no association, and on two committees, increases in the overall proportion of female MPs were associated with reduced female membership. For all variables included here, the effects were similarly mixed. Indeed, the variables did not even affect the different broad categorizations of committees in the same manner. Where there was more than one committee affected positively, negatively, or not at all, there was a mixture of disproportionately female, mixed, and/or disproportionately male committees. All this suggests that neither (sharp) increases in the proportion of female MPs, nor changes in government, nor the introduction of elections can be relied upon to systematically disrupt gendered divisions of labor concerned with the horizontal and vertical dimensions of committee portfolio allocation.
DISCUSSION
Our analysis suggests clear evidence of a gendered division of labor in both the vertical and horizontal dimensions of select committee membership in the U.K. Parliament. There is a significant difference in the gender profile of committees and wide variation in the proportion of male and female members on committees covering different policy portfolios. This finding holds at the system level when looking at patterns over time, although there is some variation at the level of individual committees. There are also some exceptions to theorized gender patterns—Home Affairs being the most notable—although it is important to note that the Krook-O'Brien classifications were developed for the purposes of cross-country comparison, and consequently, there will be variations in the gender coding and status attached to specific portfolios within their national context.
Home Affairs, for example, might be regarded in the United Kingdom as less prestigious in comparison to the other portfolios in the masculine/high-status category because of the historical priority given to international “high” politics over domestic “low” politics (Bulpitt Reference Bulpitt1983). This contextualization might suggest that Home Affairs in the United Kingdom ought to be positioned closer to the medium-status than the high-status category, especially given the fact that no variables—with the exception of the passing of time—affected female membership of the committee, suggesting that the relative feminization of Home Affairs is long-standing.
The Northern Ireland brief is also perhaps distinctive in comparison to other regional portfolios in other countries (as well as in the United Kingdom) because the role has historically been associated with high-level diplomatic and military affairs, which would suggest the coding ought to be masculine rather than neutral. Furthermore, the number of possible female candidates is limited by the fact that the committee reserves places for the Northern Irish parties, which are even more disproportionately male than other parties.Footnote 13
The results raise the question of how these gendered patterns of participation are best explained. The evidence for the existence of a gendered division of labor (both horizontal and vertical) is strong. Yet, following the injunction of Mackay, Kenny, and Chappell to search for “common causal mechanisms” (Reference Mackay, Kenny and Chappell2010, 584), we recognize that the foregoing analysis does not allow us to “systematically identify [the] particular gendered institutional processes and mechanisms” (Kenny Reference Kenny2014, 679) at play within the SC system, even if we are able to identify their gendered effects (and the [non]impact of certain reforms that have been posited as potential ways to improve the status of women within legislatures).
One potential route to identify such processes and mechanisms in future research might be to study the role and influence of domestic/administrative SCs in the day-to-day running of Parliament more closely. The parliamentary affairs committees included in our study are all, except the Procedure Committee, disproportionately male, while the Krook-O'Brien typology codes them neutral. It may well be that those who occupy the backbench role of “Good House of Commons Men,” as identified by Donald Searing (Reference Searing1994, Reference Searing1995; see also McKay, Goodwin, and Bates Reference McKay, Goodwin and Bates2019), are able, through these housekeeping committees, to maintain and reinforce a particular way of working within the SC system as a whole that contributes to the (continuing) reproduction of a masculine gender regime within Parliament (Lovenduski Reference Lovenduski2012).
Another route might be to concentrate on gendered institutionalized processes surrounding (routes toward) candidacy for both chairships and memberships of committees in more masculine (and more feminine) policy areas. At present, the information about candidacy is lacking in a number of ways, but tentative conclusions about its impact on the gendered patterns identified above remain possible. Data on the party caucus elections for committee membership, including information on which MPs stand as candidates, are not made publicly available. However, information on candidates and voting for the intracameral committee chair elections is. Since the introduction of chair elections, the likelihood of a SC chair being female has increased (see Tables A3–A4 at https://doi.org/10.6084/m9.figshare.9824453.v1, which confirms O'Brien's Reference O'Brien2012 finding), although female MPs remain underrepresented as SC chairs. Moreover, for the 2010–16 period, while female MPs made up 20% of the candidates who stood for election, 50% of those female candidates were successful (compared with 37% of male candidates). There is thus no evidence of direct discrimination by voters against female MPs who stand for election as committee chair elections in the period under consideration.Footnote 14
However, although the numbers involved are small, the chair elections show that women do not put themselves forward to contest chairing masculine and/or high-status committees as frequently as men,Footnote 15 which has ramifications for both the vertical and horizontal gendered division of labor. As in the case of the general membership of committees, female candidates are concentrated within a small number of committees that have a disproportionately female membership. For example, during the period of study, no female MP stood for the chair of the disproportionately male (and high-status) Defence, Foreign Affairs, or Treasury Committees, yet there have been 11 female candidates for the disproportionately female Health, Education, Women and Equalities, and Work and Pensions Committees. In total, for those committees found to be disproportionately male in our study (n = 15), there were 0.73 female chair candidates per committee, and for those committees found to be disproportionately female (n = 6), there were two female chair candidates per committee.
The available, albeit rather limited, evidence, then, suggests that continuing, sometimes persistent, horizontal and vertical gendered divisions of labor within the U.K. SC system are not straightforwardly the result of voters failing to choose female candidates when they are presented with a choice. Instead, it seems that the gendered division of labor is in place already at the point that candidates go forward to compete for elected positions.
These findings could be presented as evidence that the division of labor within the SC system is a result of self-selection (i.e., women do not put themselves forward as candidates), rather than a result of discrimination (i.e., women are not elected when they stand). However, the literature warns us against going down such a path, for a number of reasons. First, a simple focus on self-selection implies a latitude of agential behavior and a resulting absence of “degrees of determination” (Layder Reference Layder and Scott1994; see also Bates Reference Bates2010; Luke and Bates Reference Luke and Bates2015) that run the risk of reducing (in)formal institutions—as well social structures—to epiphenomena. Second, such an argument only serves to advance the analysis to a slightly higher level of description, rather than providing a genuine explanation by identifying the mechanisms by which different groups of politicians systematically “select” different paths.
Work on committees in other countries may point us toward the specific mechanisms in play in the U.K. system.Footnote 16 For example, in their work on French legislative committees, Murray and Sénac (Reference Murray and Sénac2018) find strikingly similar patterns of gendered committee allocation to those found in the United Kingdom. In their explanation of these patterns, the authors reject a simple binary of self-selection versus discrimination in favor of a more complex interaction wherein gender effects produce very different experiences for men and women who enter politics. Committee allocations are, on this reading, the outcome of gendered norms and practices that stretch at least as far back to the beginning of the political recruitment pipeline, and do not depend solely on the final stage at which committee members are elected or appointed. Murray and Sénac conclude that “gendered norms run so deep that they are internalized by deputies of both sexes and all parties. Consequently, committee allocations are almost a fait accompli, shaped by all that came before” (Reference Murray and Sénac2018, 329).
Such arguments point us toward exploring in future (qualitative) research whether and how similar “upstream” informal gendered norms of appropriateness and “rules-in-use”—that is, tacit standards of conduct, or working rules, learned through practical experience—are in play within the U.K. SC system and help shape the enduring gendered patterns of behavior we identify, even when the formal rules of institutions are neutral in gender terms and do not actively promote such patterns (Chappell Reference Chappell2006; Mackay and Waylen Reference Mackay and Waylen2014; Ostrom Reference Ostrom1990; Waylen Reference Waylen2017).
Such arguments also point us toward potential explanations why the 2010 reforms to the SC system, as well as broader changes to the makeup of Parliament since 1979, have not had the impact on the gendered nature of SC membership (and chairship) that they might be expected to have had.
Researchers have found that gendered patterns of political behavior, sustained by informal institutions, can persist even when formal rules are consciously and actively reformed in a more gender-equal direction, for example, through the use of quotas or gender mainstreaming (see, e.g., Mackay and Waylen Reference Mackay and Waylen2014; Waylen Reference Waylen2017). A version of this paradox applies to the U.K. SC system. While our case does not involve reforms specifically targeted at promoting gender equality, the Wright reforms introduced in 2010—as well as the large increase in female representatives in the period studied (from 2.9% in 1979 to 29% in 2016, including a near doubling of female MPs in 1997) and a change in administration from a right-wing to a (center-)left-wing government—might have been expected to produce shifts in the gender patterns of allocation and election to committees. Yet we find no evidence of such a shift, at least at the systemic level. The majority of gendered membership patterns across committees do not seem to have been affected by the change from a whip-led system of selection to a parliamentary/party-led hybrid system of selection as a consequence of the Wright reforms (or by the other changes to the parliamentary landscape upon which we focus). While female MPs are not disadvantaged in elections to committee chairs and the 2010 reforms have favored female candidates when they stand (with female MPs even gaining a small number of chairs for masculine and male-dominated committeesFootnote 17), female MPs mainly continue to participate in SC work disproportionately in lower-status and feminized policy areas regardless of the fact that party whips no longer control appointments. Who chooses has changed, but who ends up being chosen has remained, if not the same, then (often very) similar.
This has important implications for any future attempts at reform that explicitly target the gendered patterns of membership and chairship we identify. Our findings, as well as the insights of the other research we discuss above, suggest that changes to the formal rules—for example, the adoption of quotas, parity policies, or changes to committee election rules to promote gender equality—may simply be an ineffectual effort to treat the symptoms while leaving the informal institutions which drive these gendered power imbalances (mainly) intact.
CONCLUSION
Our study has found evidence of a gendered division of labor in the allocation of SC positions in the U.K. Parliament, similar to that found within other countries. Female MPs are not systematically included or excluded from the system relative to their strength in Parliament as a whole but they do participate differently from male MPs. It is thus not a question of whether women participate in the committee system, but how and why. We find that there is a gendered pattern to MPs’ participation whereby, over the period, female MPs tend to serve on lower-status committees and those covering more feminized policy areas (H 1). The introduction of elections in 2010 does appear to have helped female MPs—when they stand—to succeed in elections for committee chairs and therefore reduce the gendered division of labor in the vertical dimension concerned with status within committees. However, membership elections have had no clear impact on the vertical dimension concerned with the status among particular committees or on the horizontal gendered division of labor across portfolios (H 2). The lack of impact of the Wright Committee reforms, (sharp) increases in the proportion of female MPs and changes in government on gendered patterns of participation, as well as the available evidence concerning candidature, suggests that discrimination by party managers, small numbers of female MPs, and the political bent of governing parties who hold a majority on committees have not been the (only) causes of gendered divisions of labor within the committee system.
The consequence of this state of affairs is that gendered divisions of labor in both the vertical and horizontal dimensions look likely to persist. This will have (continuing) ramifications for both the descriptive and substantive representation of women in certain policy areasFootnote 18 and—with women being less present on those committees that act as gatekeepers and guardians of parliamentary process—potentially on the reproduction of a gender regime within Parliament as well (Lovenduski Reference Lovenduski2012). Moreover, with research suggesting that identity-diverse groups tend to outperform homogenous groups (see, e.g., Bosetti, Cattaneo, and Verdolini Reference Bosetti, Cattaneo and Verdolini2015; Hong and Page Reference Hong and Page2004; Ottaviano and Peri Reference Ottaviano and Peri2006), the gendered division of labor may impact the effectiveness of SCs and the scrutiny and accountability work they undertake.
Our results also suggest complications for strategies that might aim to improve these gendered power imbalances. First, we find no evidence that parliamentarians’ behavior in relation to committee positions moves toward greater gender equality with rising female participation in Parliament. This perhaps poses a challenge to strategies aimed at reform within legislatures that are (solely or mainly) based on parity laws or quotas for female representatives coming into legislatures (even if we may wish to retain such strategies for other reasons). Second, there is (circumstantial) evidence from our own and other studies to suggest that changes to formal rules of committee selection/election that may be beneficial in producing greater gender equality can be undermined or weakened when they are in tension with powerful informal institutions that sustain gendered power imbalances. At the very least, reforms to formal rules need careful calibration if they are to restructure the underlying gender norms that promote and reproduce these gendered power imbalances rather than merely ameliorate the existing state of affairs by attempting to treat the symptoms.
SUPPLEMENTARY MATERIAL
To view supplementary material for this article, please visit https://doi.org/10.1017/S1743923X19000874.