


Introduction
Olfaction is the primary sense that recognises chemical information in the environment. For example, in insects, it is used to find food, mates, and oviposition sites (Hansson and Stensmyr Reference Hansson and Stensmyr2011; Shao et al. Reference Shao, Cheng, Wang, Zhang and Yang2021). Given its importance, the olfactory system should be able to maintain its ability to offer sufficient information in a continuously changing environment. Environmental temperature modifies the volatility and concentrations of odorants in the surrounding air and strongly affects olfaction in insects (Martin et al. Reference Martin, Riveron and Alcorta2011). For example, studies on Drosophila melanogaster (Diptera: Drosophilidae) have shown that environmental temperature affects olfactory perception (Martin et al. Reference Martin, Riveron and Alcorta2011). Additionally, environmental temperature influences the internal biological processes of insects (Chown et al. Reference Chown, Addo-Bediako and Gaston2002; Bochdanovits and De Jong Reference Bochdanovits and De Jong2003; Trudgill et al. Reference Trudgill, Honěk, Li and Straalen2005; Parkash et al. Reference Parkash, Sharma and Kalra2009; Riveron et al. Reference Riveron, Boto and Alcorta2009; Gibert and De Jong 2010). In Grapholita molesta (Lepidoptera: Tortricidae) and Pectinophora gossypiella (Lepidoptera: Gelechiidae), temperature directly affects neural pathways and can significantly impact the male behavioural response to pheromones (Linn et al. Reference Linn, Campbell and Roelofs1988).
As ectotherms, honeybees, Apis mellifera (Hymenoptera: Apidae), have the specific ability to control their body temperature in response to environmental changes (Guo et al. Reference Guo, Zhang, Zhao and Zhao2018a). Although numerous studies have been conducted on temperature changes in bees and honeycombs, the mechanism through which the olfactory system senses thermal stimuli and combines temperature and chemical signals to elicit certain behavioural responses remains unclear. This study investigated the possible effect of temperature modulation on olfactory receptor functions in Apis cerana cerana (Hymenoptera: Apidae). Changes in AcerOr1 and AcerOr2 receptor-gene expression were measured using quantitative reverse-transcription polymerase chain reaction (qRT-PCR) at the mitochondrial-RNA (mRNA) level and using western blotting at the protein level. The functional characterisation of the antennal electrophysiological responses of A. cerana cerana was also examined after treatment with different temperatures.
Materials and methods
Insect rearing
Honeybees (A. cerana cerana) were obtained from an apiary at the Shanxi Agricultural University Experimental Station, which is part of the College of Animal Science, Shanxi Taigu, China. The bees were maintained in an area free of pesticide use or agricultural activities. Three hundred foraging worker adults were collected from six robust outdoor colonies (50 bees per colony) at the hive entrances and randomly divided into five groups (n = 60/group). The trials were performed in triplicate. Each group of bees was kept in a wooden box (12 × 12 × 5 cm).
Odours
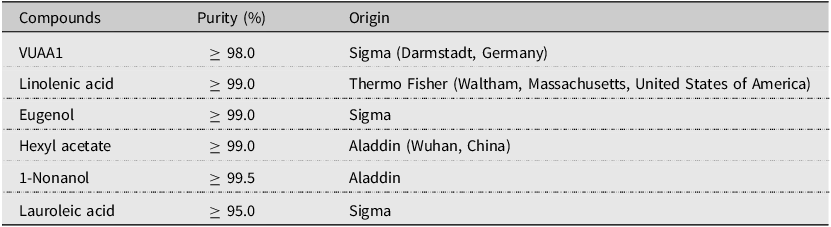
For electroantennography (EAG) and behavioural tests, six odorant volatiles – N-(4-ethylphenyl)-2-((4-ethyl-5-(3-pyridinyl)-4H-1,2,4-triazol-3-yl)thio)acetamide (VUAA1), linolenic acid, eugenol, hexyl acetate, and 1-nonanol, and lauroleic acid (which are AcerOr1 and AcerOr2 ligands) – were selected (Guo et al. Reference Guo, Zhao and Jiang2018b). These six compounds were used at a concentration of 500 μg/μL, which is derived from our previous experimental results and has been selected and validated many times by our laboratory (Guo et al. Reference Guo, Zhao and Jiang2018b). All solutions were stored at −20 °C until use. The standard odorant compounds used in this study and their sources are listed in Table 1.
The standard odorant compounds used in the present study and their sources

Temperature treatments
To investigate the effect of temperature on the expression of odorant receptors (OR), five groups of workers were exposed to different temperatures (0, 10, 25, 32, and 40 °C). For each temperature treatment, 60 bees were exposed for 1, 2, 3, 4, and 5 hours in an artificial climatic incubator (Ningbo LeDian Instrument Manufacturing Co., Ltd., Ningbo, China) with 70% relative humidity. The experiments were performed in triplicate. After exposure for 1, 2, 3, 4, and 5 hours, some bees were used immediately for the EAG experiment, and the other bees were frozen with liquid nitrogen and stored in a –80 °C refrigerator. The preserved bees were used for the qRT-PCR and the Western blot analyses of olfactory receptor gene expression. All bees used in our experiments came from the same batch.
Quantitative reverse-transcription polymerase chain reaction
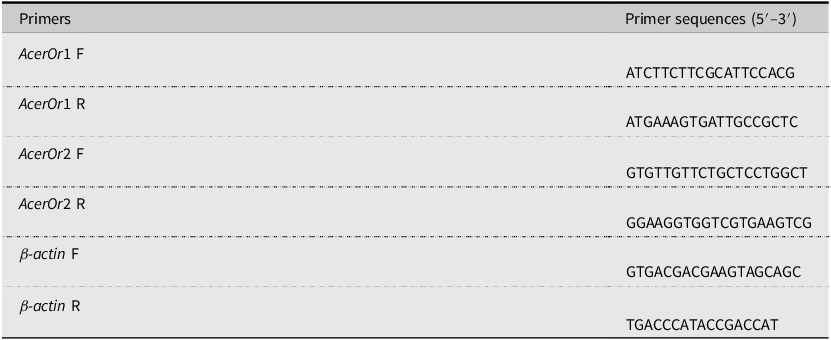
The transcript levels of AcerOr genes were detected using the qRT-PCR assay. Total RNA was isolated using TRIzol reagent (Takara Biotechnology Co. Ltd., Dalian, China), following the manufacturer’s protocol. Complementary DNA (cDNA) was synthesised from total RNA using PrimeScript® RT Reagent Kit (Takara Biotechnology Co. Ltd.) according to the product guidelines. All reverse transcription reactions, including those for the β-actin controls, were performed in triplicate. The primers used are listed in Table 2 (Guo et al. Reference Guo, Zhao and Jiang2018b; Zhao et al. Reference Zhao, Gao, Zhang, Ma and Jiang2013, Reference Zhao, Gao, Du, Ma, Tian and Jiang2014). The reactions were performed in a 7500 real-time PCR system (Applied Biosystems, Waltham, Massachusetts, United States of America), using SYBR® Select Master Mix (Applied Biosystems).
Primers used in the present study

Western blot
Using the primary amino acid sequence and secondary protein structure information of AcerOr1 and AcerOr2 in National Center for Biotechnology Information GenBank and various bioinformatics software, we obtained highly valent and specific polyclonal antigens for olfactory receptor AcerOr1 and AcerOr2. The antigenic peptides AcerOr1 ENTTNYRNIHYKSD (14 aa) and AcerOr2 NARYHQIAVK (10 aa) were identified. Antibodies for AcerOr1 and AcerOr2 were synthesised by AbMax (AbMax Biotechnology Co., Ltd., Beijing, China) and used for western blot analysis to confirm the expression of AcerOr1 and AcerOr2 (Guo et al. Reference Guo, Zhao and Jiang2018b). The total protein content was quantified using the Bicinchoninic Acid Protein Assay Kit (Boster Biological Technology, Wuhan, China) according to the manufacturer’s instructions. The extracted proteins (40 μg per sample) were separated on 12% sodium dodecyl sulfate–polyacrylamide gel electrophoresis (SDS–PAGE) and then transferred to a nitrocellulose membrane for further analysis. The membranes were saturated for 1.5 hours at 20 °C in 5% skimmed milk (Boster Biological Technology) and incubated with rabbit polyclonal anti-AcerOr1, rabbit polyclonal anti-AcerOr2, and mouse anti-β-actin antibodies (1:500 v/v; Boster Biological Technology) overnight at 4 °C. Subsequently, the membranes were incubated with donkey anti-rabbit immunoglobulin G (IgG; 1:5000 v/v; Boster Biological Technology) and goat anti-mouse IgG (1:2000 v/v; Boster Biological Technology) secondary antibodies for 2 hours at 20 °C. Bands were visualised using the super-enhanced chemiluminescence-plus detection reagent (Boster Biological Technology), and the resulting images were processed and analysed with ImageJ, version 1.49 (National Institutes of Health, Bethesda, Maryland, United States of America).
Electroantennography
Electroantennography signals were recorded to evaluate the antennal electrophysiological responses of A. cerana cerana to different volatile odorants in vivo. The antennae were carefully removed at their base, and several terminal segments at the distal ends were excised and placed in EAG electrode probes (Ockenfels Syntech GmbH, Hilversum, The Netherlands) with a drop of Spectra 360 electrode gel (Parker Lab, Inc., Fairfield, New Jersey, United States of America). All reagents were mixed and diluted in liquid paraffin to the concentration of 500 μg/μL. Pure liquid paraffin was used as a blank control. Filter paper strips (5 × 50 mm) were loaded with 20 μL of each test solution and inserted into a glass Pasteur pipette to serve as a source of stimuli. Humidified airflow was delivered at a constant rate of 700 mL/min by an air stimulus controller (CS-55; Ockenfels Syntech GmbH, Kirchzarten, Germany). The odour stimuli were provided three times at 2 mL/s for 0.5 seconds at 30-second intervals. The EAG signals of the antennal response to each stimulus were recorded as voltage waveforms using an Intelligent Data Acquisition Controller– (IDAC–) 4 computer-operated amplifier (Ockenfels Syntech GmbH). The data acquisition and analysis of the antennal response were conducted using EAGPro software (Ockenfels Syntech GmbH). Each recording used a freshly prepared antenna. The recordings for each concentration were performed in millivolt (mV), and a dose–response curve was plotted. The antennal electrophysiological response for compounds was calculated as follows:
 $$\;{\rm{R}}{{\rm{V}}_{{\rm{EAG}}}}={{{\rm{Vs}}\;{\rm{ - }}\;{\rm{Vbmean}}} \over {{\rm{Vbmean}}}}$$
Statistical analysis
The comparative 2-ΔΔct method was used for relative quantitative analysis, and the calculation method was as follows: ΔCT(test) = CT(target, test) – CT(ref, test); ΔCT(calibrator) = CT(target, calibrator) – CT(ref, calibrator); and ΔΔCT = ΔCT(test) – ΔCT(calibrator). Finally, the value of ΔΔct was substituted into the formula 2–ΔΔct to get the final result. The data were evaluated using SPSS 17.0 (SPSS Inc., Chicago, Illinois, United States of America) and are presented as mean ± standard error of the mean. An analysis of variance test was used to compare groups, and the least-significant difference at P-values less than the 0.05 level of significance was used to determine post-significance of means among the groups. The results were plotted using GraphPad Prism 6.0 (GraphPad Software Inc., San Diego, California, United States of America).
Results
Effect of temperature on the transcription levels of AcerOr olfactory receptors
The potential changes in transcription levels of AcerOrs in response to environmental temperature variations were investigated. For all five temperature treatments, the expression of AcerOr genes differed significantly. The expression levels of AcerOr1 and AcerOr2 increased significantly with extended exposure time at 25 °C. In contrast, both cold (0 °C and 10 °C) and heat (32 °C and 40 °C) shocks had the opposite effect, which were dependent on the duration of exposure. The interaction between temperature shocks (both heat and cold) and the exposure time was also significant (Fig. 1).
Effects of different temperature treatments on the transcription levels of AcerOr mRNA: A, relative expression of AcerOr1 mRNA in the worker bees exposed to different temperatures for different durations, and B, relative expression of AcerOr2 mRNA in worker bees exposed to different temperatures for different durations. The results are presented as mean ± standard error of the mean. Different lowercase alphabets show the difference between different treatment time groups at the same temperature (P < 0.05). Different uppercase alphabets show the difference at different temperature conditions (P < 0.05).

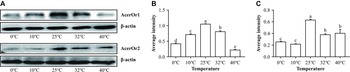
Considering the slow adaptation to temperature stimulation in insects, the expression of AcerOr1 and AcerOr2 proteins was analysed 2 hours after the temperature treatment. The results were consistent with those of the mRNA expression analysis: bands were observed at 25 °C, and the expression levels after cold (0 °C and 10 °C) and heat (32 °C and 40 °C) treatments were lower than that at 25 °C (Fig. 2).
Expression of AcerOr1 and AcerOr2 proteins under different temperature treatments: A, Western blot analysis of AcerOr1, AcerOr2, and β-actin proteins under different temperature treatments. The molecular weights of AcerOr1, AcerOr2, and β-actin are 50, 56, and 43 kDa, respectively; B, average intensity of AcerOr1; C and D, expression of AcerOr1 and AcerOr2 relative to that of β-actin. The values are presented as mean ± standard error of the mean. P-values were generated using one-way analysis of variance. Different letters indicate the significance differences among groups (P < 0.05; n = 3).

Electrophysiological changes depend on environmental temperature
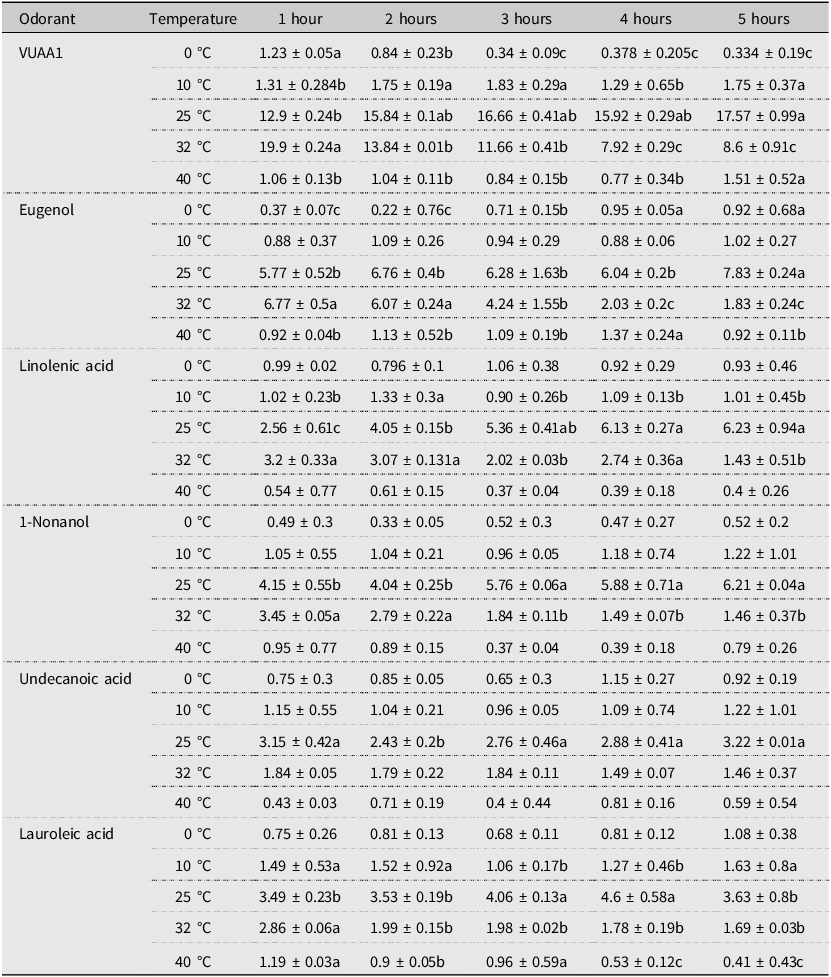
Bees exposed to five different temperature treatments were tested for EAG responses to odorants. Bees exposed to 32 °C for one hour showed maximum relative EAG responses when stimulated by three odorant volatiles: VUAA1, eugenol, and linolenic acid. However, after exposure for 2, 3, 4, and 5 hours, the maximum relative EAG responses were observed in bees treated at 25 °C. For the three other odorant volatiles, the maximum relative EAG response of bees was observed at 25 °C under all five exposure times. Overall, the antennae showed an increase in the response with increasing exposure time at 25 °C. However, the EAG signal gradually decreased with the extension of exposure time at 32 °C. The EAG responses at the 2-hour temperature treatment showed the most dramatic effect at 25 °C (Table 3; Fig. 3).
Electroantennography responses per temperature treatment and treatment length. Distinct alphabetical notations indicate statistically significant differences between groups (P < 0.05). Using Duncan’s multiple range test, means were arranged in descending order. The highest mean was designated ‘a’ and compared with other means. Means not significantly different were also labelled ‘a’. When a significant difference occurred, the next mean was labelled ‘b’. This process continued sequentially through the dataset.

The electrorheological response curves of worker honeybee antennae based on variations in temperature. Error bars indicate the standard error of the mean of three biological replicates. Asterisks at the top of the bars indicate that the values are significantly different (P < 0.05; n = 5).

Discussion
This study aimed to clarify the possible role of the transcriptional modulation in olfactory receptors in olfactory acclimation to temperatures in A. cerana cerana. In bees heat-treated at 32 °C and 40 °C for 1–5 hours, the expression of the AcerOr1 and AcerOr2 genes decreased as temperature decreased and increased with exposure time. A similar expression trend was observed in the cold-treated bees. However, the most significant increase in expression was observed at 25 °C. Similar results were observed at the protein level. These results suggest that low and high temperatures can lead to reduced expression levels of AcerOr genes. However, what amount of time is required for the temperature treatment to affect olfactory perception? Natural temperature variations constantly occur at different time scales and times of the day and during migration (e.g., from the sun to shade; Riveron et al. Reference Riveron, Boto and Alcorta2009). Hence, the results of this study do not accurately reflect natural conditions; however, they may be conducive to distinguishing between transient and durable temperature effects.
General odour reception occurs in the basiconic sensilla, mediated by the olfactory receptors and the co-receptor (Orco) with which olfactory receptors dimerise (Morozova et al. Reference Morozova, Anholt and Mackay2006). The decreased sensitivity reported at the behavioural level after heat shock may be associated with decreased olfactory receptors in odorant receptor neuron membranes. Adaptation to high levels of ethanol has also been related to acute down-regulation of Orco and other olfactory genes (Morozova et al. Reference Morozova, Anholt and Mackay2006, Reference Morozova, Mackay and Anholt2011; Awofala Reference Awofala2011).
From an ecological perspective, precisely gauging olfactory information could be crucial for insects to locate food or potential mates. Olfactory system adaptation provides accurate information that compensates for changes in the volatility of chemicals (Zhao and McBride Reference Zhao and McBride2020). The present study’s electrophysiological analyses of EAGs indicated that environmental temperature regulates and controls the response to odours at 25 °C in A. cerana cerana. A similar effect has been observed in the olfactory perception of D. melanogaster subjected to temperature treatments (Martin et al. Reference Martin, Riveron and Alcorta2011). In ectotherms, temperature affects metabolism (Lemoine and Burkepile Reference Lemoine and Burkepile2012), taste processing (Lemon Reference Lemon2017), and energy stores (Klepsatel et al. Reference Klepsatel, Wildridge and Gáliková2019). Some studies also established that temperature affects olfactory sensitivity in D. melanogaster. At lower temperatures, animals consume less food. Moreover, the failure of an organism to adjust its food consumption based on environmental temperature can affect adaptability (Klepsatel et al. Reference Klepsatel, Wildridge and Gáliková2019).
Conclusions
Overall, the effect of environmental temperature changes on the expression of olfactory receptors can alter olfaction signal processing and perception in A. cerana cerana, suggesting that olfactory preference changes can be influenced by prior exposure to varying temperatures. The results from the present study suggest that the expression of AcerOr genes, and EAG responses are altered in response to environmental temperature changes.
Acknowledgements
This work was funded by the China Agriculture Research System of MOF and MARA (grant number CARS-44-KXJ2), the National Key Research and Development Programme of China (2022YFD1600201-3), Shanxi Agricultural University Local Co-operation Project (XDHZGXY2024-02), and the Fundamental Research Programme of Shanxi Province for Youth (20210302124508).
Author contributions
Yuan Guo, Lina Guo, and Yu Zhang conceived and designed the experiments. Lina Guo, Yu Zhang, Jue Wang, and Diandian Yu performed the experiments and analysed the data. Lina Guo wrote the paper. Yuan Guo supervised the work.
Competing interests
The authors declare that they have no conflicts of interest.