1. Introduction
A stationary and parallel flow may exist in a vertical channel bounded by impermeable and isothermal parallel planes kept at different temperatures. This flow is caused by the action of the buoyancy force and is endowed with a zero vertical mass flow rate. Such a flow may be established, with different features, either for a fluid filling the channel or for a fluid-saturated porous slab. In both cases, the temperature profile across the channel is linear, as in pure conduction, so that this buoyant flow regime is usually called a conduction regime.
A cornerstone result in the analysis of the conduction regime for a vertical porous slab governed by Darcy’s law was obtained by Gill (Reference Gill1969). That author, by employing a linear stability analysis, was able to prove that the stationary and parallel natural convection flow in a vertical porous slab is always stable. Despite the sharp conclusion drawn by Gill (Reference Gill1969), further investigations were carried out later on by other authors. The main motivation of these studies is the suggestion stated by Gill at the end of his paper that possible instability could be obtained by including inertial effects in the local momentum balance equation, i.e. by altering the classical formulation of Darcy’s law. Rees (Reference Rees1988) reformulated Gill’s stability problem by taking into account the term proportional to the time-derivative of velocity in the momentum balance. That author was able to carry out a very detailed and thorough numerical solution of the eigenvalue stability problem in order to determine the growth rates of the perturbations imposed on the basic flow. Rees (Reference Rees1988) concluded that, in spite of the improvement in the momentum balance formulation, Gill’s conclusion that the conduction regime is always stable maintained its validity. Further results complementary to the analyses carried out by Gill (Reference Gill1969) and Rees (Reference Rees1988) were reported by Lewis, Bassom & Rees (Reference Lewis, Bassom and Rees1995), relating to a regime of very large Darcy–Rayleigh numbers. Other authors (Wolanski Reference Wolanski1973; Straughan Reference Straughan1988; Flavin & Rionero Reference Flavin and Rionero1999) reconsidered Gill’s stability problem by a fully nonlinear analysis. In particular, Straughan (Reference Straughan1988) proved that nonlinear disturbances of the basic flow decay in time, at least exponentially, under suitable initial conditions. In other words, Straughan (Reference Straughan1988) showed that Gill’s proof of stability can be extended to the nonlinear domain of perturbations. Kwok & Chen (Reference Kwok and Chen1987) investigated separately the effect of no-slip boundary conditions for velocity, implemented by Brinkman’s model of momentum balance instead of Darcy’s law, and the effect of temperature-dependent viscosity within Darcy’s law. These authors found that, within a linear stability analysis, both no-slip conditions and variable viscosity are able to yield instability and, hence, to modify the conclusion implied by Gill’s proof. It must be mentioned that, in both cases examined by Kwok & Chen (Reference Kwok and Chen1987), the basic flow states differ from that considered by Gill (Reference Gill1969). Two very recent papers (Rees Reference Rees2011; Scott & Straughan Reference Scott and Straughan2013) present a new perspective on Gill’s problem by taking into account the lack of local thermal equilibrium between fluid phase and solid phase. These authors confirmed the conclusion that the basic flow is stable with either linear (Rees Reference Rees2011) or nonlinear (Scott & Straughan Reference Scott and Straughan2013) stability analyses.
The aim of this paper is to prove that the role of the velocity boundary conditions may be very important in determining the onset of instability. The flow system considered and the mathematical model adopted are exactly the same as those assumed by Gill (Reference Gill1969). The only difference is in the velocity boundary conditions as the vertical boundaries are assumed to be permeable instead of impermeable. This change has no influence on the form of the basic natural convection flow, viz. the conduction regime, so that the basic state is exactly the same as that considered by Gill (Reference Gill1969). On the other hand, the conclusions drawn from the linear stability analysis are markedly different. The extent of this difference is assessed in two steps. First, Gill’s proof is reconsidered to show that it cannot be extended to the case of permeable walls. Then, a numerical solution of the stability eigenvalue problem is employed to determine the conditions for the onset of instability. Finally, the nonlinear regime of instability is studied by direct numerical simulations carried out with a finite element solver of the governing equations.
2. Mathematical model
The subject of this analysis is the natural convection in a vertical porous slab bounded by two vertical planes at
 $x=\pm L/2$
where uniform temperatures
 $T_{1}$
and
 $T_{2}$
are prescribed. The
 $x$
-axis is horizontal and perpendicular to the bounding planes, the
 $y$
-axis is vertical and oriented upward, while the
 $z$
-axis is horizontal.
2.1. Governing equations
We model the fluid-saturated porous medium through Darcy’s law, by invoking the validity of the Oberbeck–Boussinesq approximation. Furthermore, we assume that local thermal equilibrium between the solid and the fluid exists and that no internal heat source is present. Thus, the governing equations can be written in a dimensionless form as
 $$\begin{eqnarray}\displaystyle & \boldsymbol{{\rm\nabla}}\boldsymbol{\cdot }\boldsymbol{u}=0, & \displaystyle\end{eqnarray}$$
 $$\begin{eqnarray}\displaystyle & \boldsymbol{u}=-\boldsymbol{{\rm\nabla}}p+RT\hat{\boldsymbol{e}}_{y}, & \displaystyle\end{eqnarray}$$
 $$\begin{eqnarray}\displaystyle & \displaystyle \frac{\partial T}{\partial t}+\boldsymbol{u}\boldsymbol{\cdot }\boldsymbol{{\rm\nabla}}T={\rm\nabla}^{2}T, & \displaystyle\end{eqnarray}$$
 $\hat{\boldsymbol{e}}_{y}$
is the unit vector along the
 $y$
-axis. The dimensional coordinates
 $(x,y,z)$
, time
 $t$
, dynamic pressure
 $p$
, seepage velocity
 $\boldsymbol{u}=(u,v,w)$
, and temperature
 $T$
have been scaled to define the corresponding dimensionless quantities, namely
 $$\begin{eqnarray}\frac{1}{L}(x,y,z)\rightarrow (x,y,z),\quad \frac{{\it\alpha}}{{\it\sigma}L^{2}}t\rightarrow t,\quad \frac{K}{{\it\mu}{\it\alpha}}p\rightarrow p,\end{eqnarray}$$
 $$\begin{eqnarray}\frac{L}{{\it\alpha}}\boldsymbol{u}=\frac{L}{{\it\alpha}}(u,v,w)\rightarrow (u,v,w)=\boldsymbol{u},\quad \frac{T-T_{0}}{T_{2}-T_{1}}\rightarrow T.\end{eqnarray}$$
Here,
 ${\it\alpha}$
is the average thermal diffusivity,
 ${\it\sigma}$
is the ratio between the average volumetric heat capacity of the saturated porous medium and the volumetric heat capacity of the fluid,
 $K$
is the permeability,
 ${\it\mu}$
is the dynamic viscosity, and
 $T_{0}=(T_{1}+T_{2})/2$
is the reference temperature. The term dynamic pressure is used here to denote the local difference between the pressure and the hydrostatic pressure.
The Darcy–Rayleigh number
 $R$
is defined as
 $$\begin{eqnarray}R=\frac{g{\it\beta}(T_{2}-T_{1})KL}{{\it\nu}{\it\alpha}},\end{eqnarray}$$
where
 $g$
is the modulus of the gravitational acceleration
 $\boldsymbol{g}=-g\hat{\boldsymbol{e}}_{y}$
, while
 ${\it\beta}$
is the thermal expansion coefficient of the fluid, and
 ${\it\nu}$
is the kinematic viscosity of the fluid.
2.2. Boundary conditions
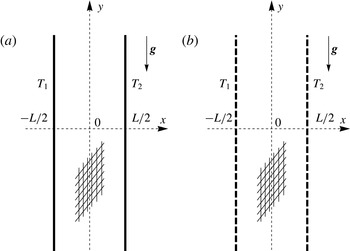
As sketched in figure 1 by employing dimensional quantities, we devise two possible sets of boundary conditions relative to the planes
 $x=\pm 1/2$
.
A sketch of (a) Model A and (b) Model B in terms of dimensional quantities.

2.2.1. Model A
We can imagine these planes as isothermal and impermeable following Gill’s approach (Gill Reference Gill1969), namely
 $$\begin{eqnarray}x=\pm 1/2\!:\quad u=0,T=\pm 1/2.\end{eqnarray}$$
2.2.2. Model B
The alternative is to model the boundaries as permeable. In this case, the external environments in the regions
 $x<-1/2$
and
 $x>1/2$
are considered as isothermal fluid reservoirs in a motionless state and kept at different uniform temperatures,
 $T_{1}$
and
 $T_{2}$
. In these reservoirs, the pressure distribution is purely hydrostatic, so that the dynamic pressure is zero. Hence, we formulate the boundary conditions
 $$\begin{eqnarray}x=\pm 1/2\!:\quad p=0,T=\pm 1/2.\end{eqnarray}$$
2.2.3. Comparison between Models A and B
The importance for the building industry of Model A was pointed out by Gill (Reference Gill1969). A vertical porous slab with impermeable side boundaries is conceived by Gill as an effective method to produce an insulated gap within a building wall. In this context, the suppression of heat transfer enhancement, beyond pure conduction, is definitely a desired feature (Gill Reference Gill1969). Model B converts the perfectly impermeable boundaries of the porous slab into perfectly permeable boundaries. A real insulation slab is more realistically modelled with imperfectly impermeable, or partly permeable, boundaries. This reasonably means a behaviour intermediate between Model A and Model B. On the other hand, Model B appears closer to systems such as the ‘breathing walls’ (Imbabi Reference Imbabi2006). Dynamic insulation and breathing walls are, in fact, novel concepts in the building industry aimed to achieve a better indoor air quality by allowing air inflow/outflow through insulated building walls.
As pointed out by Elder (Reference Elder1967), natural convection in a porous medium is important to geophysics, especially for the analysis of geothermal sites and hot-spring areas. That author also mentioned the phenomenon of mass discharge in the study of hydrothermal systems and of penetrative convection in the upper mantle. As in Model B, defined by (2.6), Elder (Reference Elder1967) employed a free boundary, considered as a surface at constant pressure, to model the natural mass discharge from a horizontal porous layer heated from below. For a survey and bibliography about more recent applications to geophysics of convection in porous media, the reader may refer, for instance, to chapter 9 of the book by Turcotte & Schubert (Reference Turcotte and Schubert2014).
3. Stability analysis
By considering either Model A or Model B boundary conditions, a stationary solution of (2.1) is given by
 $$\begin{eqnarray}u_{b}=0,\quad v_{b}=Rx,\quad w_{b}=0,\quad T_{b}=x,\quad p_{b}=0,\end{eqnarray}$$
which is exactly the basic flow analysed by Gill (Reference Gill1969).
By perturbing the basic flow, (3.1), viz. by defining
 $$\begin{eqnarray}\boldsymbol{u}=\boldsymbol{u}_{b}+{\it\varepsilon}\tilde{\boldsymbol{u}},\quad p=p_{b}+{\it\varepsilon}\tilde{p},\quad T=T_{b}+{\it\varepsilon}\tilde{T},\end{eqnarray}$$
we may rewrite (2.1), (2.5) and (2.6) in terms of the fields
 $\tilde{\boldsymbol{u}}=(\tilde{u} ,\tilde{v},\tilde{w})$
,
 $\tilde{p}$
and
 $\tilde{T}$
, namely
 $$\begin{eqnarray}\displaystyle & \boldsymbol{{\rm\nabla}}\boldsymbol{\cdot }\tilde{\boldsymbol{u}}=0, & \displaystyle\end{eqnarray}$$
 $$\begin{eqnarray}\displaystyle & \tilde{\boldsymbol{u}}=-\boldsymbol{{\rm\nabla}}\tilde{p}+R\tilde{T}\hat{\boldsymbol{e}}_{y}, & \displaystyle\end{eqnarray}$$
 $$\begin{eqnarray}\displaystyle & \displaystyle \frac{\partial \tilde{T}}{\partial t}+Rx\frac{\partial \tilde{T}}{\partial y}+\tilde{u} ={\rm\nabla}^{2}\tilde{T}, & \displaystyle\end{eqnarray}$$
 $$\begin{eqnarray}\displaystyle & \left.\begin{array}{@{}lr@{}}x=\pm 1/2\!:\quad \tilde{u} =0,\tilde{T}=0 & \text{(Model A)},\\ x=\pm 1/2\!:\quad \tilde{p}=0,\tilde{T}=0 & \text{(Model B)},\end{array}\right\} & \displaystyle\end{eqnarray}$$
 $O({\it\varepsilon}^{2})$
are neglected according to the usual linearisation procedure.
We now simplify (3.3) by adopting a pressure/temperature formulation,
 $$\begin{eqnarray}\displaystyle & \displaystyle {\rm\nabla}^{2}\tilde{p}=R\frac{\partial \tilde{T}}{\partial y}, & \displaystyle\end{eqnarray}$$
 $$\begin{eqnarray}\displaystyle & \displaystyle \frac{\partial \tilde{T}}{\partial t}+Rx\frac{\partial \tilde{T}}{\partial y}-\frac{\partial \tilde{p}}{\partial x}={\rm\nabla}^{2}\tilde{T}, & \displaystyle\end{eqnarray}$$
 $$\begin{eqnarray}\displaystyle & \left.\begin{array}{@{}lr@{}}\displaystyle x=\pm 1/2\!:\quad \frac{\partial \tilde{p}}{\partial x}=0,\tilde{T}=0 & \text{(Model A)},\\ x=\pm 1/2\!:\quad \tilde{p}=0,\tilde{T}=0 & \text{(Model B)}.\end{array}\right\} & \displaystyle\end{eqnarray}$$
 $\tilde{p}$
and
 $\tilde{T}$
are given by
 $$\begin{eqnarray}\tilde{p}=f(x)\text{e}^{\text{i}(k_{y}y+k_{z}z)}\text{e}^{({\it\eta}-\text{i}{\it\omega})t},\quad \tilde{T}=h(x)\text{e}^{\text{i}(k_{y}y+k_{z}z)}\text{e}^{({\it\eta}-\text{i}{\it\omega})t}.\end{eqnarray}$$
Each normal mode is associated with a wavevector,
 $(k_{y},k_{z})$
, a wavenumber,
 $k=(k_{y}^{2}+k_{z}^{2})^{1/2}$
, a growth rate,
 ${\it\lambda}$
, and an angular frequency,
 ${\it\omega}$
. For the sake of brevity, we use the notation
 ${\it\lambda}={\it\eta}-\text{i}{\it\omega}$
. For the normal modes, (3.4) yield
 $$\begin{eqnarray}\displaystyle & f^{\prime \prime }-k^{2}f-\text{i}k_{y}Rh=0, & \displaystyle\end{eqnarray}$$
 $$\begin{eqnarray}\displaystyle & h^{\prime \prime }-(k^{2}+{\it\lambda}+\text{i}k_{y}Rx)h+f^{\prime }=0, & \displaystyle\end{eqnarray}$$
 $$\begin{eqnarray}\displaystyle & \left.\begin{array}{@{}lr@{}}x=\pm 1/2\!:\quad f^{\prime }=0,h=0 & \text{(Model A)},\\ x=\pm 1/2\!:\quad f=0,h=0 & \text{(Model B)},\end{array}\right\} & \displaystyle\end{eqnarray}$$
 $x$
.
As suggested by Rees (Reference Rees1988), general oblique modes can be mapped onto transverse modes
 $(k_{z}=0)$
by defining a rescaled Darcy–Rayleigh number,
 $$\begin{eqnarray}S=\frac{k_{y}}{k}R,\end{eqnarray}$$
so that (3.6) can be rewritten as
 $$\begin{eqnarray}\displaystyle & f^{\prime \prime }-k^{2}f-\text{i}kSh=0, & \displaystyle\end{eqnarray}$$
 $$\begin{eqnarray}\displaystyle & h^{\prime \prime }-(k^{2}+{\it\lambda}+\text{i}kSx)h+f^{\prime }=0, & \displaystyle\end{eqnarray}$$
 $$\begin{eqnarray}\displaystyle & \left.\begin{array}{@{}lr@{}}x=\pm 1/2\!:\quad f^{\prime }=0,h=0 & \text{Model A},\\ x=\pm 1/2\!:\quad f=0,h=0 & \text{Model B}.\end{array}\right\} & \displaystyle\end{eqnarray}$$
 $S\rightarrow 0$
thus defines longitudinal modes
 $(k_{y}=0)$
. The conclusion that longitudinal modes are equivalent to transverse modes having a vanishing Darcy–Rayleigh number suggests that these modes are always stable. A formal proof that this argument is correct is provided in § 3.2.
3.1. Gill’s proof revisited
We obtain the derivative of (3.8a
) with respect to
 $x$
, obtain
 $f^{\prime }(x)$
from (3.8b
) and substitute it into the derivative of (3.8a
), so that we can write a single fourth-order differential equation for
 $h(x)$
, namely
 $$\begin{eqnarray}\displaystyle & h^{\prime \prime \prime \prime }-(2k^{2}+{\it\lambda})h^{\prime \prime }-\text{i}kS(xh^{\prime })^{\prime }+k^{2}(k^{2}+{\it\lambda}+\text{i}kSx)h=0, & \displaystyle\end{eqnarray}$$
 $$\begin{eqnarray}\displaystyle & \left.\begin{array}{@{}lr@{}}x=\pm 1/2\!:\quad h=0,h^{\prime \prime }=0 & \text{Model A},\\ x=\pm 1/2\!:\quad h=0,h^{\prime \prime \prime }=(k^{2}+{\it\lambda}\pm \text{i}kS/2)h^{\prime } & \text{Model B}.\end{array}\right\} & \displaystyle\end{eqnarray}$$
 $\bar{h}$
, the complex conjugate of
 $h$
, and we integrate by parts over
 $-1/2<x<1/2$
using the boundary conditions
 $h(\pm 1/2)=0$
, common to both Model A and Model B. Thus, we obtain
 $$\begin{eqnarray}\displaystyle & & \displaystyle \bar{h}^{\prime }(-1/2)h^{\prime \prime }(-1/2)-\bar{h}^{\prime }(1/2)h^{\prime \prime }(1/2)+\int _{-1/2}^{1/2}|h^{\prime \prime }|^{2}\text{d}x+(2k^{2}+{\it\lambda})\int _{-1/2}^{1/2}|h^{\prime }|^{2}\text{d}x\nonumber\\ \displaystyle & & \displaystyle \quad +\,\text{i}kS\int _{-1/2}^{1/2}x(|h^{\prime }|^{2}+k^{2}|h|^{2})\text{d}x+k^{2}(k^{2}+{\it\lambda})\int _{-1/2}^{1/2}|h|^{2}\text{d}x=0.\end{eqnarray}$$
Since
 ${\it\lambda}={\it\eta}-\text{i}{\it\omega}$
, the real part of (3.10) gives
 $$\begin{eqnarray}{\it\gamma}+\int _{-1/2}^{1/2}(|h^{\prime \prime }|^{2}+2k^{2}|h^{\prime }|^{2}+k^{4}|h|^{2})\text{d}x=-{\it\eta}\int _{-1/2}^{1/2}(|h^{\prime }|^{2}+k^{2}|h|^{2})\text{d}x,\end{eqnarray}$$
where
 $$\begin{eqnarray}{\it\gamma}=\text{Re}[\bar{h}^{\prime }(-1/2)h^{\prime \prime }(-1/2)-\bar{h}^{\prime }(1/2)h^{\prime \prime }(1/2)].\end{eqnarray}$$
If Model A is adopted, then (3.9b
) ensures that
 ${\it\gamma}=0$
, so that (3.11) allows one to conclude that
 ${\it\eta}<0$
. This means that the growth rate of normal modes is always negative or, in other words, that the basic flow given by (3.1) is always stable. This conclusion completes the classical Gill’s proof of stability (Gill Reference Gill1969).
The important point is that there is no evidence that Gill’s proof can be extended to Model B. In fact, for Model B, the boundary conditions given by (3.9b
) do not allow one to draw any direct conclusion about
 ${\it\gamma}$
being negative, zero or positive. Hence, Gill’s method to prove stability becomes ineffective in this case.
3.2. Numerical solution
The lack of a formal proof of stability for Model B leaves open a possibility to investigate the stability or instability of the basic flow, (3.1), through a numerical solution of the eigenvalue problem given by (3.8).
This problem can be solved with a high numerical accuracy by combining the use of an initial value solver for ordinary differential equations and the shooting method. This mathematical technique is well documented in the literature (see, for instance, § 19.1 of the book by Straughan Reference Straughan2004). The procedure can be outlined in two steps:
-
(a) We transform the boundary value problem into an initial value problem by replacing (3.8c ) with
(3.13a−d )The last condition, $$\begin{eqnarray}f(-1/2)=0,\quad f^{\prime }(-1/2)={\it\xi}_{1}+\text{i}{\it\xi}_{2},\quad h(-1/2)=0,\quad h^{\prime }(-1/2)=1.\end{eqnarray}$$
$h^{\prime }(-1/2)=1$
, is meant to fix the otherwise arbitrary scale of the eigenfunctions, while
$({\it\xi}_{1},{\it\xi}_{2})$
are unknown real constants to be determined by the shooting method.
By prescribing the values of
$(k,S)$
and trying to guess the values of
$({\it\eta},{\it\omega},{\it\xi}_{1},{\it\xi}_{2})$
, the initial value problem given by (3.8a
), (3.8b
) and (3.13) can be solved by an explicit Runge–Kutta algorithm. -
(b) The shooting method is employed to compute the values of
$({\it\eta},{\it\omega},{\it\xi}_{1},{\it\xi}_{2})$
versus the input values
$(k,S)$
by satisfying the target conditions given by (3.8c
), namely
$f(1/2)=0$
and
$h(1/2)=0$
. The eigenfunctions
$f$
and
$h$
are complex-valued, so that the target conditions yield four real equations.


Both steps can be accomplished by using Mathematica 10 (© Wolfram Research, www.wolfram.com/mathematica), with function NDSolve providing the environment for step (a) and function FindRoot yielding the algorithm to implement step (b).
The most interesting quantity to be computed is
 ${\it\eta}$
, whose values can be traced, for a fixed
 $k$
, as
 $S$
increases starting from 0. In fact, the solution of (3.8) when
 $S\rightarrow 0$
can be obtained analytically. When
 $S\rightarrow 0$
, (3.8a
) with the boundary conditions (3.8c
) for Model B admits only the solution
 $f=0$
, so that
 $h$
can be determined by solving
 $$\begin{eqnarray}\displaystyle & h^{\prime \prime }-(k^{2}+{\it\eta}-\text{i}{\it\omega})h=0, & \displaystyle\end{eqnarray}$$
 $$\begin{eqnarray}\displaystyle & x=\pm 1/2\!:h=0. & \displaystyle\end{eqnarray}$$
 $$\begin{eqnarray}h(x)=\frac{1}{n{\rm\pi}}\sin \!\left[n{\rm\pi}\left(x+\frac{1}{2}\right)\right],\quad n=1,2,3,\dots ,\end{eqnarray}$$
with the dispersion relation
 $$\begin{eqnarray}k^{2}+{\it\eta}-\text{i}{\it\omega}+n^{2}{\rm\pi}^{2}=0,\quad n=1,2,3,\dots .\end{eqnarray}$$
Thus, on recalling that
 $f=0$
, (3.15) and (3.16) yield
 $$\begin{eqnarray}{\it\eta}=-k^{2}-n^{2}{\rm\pi}^{2},\quad {\it\omega}=0,\quad {\it\xi}_{1}=0,\quad {\it\xi}_{2}=0,\quad n=1,2,3,\dots .\end{eqnarray}$$
Equations (3.17) provide the initialisation of the numerical procedure, through steps (a) and (b) described above. With these steps, one evaluates
 $({\it\eta},{\it\omega},{\it\xi}_{1},{\it\xi}_{2})$
for any given
 $k$
and gradually increasing values of
 $S$
starting from
 $S=0$
.
As expected from (3.17), the values of the growth rate
 ${\it\eta}$
are initially negative, when
 $S$
is sufficiently small. The condition
 ${\it\eta}<0$
means stability. However, if
 $S$
becomes large enough positive values of
 ${\it\eta}$
are also found, meaning instability. As
 $k$
changes, one can draw the geometrical locus of the points where
 ${\it\eta}=0$
in the parametric plane
 $(k,S)$
. This locus is the neutral stability curve and it maps the boundary of the instability region.
Validation of the numerical solver: comparison between values of
 $({\it\eta},{\it\omega},{\it\xi}_{1},{\it\xi}_{2})$
obtained, for
 $k=1$
and
 $S=10$
, by an explicit fourth-order Runge–Kutta solver with either fixed step-size,
 ${\it\delta}x$
, or variable step-size determined adaptively.

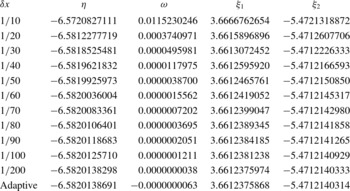
Table 1 reports a validation of the numerical procedure, for
 $k=1$
and
 $S=10$
. The assessment of the accuracy is made by comparing the numerical data
 $({\it\eta},{\it\omega},{\it\xi}_{1},{\it\xi}_{2})$
obtained by using either a fixed step-size specification in the explicit fourth-order Runge–Kutta solver or an adaptive method for variable step-size. The data reported are relative to the branch of normal modes displaying the largest growth rates,
 ${\it\eta}$
. On decreasing monotonically the value of the step-size
 ${\it\delta}x$
, table 1 shows that convergence to the data obtained with the adaptive method is attained within at least seven significant figures. The values of
 ${\it\omega}$
need a specific mention, as the numerical data suggest that
 ${\it\omega}$
is effectively zero, meaning that the normal mode is non-travelling. All the graphical and numerical results reported in the next section are obtained by the explicit fourth-order Runge–Kutta solver with an adaptive method for variable step-size.
4. Discussion of the results
4.1. Linear analysis
In order to establish the possible onset of unstable conditions in the parametric plane
 $(k,S)$
, we first study the change of the growth rate
 ${\it\eta}$
versus
 $S$
for fixed values of
 $k$
.
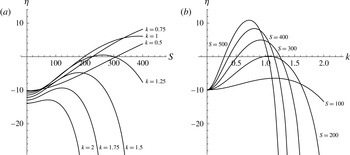
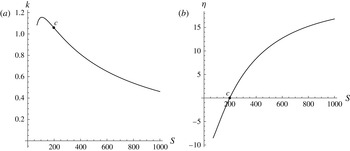
Growth rate plots are reported in figure 2. As for table 1, we examine data relative to the branch with the largest growth rates. Figure 2(a) displays plots of
 ${\it\eta}$
versus
 $S$
for fixed values of
 $k$
, while figure 2(b) shows plots of
 ${\it\eta}$
versus
 $k$
for fixed values of
 $S$
. In figure 2(a), wavenumbers ranging from 0.5 to 2 are considered. Starting from
 $k=0.5$
, we note that the growth rate
 ${\it\eta}$
starts from a negative value when
 $S=0$
(longitudinal rolls), then gradually increases and becomes positive when
 $S$
is greater than 308.427. The change of sign occurs with a smaller
 $S$
if
 $k=0.75$
, and with an even smaller
 $S$
when
 $k=1$
. The displayed behaviour is different if we consider
 $k=1.25$
or larger values of
 $k$
. In fact, with
 $k=1.25$
, the growth rate
 ${\it\eta}$
is initially negative and, as
 $S$
increases, it becomes positive within the range
 $222.588<S<299.943$
, then it becomes negative again and starts decreasing. This non-monotonic trend of
 ${\it\eta}$
versus
 $S$
is observed also with larger wavenumbers,
 $k=1.5,1.75,2$
, but the growth rate does not become positive in these cases. A common feature of the data reported in figure 2 is that the value of
 ${\it\omega}$
is zero, i.e. they are relative to non-travelling modes. We mention that this feature is not general as branches of stable travelling modes (
 ${\it\omega}\neq 0$
) arise outside the range reported in figure 2, where
 ${\it\eta}$
is lower than
 $-$
30. The existence of stable travelling modes had been previously reported by Rees (Reference Rees1988) with reference to Model A boundary conditions. Figure 2(a) suggests the existence of a maximum growth rate
 ${\it\eta}$
as a function of
 $S$
for a given
 $k$
. Likewise, there exists a maximum of function
 ${\it\eta}(k)$
for a given
 $S$
(figure 2
b). The conditions which yield the maximum growth rate
 ${\it\eta}(S)$
for a fixed
 $k$
, as well as those for the maximum growth rate
 ${\it\eta}(k)$
for a fixed
 $S$
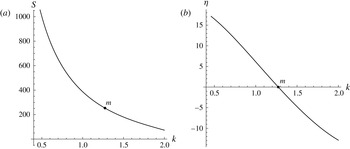
, are reported in figures 3 and 4. Both these figures show the pairs
 $(k,S)$
, or
 $(S,k)$
, of maximum growth rate, as well as the maximum growth rate plotted either versus
 $k$
or versus
 $S$
. Figures 3 and 4 show also the points,
 $m$
and
 $c$
, where the maximum of function
 ${\it\eta}(S)$
is zero and the maximum of function
 ${\it\eta}(k)$
is zero, respectively. These figures are useful to detect the fastest growing mode when either the wavenumber is prescribed (figure 3) or the parameter
 $S$
is prescribed (figure 4). The importance of the fastest growing linear mode in determining the development of convective instability has been recently pointed out by Hewitt, Neufeld & Lister (Reference Hewitt, Neufeld and Lister2013).
Model B: (a) growth rate
 ${\it\eta}$
versus
 $S$
for different wavenumbers
 $k$
; (b) growth rate
 ${\it\eta}$
versus
 $k$
for different
 $S$
.

Model B: line of maximum growth rate, for fixed
 $k$
, (a) in the plane
 $(k,S)$
and (b) in the plane
 $(k,{\it\eta})$
. Point
 $m$
denotes conditions where the maximum growth rate is zero, namely
 $k_{m}=1.27291$
and
 $S_{m}=253.340$
.

Model B: line of maximum growth rate, for fixed
 $S$
, (a) in the plane
 $(S,k)$
and (b) in the plane
 $(S,{\it\eta})$
. Point
 $c$
denotes conditions where the maximum growth rate is zero, namely
 $k_{c}=1.05950$
and
 $S_{c}=197.081$
.

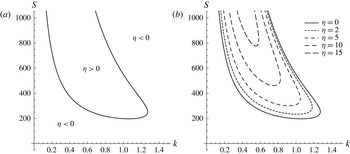
Figure 5(a) shows the neutral stability curve (
 ${\it\eta}=0$
), as well as the stability (
 ${\it\eta}<0$
) and instability (
 ${\it\eta}>0$
) regions in the plane
 $(k,S)$
. Figure 5(b) shows isolines of
 ${\it\eta}$
including not only the neutral stability curve (
 ${\it\eta}=0$
), but also some isolines with positive
 ${\it\eta}$
.
Model B: (a) neutral stability curve
 $S$
versus
 $k$
and (b) isolines of
 ${\it\eta}$
with
 ${\it\eta}\geqslant 0$
in the plane
 $(k,S)$
.

All neutrally stable modes are non-travelling, viz.
 ${\it\omega}=0$
. The neutral stability curve has a nose shape, and it displays a minimum at the critical conditions
 $k=k_{c}$
and
 $S=S_{c}$
, where
 $$\begin{eqnarray}k_{c}=1.05950,\quad S_{c}=197.081.\end{eqnarray}$$
Figure 5 also shows the existence of a maximum value of
 $k$
bounding the neutrally stable states; this maximum defines the tip of the nose and is placed at
 $$\begin{eqnarray}k_{m}=1.27291,\quad S_{m}=253.340.\end{eqnarray}$$
One can immediately realise that the pairs
 $(k,S)$
defined by (4.1) and (4.2) correspond to the points
 $c$
and
 $m$
displayed in figure 4 and figure 3, respectively. No unstable modes could be found when
 $k>k_{m}$
. Due to the definition of
 $S$
, given by (3.7), the critical value
 $S_{c}$
means that instability has its onset with transverse modes (
 $k_{y}=k$
) at a critical Darcy–Rayleigh number
 $R_{c}=197.081$
. Oblique modes (
 $k_{y}<k$
) are destabilised at higher critical Darcy–Rayleigh numbers, obtained by dividing
 $S_{c}$
by the ratio
 $k_{y}/k$
. This yields larger and larger critical values of
 $R$
as
 $k_{y}/k$
decreases starting from 1. Eventually, in the limiting case of longitudinal modes (
 $k_{y}\rightarrow 0$
), one obtains
 $R_{c}\rightarrow \infty$
, which means stability for this type of modes. In other words, Squire’s theorem selecting the two-dimensional transverse modes at onset of instability holds.
An example of a system where the instability defined by the critical conditions (4.1) manifests itself may come from geophysics. Let us consider a gravel layer with thickness
 $L=2~\text{m}$
and permeability
 $K=5\times 10^{-10}~\text{m}^{2}$
, saturated with groundwater,
 ${\it\nu}=10^{-6}~\text{m}^{2}~\text{s}^{-1}$
,
 ${\it\alpha}=10^{-7}~\text{m}^{2}~\text{s}^{-1}$
and
 ${\it\beta}=2\times 10^{-4}~\text{K}^{-1}$
. Instability,
 $R>R_{c}$
, occurs when the temperature difference across the layer is larger than 10 K.
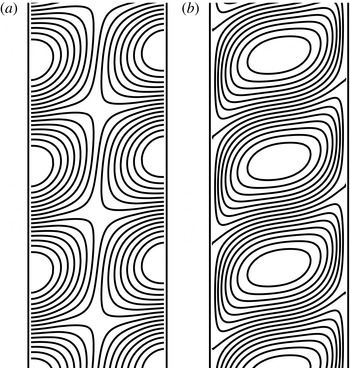
A sketch of the streamlines and isotherms for the secondary flow arising at onset of convection with
 $k_{c}=1.05950$
and
 $R_{c}=197.081$
is shown in figure 6. Due to the expression of normal modes, (3.5), the convection pattern forms a periodic sequence of alternate clockwise and counterclockwise cells, so that arrows are not strictly needed in order to understand the orientation of streamlines in figure 6. As discussed above, this secondary flow is through non-travelling transverse modes. One may see that the streamlines are cut by the boundaries, so that the secondary flow penetrates both the left external environment (
 $x<-1/2$
) and the right external environment (
 $x>1/2$
). Thus, one may question the reliability of Model B at supercritical conditions, where the growing disturbances achieve finite or large amplitudes. At supercritical conditions, imagining the external environments as quiescent reservoirs at uniform temperature and hydrostatic pressure distribution may be a poor model. In fact, the penetrating secondary flow is likely to induce inhomogeneities of the temperature and dynamic pressure distributions therein.
Model B: (a) streamlines and (b) isotherms of the secondary flow induced by transverse modes at onset of instability with the critical values
 $(k_{c},S_{c})$
, (4.1).

4.2. A few examples of the nonlinear regime
When the flow conditions are supercritical, i.e.
 $R>R_{c}$
, a nonlinear analysis is needed to trace the time evolution of finite-amplitude perturbations. This means that the full nonlinear governing equations (2.1) and (2.6) have to be solved. The solution can be sought numerically by employing a finite element method. An efficient tool for achieving this solution is COMSOL Multiphysics (© COMSOL Inc., www.comsol.com/comsol-multiphysics). The solution can be carried out with reference to transverse modes, so that the computational domain is two-dimensional. The domain defined for the solver is a rectangle in the
 $(x,y)$
-plane with
 $-1/2\leqslant x\leqslant 1/2$
and
 $-{\rm\Delta}y/2\leqslant y\leqslant {\rm\Delta}y/2$
. In the solution of the full nonlinear equations, the role of normal modes is different from that in the linear analysis. In fact, the nonlinear time evolution of a normal mode with wavenumber
 $k$
, prescribed at time
 $t=0$
, implies its mixing with all possible normal modes. Another aspect of the nonlinear evolution of unstable perturbations is the phenomenon of saturation. Saturation means that the initially exponential time-growth of the perturbation is damped, so that the growth rate decreases and it may even tend to 0 as
 $t\rightarrow \infty$
. In this case, the unbounded exponential growth predicted by the linear stability analysis is drastically modified in the nonlinear domain, thus leading to the prediction of asymptotic stationary states, different from the basic state, approached at large times. The phenomenon of saturation may also lead to the conclusion that the effects of instability are not always as remarkable as one would infer from the linear stability analysis. Before discussing a few sample cases in the supercritical regime, it is worth describing some details of the numerical solution. Periodicity conditions for pressure and temperature are prescribed at the end boundaries,
 $y=-{\rm\Delta}y/2$
and
 $y={\rm\Delta}y/2$
. An unstructured uniform mesh with triangular elements is defined in the computational domain. Two cases are studied, with
 ${\rm\Delta}y=4{\rm\pi}$
and
 ${\rm\Delta}y=8{\rm\pi}$
. With
 ${\rm\Delta}y=4{\rm\pi}$
the number of triangular elements is 12 630, while for
 ${\rm\Delta}y=8{\rm\pi}$
the number of elements is 25 184. The mesh refinement has been chosen so that the numerical results are mesh-independent within graphical resolution. In the four sample cases analysed, the time evolution tends to a stationary state different from the basic state.
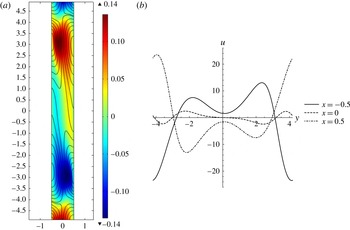
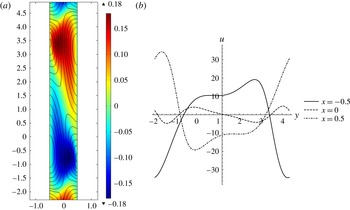
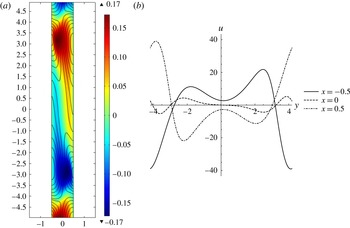
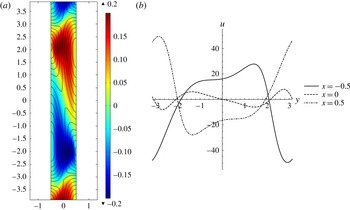
The four cases illustrated in figures 7–10 relate to
 $R=400$
and
 $R=500$
and, for each fixed value of
 $R$
, they describe different patterns along the vertical
 $y$
direction. In fact, we assigned different values of
 ${\rm\Delta}y$
, namely
 ${\rm\Delta}y=8{\rm\pi}$
and
 ${\rm\Delta}y=4{\rm\pi}$
, to explore different periods of the cellular patterns. The region plotted in figures 7(a)–10(a) is not the whole range of
 $y$
, but approximately one period. In these frames, the colour map of the temperature perturbation, viz. the difference between the temperature and the temperature in the basic state, is plotted together with the streamlines of the perturbation velocity, namely the excess velocity with respect to the basic state. Figures 7(b)–10(b) display the horizontal velocity component,
 $u$
, as a function of
 $y$
for
 $x=-1/2,0,1/2$
. We recall that
 $u=0$
in the basic state, so that this velocity component arises from the perturbation of the basic state. In the four cases examined, the streamlines show a natural mass discharge/recharge to/from the external environments. Like the phenomenon reported in the paper by Elder (Reference Elder1967), the lateral mass flux is not a very intense effect, both for
 $R=400$
and for
 $R=500$
. In fact, the maximum values of
 $u$
at the lateral boundaries are slightly greater than 20 (figure 7) or 30 (figure 8), when
 $R=400$
, and around 40 (figure 9) or slightly greater (figure 10), when
 $R=500$
. A reference value to estimate these maximum values of
 $u$
is the maximum vertical velocity in the basic state, that is
 $R/2$
. This is 200, for figures 7 and 8, and 250, for figures 9 and 10. The temperature perturbation is comparable with the basic state temperature, as the maxima in the colour maps are not much less than half the maximum temperature in the basic state, namely
 $T=1/2$
.
Asymptotic steady state for
 $t\rightarrow \infty$
in the nonlinear regime with
 $R=400$
and
 ${\rm\Delta}y=8{\rm\pi}$
: (a) colour map over one period of the temperature perturbation with superposed streamlines of the velocity perturbation in the
 $(x,y)$
-plane; (b) plot over one period of the horizontal velocity component
 $u$
as a function of
 $y$
at different fixed values of
 $x$
.

Asymptotic steady state for
 $t\rightarrow \infty$
in the nonlinear regime with
 $R=400$
and
 ${\rm\Delta}y=4{\rm\pi}$
: (a) colour map over one period of the temperature perturbation with superposed streamlines of the velocity perturbation in the
 $(x,y)$
-plane; (b) plot over one period of the horizontal velocity component
 $u$
as a function of
 $y$
at different fixed values of
 $x$
.

A final remark concerns the periodicity of the patterns as related to the prescribed values of
 ${\rm\Delta}y$
. One may notice that, when
 ${\rm\Delta}y=8{\rm\pi}$
(figures 7 and 9), three periods are allowed over the height of the computational domain. On the other hand, when
 ${\rm\Delta}y=4{\rm\pi}$
(figures 8 and 10), two periods are allowed. With reference to the case
 $R=400$
, there is a simple physical argument justifying this pattern selection. In fact, over a height of
 $8{\rm\pi}$
with periodic end conditions, allowed normal modes are such that
 $k=n/4$
, where
 $n=1,2,3,\dots .$
Over a height of
 $4{\rm\pi}$
, allowed normal modes are with
 $k=n/2$
. Figure 2(b) reveals that, with
 $R=400$
, the linear mode of type
 $k=n/4$
with the largest growth rate is for
 $n=3$
, while the fastest growing mode with
 $k=n/2$
is for
 $n=2$
. This explains why the three-period pattern is preferred for a height of
 $8{\rm\pi}$
, while the two-period pattern is preferred for a height of
 $4{\rm\pi}$
. On the other hand, this reasoning does not work properly when
 $R=500$
. In fact, by employing the data reported in figure 2(b), the linear mode of type
 $k=n/4$
with the largest growth rate is again for
 $n=3$
, but the fastest growing mode with
 $k=n/2$
is for
 $n=1$
. Therefore, one should expect that a one-period pattern is selected when the height is
 $4{\rm\pi}$
, unlike what is found by the nonlinear analysis. An explanation of the ineffectiveness of the fastest growing linear mode in determining the periodicity of the actual nonlinear pattern is related to the highly supercritical regime taking place at
 $R=500$
. In this regime, the nonlinear dynamics prevails so that the fastest growing linear mode is unable to drive the pattern selection mechanism.
Asymptotic steady state for
 $t\rightarrow \infty$
in the nonlinear regime with
 $R=500$
and
 ${\rm\Delta}y=8{\rm\pi}$
: (a) colour map over one period of the temperature perturbation with superposed streamlines of the velocity perturbation in the
 $(x,y)$
-plane; (b) plot over one period of the horizontal velocity component
 $u$
as a function of
 $y$
at different fixed values of
 $x$
.

Asymptotic steady state for
 $t\rightarrow \infty$
in the nonlinear regime with
 $R=500$
and
 ${\rm\Delta}y=4{\rm\pi}$
: (a) colour map over one period of the temperature perturbation with superposed streamlines of the velocity perturbation in the
 $(x,y)$
-plane; (b) plot over one period of the horizontal velocity component
 $u$
as a function of
 $y$
at different fixed values of
 $x$
.

The nonlinear analysis in the supercritical regime carried out so far has definitely no aim of generality. There is much more work to do for an exhaustive investigation of this regime. An open question is, for instance, the multiplicity of periodic cellular structures that are allowed in the asymptotic steady states approached when
 $t\rightarrow \infty$
. In this regard, the role of the end conditions set at the extrema of the
 $y$
-range needs further investigation. In particular, an interesting point is the description of what may happen if the periodic end conditions, at
 $y=-{\rm\Delta}y/2$
and
 $y={\rm\Delta}y/2$
, are replaced by impermeability and thermal insulation conditions. This alternative may be appropriate in order to model a vertical slab with a finite height.
5. Conclusions
The linear stability of the conduction regime in a vertical porous slab saturated by a fluid is reconsidered on the basis of a different formulation of the velocity boundary conditions. The boundaries are assumed to be permeable to external environments in motionless states with a hydrostatic pressure distribution. This assumption replaces the hypothesis of impermeable boundaries invoked in other classical treatments of the same flow regime (Gill Reference Gill1969). The basic natural convection flow, stationary and parallel, is not influenced by the altered boundary conditions. On the other hand, it has been proved that the linear stability analysis changes dramatically as a consequence of the different model for the boundaries. The extent of this change has been assessed in two stages.
-
(a) Gill’s proof of stability, for the case of impermeable boundaries, has been restated without forcing any assumption about the velocity boundary conditions. Thus, it has been shown where this proof may fail if the boundaries are considered as permeable instead of impermeable.
-
(b) A numerical solution of the eigenvalue stability problem has been employed to obtain the growth rates of the three-dimensional perturbations superposed on the basic flow. It is shown that, on increasing the value of the Darcy–Rayleigh number,
$R$
, the growth rates turn from negative (stability) to positive (instability). A suitable Squire-like transformation allowed us to identify the transverse modes as the selected modes at onset of instability. The neutral stability curve has been obtained. Its minimum at a Darcy–Rayleigh number equal to 197.081 yields the critical condition for the onset of instability with transverse modes. -
(c) A few examples have been discussed where the full nonlinear governing equations have been solved to investigate the supercritical regime,
$R>R_{c}$
. Saturation of the growth rates has been pointed out, showing that spatially periodic steady states different from the basic state can be approached at large times. In these steady states, natural mass discharge to the external fluid environments is observed, even if the local values of velocity normal to the free boundaries are definitely smaller than the basic vertical velocity.


This study has shown the dramatic effect of a change in the velocity boundary conditions on the stability of the basic flow in a vertical porous slab. Modifying the boundaries from impermeable to permeable implies that the same basic state, instead of being always stable, may become unstable.
Acknowledgements
This research has been carried out with the financial support provided by Alma Mater Studiorum Università di Bologna with FARB and FIBRA grants.