Implications
The study of prebiotics as an alternative to antibiotics in animal production is an actual and important topic considering the severe restriction of the European Union due to the antibiotic resistance of several bacteria. In rabbit production, mannanoligosaccharides (MOS) are considered promising prebiotics. The confirmation of MOS as a valuable alternative to antibiotics can reduce the environmental and social impacts of rabbit production, giving greater confidence to consumers, with potential positive economic impact for the rabbit industry.
Introduction
The post-weaning period is very critical in rabbit, in particular under intensive production, where often the periodic sanitary void is not actuated and high bacterial contamination frequently occurs. In these conditions, the digestive system of young rabbits can be considered in a not-stable balance, which, in combination with ambient factors (diet, environment and management stressors as indicated by Casagrande-Proietti et al., Reference Casagrande-Proietti, Dal Bosco, Hilbert, Franciosini and Castellini2009), can increase rabbit susceptibility to post-weaning digestive disorders. Specific pathogens such as Escherichia coli O103 or Clostridium spiriforme can lead to high mortality rate after weaning (> 20%; Peeters et al., Reference Peeters, Maertens, Orsenigo and Colin1995) even if the most common disorder in rabbit production is the occurrence of an enteritis complex (epizootyc rabbit enteropathy), which is the first cause of mortality in European rabbit industry (Dewree et al., Reference Dewree, Licois, Coudert, Lassence, Vindevogel and Marlier2003). To prevent post-weaning digestive disorders, prophylactic antimicrobial medication is normally used in growing rabbits. However, the large use of antibiotics in animal production can result in the occurrence of antibiotic-resistant bacteria (Falcao-e-Cunha et al., Reference Falcao-e-Cunha, Castro-Solla, Maertens, Marounek, Pinheiro, Freire and Mourao2007). As a consequence, the European community on January 2006 banned the use of antibiotic as growth promoter (EC Reg. 1831/2003). Prebiotics and in particular mannanoligosaccharides (MOS), derived from the outer cell wall of the yeast Saccharomyces cerevisiae, are considered promising alternative to antibiotics (Kocher, Reference Kocher2006). Several authors investigated the effect of MOS v. antibiotics on in vivo rabbit performance (mortality and growth rates, feed intake), but did not find significant differences (Fonseca et al., Reference Fonseca, Falcao, Kocher and Spring2004; Pinheiro et al., Reference Pinheiro, Alves, Mourao, Guedes, Pinto, Spring and Kocher2004; Mourao et al., Reference Mourao, Pinheiro, Alves, Guedes, Pinto, Saavedra, Spring and Kocher2006). Recently, Guedes et al. (Reference Guedes, Mourao, Silva, Gomes, Rodrigues and Pinheiro2009) found that the addition of 2.0 g/kg MOS to the diet increased volatile fatty acids (VFAs) concentration in the caecum of growing rabbits, but Pinheiro et al. (Reference Pinheiro, Guedes, Outor-Monteiro and Mourao2009) observed that 1.0 g MOS/kg was not able to reduce the negative effect of low fibre diets on rabbit growth performance. However, all the above-mentioned studies (Fonseca et al., Reference Fonseca, Falcao, Kocher and Spring2004; Pinheiro et al., Reference Pinheiro, Alves, Mourao, Guedes, Pinto, Spring and Kocher2004 and Reference Pinheiro, Guedes, Outor-Monteiro and Mourao2009; Mourao et al., Reference Mourao, Pinheiro, Alves, Guedes, Pinto, Saavedra, Spring and Kocher2006; Guedes et al., Reference Guedes, Mourao, Silva, Gomes, Rodrigues and Pinheiro2009) showed that the addition of MOS to the diets resulted in a better intestinal integrity and had a protective effect against common pathogens. MOS are able to bind the mannose receptors on the type 1 fimbriae of some pathogen bacteria (as E. coli and Salmonella enteritidis) in order to prevent their attachment to intestinal mucosa (Firon et al., Reference Firon, Ofek and Sharon1983; Spring et al., Reference Spring, Wenk, Dawson and Newman2000). Because of their interaction with microbes, MOS could have an effect on microbial components of intestinal microflora and/or on their activity.
The in vitro gas production technique (IVGPT) was recently used in rabbits in order to study feed digestibility in the caecum (Stanco et al., Reference Stanco, Di Meo, Piccolo and Nizza2003) as well as to assay the fermentative activity of caecal microbiota (Bovera et al., Reference Bovera, D’Urso, Di Meo, Piccolo, Calabrò and Nizza2006) and the correlation between microbial populations of caecal content and faeces (Bovera et al., Reference Bovera, Calabrò, Cutrignelli, Infascelli, Piccolo, Nizza, Tudisco and Nizza2008 and Reference Bovera, D’Urso, Di Meo, Tudisco and Nizza2009). The aim of this study was to evaluate the effect of diet supplementation with different levels of MOS (0.5, 1.0 and 1.5 g/kg of diet) compared with antibiotic supplementation on rabbit caecal microbial fermentations using the IVGPT.
Material and methods
Animals and diets
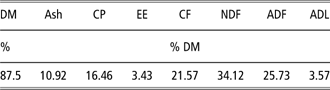
An adaptation period to experimental diets, between 35 and 60 days of age, was carried out on a rabbit commercial farm in Benevento, South of Italy (41°16′0″ N, 14°55′0″ E, 667 metres a.s.l.). In all, 40 animals from a total population of 2736 hybrid Hyla rabbits weighing on average 751.7 ± 56.0 g and weaned at 35 days of age (684 per group) were randomly divided among four groups (40 rabbits per group) hosted in the same building, in bicellular cages (26 × 46 × 35 cm height, two rabbits per cage, 20 cages per group). At the beginning of the trial, another negative control group fed the basal diet without antibiotics or MOS supplementation was performed, but it was discarded from the trial after 2 weeks due to the very high percentage of mortality rate (78%) and the severe symptoms of the disease (diarrhoea) in the survivor animals. The basal diet was analysed for dry matter (method number 934.01, Association of Official Analytical Chemists (AOAC), 2004), ether extract, ash, crude protein and crude fibre (method number 945.18, AOAC, 2004), acid detergent fibre and acid detergent lignin (method number 973.18, AOAC, 2004) and amylase-treated neutral detergent fibre (method number 2002.04, AOAC, 2004). Rabbits were submitted to the following treatments: ANT (antibiotic group, positive control) fed the basal diet (Table 1) supplemented with antibiotics (colistin sulphate, 144 mg/kg; tylosin, 100 mg/kg; and oxytetracyclin, 1000 mg/kg); MOS_0.5, MOS_1.0 and MOS_1.5 fed the basal diet with 0.5, 1.0 and 1.5 g/kg MOS, respectively (Bio-Mos®, Alltech Biotechnology, USA); negative control fed the basal diet without antibiotics or MOS supplementation. Diets and water were administered ad libitum along the trial.
Chemical composition of the basal diet

DM = dry matter; CP = crude protein; EE = ether extract; CF = crude fibre; NDF = neutral detergent fibre; ADF = acid detergent fibre; ADL = acid detergent lignin.
Ingredients: dehydrated alfalfa meal, wheat middling, sunflower meal, alfalfa hay, maize, sugar cane molasses, toasted soybean meal, calcium carbonate and salt and soybean oil.
In vitro gas production trial
The basal diet (without antibiotics or MOS supplementation) was used as substrate to evaluate the fermentative characteristics of rabbit caecal contents. Cumulative gas production was measured according to the IVGPT method (slightly modified) proposed by Theodorou et al. (Reference Theodorou, Williams, Dhanoa, McAllan and France1994) . For each substrate, 1 g of sample (in triplicate per inoculum) was accurately weighed in a 120 ml serum flask and 75 ml of anaerobic buffered modified (without tripticase peptone) medium D (Theodorou, Reference Theodorou1993), and 4 ml of reducing solution were added. The flasks were sealed with butyl rubber stoppers and aluminium crimp seals and incubated at 39°C until inoculation.
The samples of inocula (caecal contents) were collected in the late morning (1130 h) in a specialised slaughter house on 10 rabbits per group, at 60 days of age from four groups: ANT, MOS_0.5, MOS_1.0 and MOS_1.5. From the night before slaughter, feed was removed and water was available.
Once the whole gastrointestinal tract had been isolated, the individual caecal contents were collected and put into pre-warmed thermos, filled to the brim in order to keep air content to a minimum. After sampling, the material was transported as soon as possible (about 1 h) to the laboratories. In the laboratory, 100 ml of each caecal content were diluted with 100 ml of anaerobic medium, stirred for 5 min and strained through six layers of gauze under CO2. The retained solids were then mixed with 100 ml of medium and homogenised in a blender for 20 s under CO2. The homogenate was then re-strained through six layers of gauze; the resulting liquid was combined with the other strained fluid and held at 39°C under CO2 until use (final dilution 2 : 1 medium/caecal content; (Bovera et al., Reference Bovera, D’Urso, Di Meo, Piccolo, Calabrò and Nizza2006).
The time taken to prepare caecal inocula was around 30 min. A syringe fitted with an 18-gauge (1.2 mm) needle was used to inject 10 ml of caecal fluid into each flask. Before inoculation, the displaced gas was allowed to escape and after inoculation the flasks were placed in an incubator at 39°C for 120 h. Three flasks per inoculum were prepared without substrate and used as blank to correct data relative to gas production, organic matter digestibility (OMd) and VFA production.
Gas measurements and analysis at the end of incubation
Gas production was recorded at the following intervals post-inoculation: 2, 4, 6, 9, 12, 14, 17, 21, 24, 29, 33, 37, 43, 48, 54, 68, 77, 96 and 120 h. Initial readings were taken at 2-h intervals due to the rapid rate of gas production. The gas measurements were made using a pressure transducer connected to a three-way stopcock. The first outlet was connected to a pressure transducer, the second to a disposable plastic syringe and the third to a 23-gauge (0.6 mm) needle. Pressure readings (Pa) were taken by inserting the needle, connected to the three-way stopcock, through the stopper by withdrawing the accumulated gas in a syringe until the transducer display unit showed zero (equal to ambient pressure) and the volume of gas produced was measured. The gas was discarded and the flasks, after stirring, returned to the incubator. At the end of incubation (120 h), the flasks were placed at 4°C to terminate fermentation. The pH of each flask was recorded (Alessandrini Instrument glass electrode, Jenway, Dunmow, UK; model 3030) and two samples, each of about 10 ml of liquid were collected and frozen before VFA (acetate (Ace), propionate (Prop), butyrate (Buty), isobutyrate, valeriate and isovaleriate) and NH3 analyses. Substrate digestibility was estimated by filtering the residues using pre-weighed sintered glass crucibles (Schott Duran, porosity 2, Mainz, Germany) under vacuum. Residue dry matter was determined by drying to a constant weight at 103°C, and OM by difference following ashing (5 h at 550°C). Cumulative volumes of gas after 120 h of incubation were expressed as percentage of the grams of OM incubated and digested to obtain the OM cumulative volume (OMCV) and the yield of OM (YOM), respectively.
After centrifugation and dilution of the samples with oxalic acid (1 : 1 v/v), the VFAs were analysed by a gas chromatography method (ThermoElectron mod. 8000top, FUSED SILICA Gaschromatograph (ThermoElectron Corporation, Rodano, Milano, Italy) with OMEGAWAX 250 fused silica capillary column 30 m × 0.25 mm × 0.25 mm film thickness; analysis temperature, 125°C; flame ion detector, 185°C; and carrier helium, 1.7 ml/min; (Stanco et al., Reference Stanco, Di Meo, Piccolo and Nizza2003)).
Branched chain proportion (BCP), a valuable index of protein digestion, was determined as the sum of isobutyrate and isovaleriate divided by the total VFA production.
NH3 was determined according to the method described by Searle (Reference Searle1984). In short, the samples, after centrifugation at 610.5 × g for 10 min at room temperature (about 22°C), were diluted 10 times with water and then 1 ml of the product was deproteinised using 10% trichloro-acetic acid. NH3 and phenol were oxidised by sodium hypochlorite in the presence of sodium nitroprusside to form a blue complex. The intensity was measured colorimetrically at a wavelength of 623 nm. Intensity of the blue is proportional to the concentration of NH3 present in the sample.
Stoichiometric calculation
The theoretical gas production and OM fermentation were estimated according to Groot et al. (Reference Groot, Williams, Oostdam, Boer and Tamminga1998) and were based on the stoichiometric balance equations of Van Soest (Reference Van Soest1994) by the use of the VFA production measured at the end of fermentation. OM fermentation was expressed in glucose equivalents (g), gases and acids in moles. It was assumed that the glucose equivalents were fermented to form the end products: Ace, Prop and Buty and the gases CO2 and CH4, as well as being incorporated into microbial biomass. From the stoichiometric equations it can be calculated that:


The glucose consumption for production of VFA and gases (OM fermented (OMf)) was calculated as:

The OMf, as percentage of digested OM (g), was the yield of fermented OM (YF). The yield of OM utilised for microbial synthesis (YM, %) was estimated as 100 (YF, %; Groot et al., Reference Groot, Williams, Oostdam, Boer and Tamminga1998).
Curve fitting and statistical analysis
The data from cumulative gas production were fitted to the equation of Groot et al. (Reference Groot, Cone, Williams, Debrasques and Lantinga1996):

where G (ml/g OM) is the amount of gas produced per gram of incubated OM; A (ml/g OM) is the potential gas production; B (h) is the time after incubation at which half of A has been reached; c is a constant determining the curve sharpness. The maximum degradation rate (R max, ml/h) and the time at which it occurs (T max, h) were calculated according to the following equations (Bauer et al., Reference Bauer, Williams, Voigt, Mosenthin and Verstegen2001):


All the fermentative characteristics were analysed by ANOVA (SAS, 2000) using the model:

where Y is the single observation; μ is the general mean; I is the inocula effect and ε is the error.
Differences among means were evaluated by Tukey test (SAS, 2000).
Results
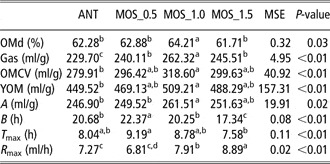
Table 2 shows the average fermentation characteristics of the four inocula. MOS_1.0 group showed the highest (P < 0.05) OMd at the end of fermentations. No differences were recorded among the other three groups. In addition, the cumulative gas production (Gas) was significantly (P < 0.05) higher for MOS_1.0 inoculum. No differences were recorded between MOS_0.5 and MOS_1.5 groups, while ANT group showed the significantly (P < 0.05) lowest value. When gas production was related to OM incubated (OMCV) or fermented (YOM), no significant differences were observed among MOS groups, but MOS_1.0 showed a significantly higher gas production than ANT inoculum. Potential gas production (A) was similar to MOS_1.0 and 1.5 groups, but MOS_1.0 group had average A value higher than the MOS_0.5 and ANT groups.
Organic matter digestibility, gas production and fermentation kinetics of the tested inocula

ANT = inoculum from rabbits fed antibiotics; MOS_0.5, 1.0 e 1.5 = inocula from rabbits fed MOS at 0.5, 1.0 e 1.5 g/kg, respectively; OMd = organic matter digestibility; OMCV = cumulative volume of gas by incubated organic matter; YOM = cumulative gas production by digested organic matter; A = potential gas production; B = time at which A/2 is produced; R max = maximum fermentation rate; T max = time at which R max is reached; MSE = mean square error.
a,b=P < 0.05.
MOS_1.5 group showed the highest (P < 0.05) fermentation rate (R max) followed by MOS_1.0 and both MOS_0.5 and ANT groups in which fermentation rates are statistically different at P < 0.05. MOS_0.5 group showed a slower (P < 0.05) fermentation kinetic (highest value of B and T max).
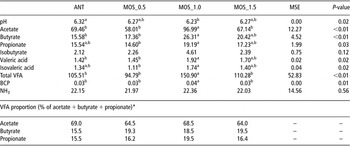
Table 3 reports the pH and the end products of the fermentation by inoculum. MOS_1.0 had significantly lower value of pH than ANT group. Great differences were recorded for VFA production. MOS_1.0 inoculum showed the highest production of Ace, being 39% and 44% higher than ANT and MOS_1.5 groups, respectively. The lowest value of Ace was recorded for MOS_0.5 group. No differences were recorded between MOS_1.5 and ANT groups. Butyric acid was produced in higher level by caecal content from rabbits of MOS_1.0 group, but no significant differences were observed in comparison with MOS_1.5 group. The same trend was observed for Prop. MOS_1.0 group showed higher production of isovaleric and valeric acids than MOS_0.5 and ANT groups (P < 0.05) and similar to MOS_1.5 group. No differences were observed on isobutyric acid. However, BCP index resulted significantly (P < 0.05) higher for MOS_1.0 group. No differences were recorded among the other groups. No differences were recorded for NH3 levels.
pH, volatile fatty acids (mmol/g OM) and NH3 (mmol/l) productions

OM = organic matter; VFA = volatile fatty acids; BCP = branched chain proportion; MOS_0.5, 1.0 e 1.5 = inocula from rabbits fed MOS at 0.5, 1.0 e 1.5 g/kg, respectively; ANT = inoculum from rabbits fed antibiotics; MSE = mean square error.
a,b = P < 0.05.
*Calculated on average values, statistical elaboration not possible.
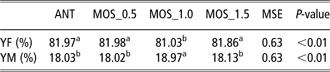
Table 4 shows the yield of OM utilised for YM (%) or for fermentations (YF, %). MOS_1.0 group showed the higher production of microbial biomass and, as a consequence, the lowest amount of OMf.
Yield of fermented organic matter (YF) and yield of organic matter for microbial synthesis (YM) by groups

MOS_0.5, 1.0 e 1.5 = inocula from rabbits fed MOS at 0.5, 1.0 e 1.5 g/kg, respectively; ANT = inoculum from rabbits fed antibiotics; MSE = mean square error.
a,b = P < 0.05.
Discussion
The higher percentage of OMd obtained with MOS_1.0 inoculum, accompanied, in general, by a significantly higher production of gas, indicates that caecal microflora selected with the diet contained 1 g/kg of MOS have a higher fermentative activity in respect of the carbohydrate sources of the diet. The higher production of Ace with MOS_1.0 inoculum (Table 3) indicates a more intense fermentation of structural carbohydrates (in particular, cellulose). In fact, it is known (Van Soest, Reference Van Soest1993) that acetic acid production is from the fermentation of cellulolytic bacteria, while Buty and Prop are from non-structural carbohydrates fermentations. It is important to observe that during fermentations, mainly Ace and Buty synthesis contribute to gas production. In fact, the fermentation of 1 mole of glucose to Ace results in the production of 1 mole of CO2 and 1 mole of CH4, and the fermentation to Buty results in the production of 1.5 mole of CO2 and 0.5 mole of CH4. On the other hand, the fermentation of 1 mole of glucose to Prop does not result in a net production of CO2 and requires a net input of reducing equivalents, resulting in a decrease in CH4 production (Ungerfeld and Kohn, Reference Ungerfeld and Kohn2006). Thus, the significantly higher productions of Ace and Buty obtained with MOS_1.0 inoculum can justify the significantly higher gas production and strongly suggest a higher fermentation activity of microflora of both structural and non-structural carbohydrates. If we consider the sum of the three principles that VFA produced along the fermentations in rabbit caecum (acetate, butyrate and propionate) and express the average value of each one as a percentage of this sum (Table 3), the proportion of these VFA can be compared with the data reported in the literature. Taking into account that, per 100 moles of VFA produced, 60 to 80 are Ace, 8 to 20 are Buty and 3 to 10 are Prop (Gidenne, Reference Gidenne1996), in our trial the four-tested inocula showed the following proportion among Ace, Buty and Prop: 69 : 15.5 : 15.5 for ANT inoculum; 64.5 : 19.3 : 16.2 for MOS_0.5 inoculum; 68.5 : 18.5 : 13 for MOS_1.0 inoculum and 64 : 19.5 : 16.4 for MOS_1.5 inoculum. According to this report, two interesting considerations can be made: first, MOS_1.0 inoculum showed the best proportion among the main VFA at the end of fermentation; second, MOS_0.5 and MOS_1.5 inocula showed very similar proportions. This, according to not many differences among gas and VFA productions, suggests a similar bacterial activity for the two inocula.
MOS_1.0 inoculum also showed a more intense fermentative activity in respect of protein contained in the diet. This assertion comes from the observation of the significantly higher BCP value recorded for MOS_1.0 inoculum. Since isobutyrate, isovaleric and valeric acids are produced, respectively, from degradation of the amino acids valine, leucine and proline (Van Soest, Reference Van Soest1994), their higher production suggests higher protein degradation (Bovera et al., Reference Bovera, D’Urso, Calabrò, Tudisco, Di Meo and Nizza2007). In addition, NH3 is an end product of protein fermentation, but it is used for bacteria, in combination with carbon chains produced from carbohydrates fermentation to synthesise new amino acids for bacterial growth (Van Soest, Reference Van Soest1994). NH3 content is not statistically different among groups. Thus, in the case of MOS_1.0 inoculum not only the fermentations of proteins and carbohydrates are more intensive but also there is, probably, a better synchronism in both carbohydrate and protein fermentation that allow to bacteria to dispose of both carbon chains and NH3 for their protein synthesis and thus for increasing bacterial biomass. This is confirmed by the data reported in Table 4. MOS_1.0 inoculum showed significantly higher values of predicted OM used for YM and, as a consequence, significantly lower value of YF, estimated by VFA concentration, than the other groups. The caecal microbial population of MOS_1.0 group showed different fermentative activities: one from ANT group and the other from MOS group, as referred. Compared to the ANT group, this difference could be explained by a different effect of MOS and antibiotics on microbial population of the intestine. Antibiotics can improve sanitary status of hindgut reducing subclinical infections through pathogens killing. However, when large-spectrum antibiotics were used, as in our trial, negative effects can involve saprophyte bacteria (Kocher, Reference Kocher2006). MOS are able to bind receptors on type 1 fymbriae of some pathogens reducing their attachment to intestinal mucosa and improving intestinal environment for endogenous bacteria (Griggs and Jacob, Reference Griggs and Jacob2005).
On the basis of our results, the concentration of MOS in the diet is not strictly related to their effect on microbial fermentations. It is easy to hypothesise that MOS at 0.5 g/kg of diet is a not-sufficient concentration to create the better condition for caecal endogenous micro-organisms. It is more difficult to explain why the dose of 1.5 g/kg of MOS had no similar or more favourable effects on microbial fermentations of 1.0 g/kg. Surely this result need to be further investigated. However, we can hypothesise that at the highest dose, MOS can interact also with saprophyte flora-inducing modifications in hindgut microbial population or fermentative activity. In our previous research using the same experimental design of this experiment in which also an episode of epizootyc rabbit enteropathy occurs (Bovera et al., Reference Bovera, Nizza, Marono, Maliardo, Piccolo, Tudisco, De Martino and Nizza2010), 1.0 g/kg of MOS was the best level to reduce mortality rate and modify the composition of anaerobic bacterial population, while no differences were recorded in mortality rate between groups fed 0.5 and 1.5 g of MOS per kilogram of diet. In the same trial, rabbits fed MOS at 1.0 g/kg showed the apparent digestibility coefficient of OM, measured by the acid insoluble ash method, higher than the other groups probably due to a better development of intestinal villi. In the present trial, it was not possible to study the morphology structure of intestinal mucosa, however, considering that Buty is the preferred energy substrate for colonocytes (Marty and Vernay, Reference Marty and Vernay1984), and the higher level of Buty produced by MOS_1.0 inoculum can justify a better intestinal environment and then a better absorption of nutrients.
Mourao et al. (Reference Mourao, Pinheiro, Alves, Guedes, Pinto, Saavedra, Spring and Kocher2006), who measured VFA concentration in caecal content of rabbits at 46 days of age, recorded higher proportion of Ace and Buty in rabbits fed 1.0 g/kg of MOS in respect of antibiotics, while the concentration of the same VFAs is lower when MOS were used at 1.5 or 2.0 g/kg. However, the authors did not comment this result.
Conclusions
MOS are able to make positive changes in microbial fermentative activity of caecal content measured by IVGPT. However, the effect of MOS increases with their concentration in the diet up to 1.0 g/kg, being not advantageous increases the concentration to higher values. Since effects of 0.5 g/kg of MOS were similar to that of antibiotics, we can hypothesise that this concentration can be used with positive effect on microbial caecal fermentations. However, the level of 1.0 g/kg seems to have the best effect on microbial fermentations giving more efficient feed utilisation.