





Significant outcomes
-
• In this prospective, real-world comparison of clinically similar inpatients with chronic schizophrenia, the addition of ECT to pharmacotherapy was not accompanied by a detectable change in serum TBARS levels, and the magnitude of change did not differ from that seen with pharmacotherapy alone.
-
• Serum TBARS levels were inversely related to age and to illness duration, which is compatible with lipid peroxidation being more prominent in earlier stages of the disorder in this population.
-
• A history of suicide was the only clinical variable independently associated with baseline TBARS levels, an exploratory signal that may help identify subgroups for future oxidative stress research.
Limitations
-
• The observational design with non-randomised treatment allocation and a small sample (n = 38) leaves room for residual confounding, most notably the higher frequency of clozapine use in the ECT group, and limits the power to detect modest effects.
-
• Oxidative status was captured by a single, non-specific peripheral marker measured at only two time points, without complementary antioxidant indices or sampling between ECT sessions, so transient or cumulative changes and central nervous system processes may have gone undetected.
-
• Concurrent antipsychotic treatment other than clozapine, smoking, and other peripheral influences on lipid peroxidation could not be fully modelled, so the reported associations should be regarded as hypothesis-generating rather than confirmatory.
Introduction
Schizophrenia and oxidative stress
Despite the fact that schizophrenia is one of the most extensively researched psychiatric disorders, the underlying pathophysiological mechanisms of the disorder are still not completely clarified. The prevailing hypothesis regarding the aetiology of schizophrenia is that changes in multiple risk genes, each of which has a small effect, interact with environmental factors to affect both early and late brain development (Lewis & Lieberman, Reference Lewis and Lieberman2000; Harrison & Weinberger, Reference Harrison and Weinberger2005; Jaaro-Peled et al., Reference Jaaro-Peled, Hayashi-Takagi, Seshadri, Kamiya, Brandon and Sawa2009). The oxidative stress mechanism is one of the biological processes that has garnered more attention in recent years in the etiopathogenesis of schizophrenia among these intricate gene–environment interactions (Reddy & Yao, Reference Reddy and Yao1996; Bitanihirwe & Woo, Reference Bitanihirwe and Woo2011). When endogenous reactive oxygen species and reactive nitrogen species generated by regular oxidative metabolism or pro-oxidant environmental exposure are not balanced and controlled by cellular antioxidant defence mechanisms, oxidative stress occurs (Berg et al., Reference Berg, Youdim and Riederer2004). Elevated oxidative stress metabolites induce lipid peroxidation, resulting in damage to cell membranes and organelles, ultimately culminating in cell death (Kwon et al., Reference Kwon, Masutani, Nakamura, Ishii and Yodoi2003). Despite making up only around 2% of the body weight, the brain consumes more than 20% of oxygen. Consequently, the brain is highly susceptible to oxidative injury due to its high energy requirements, polyunsaturated fatty acid composition, and relatively low antioxidant capacity (Dringen, Reference Dringen2000; McQuillen & Ferriero, Reference McQuillen and Ferriero2004; Sultana et al., Reference Sultana, Piroddi, Galli and Butterfield2008). These characteristics suggest that oxidative stress may play a role in the etiopathogenesis of schizophrenia via influencing brain functions. Despite the inherent methodological differences and heterogeneity of results in the literature, numerous studies support a relationship between oxidative stress and schizophrenia. In addition to studies showing that antioxidant enzyme levels are lower in people with schizophrenia than in healthy people (Dadheech et al., Reference Dadheech, Mishra, Gautam and Sharma2008; Raffa et al., Reference Raffa, Mechri, Othman, Fendri, Gaha and Kerkeni2009), some studies have reported no significant difference in these levels (Srivastava et al., Reference Srivastava, Barthwal, Dalal, Agarwal, Nag, Srimal, Seth and Dikshit2001), and some have even reported an increase (Kunz et al., Reference Kunz, Gama, Andreazza, Salvador, Ceresér, Gomes, Belmonte-De-Abreu, Berk and Kapczinski2008). A meta-analysis evaluating oxidative stress markers in patients with schizophrenia showed that Thiobarbituric acid reactive substances (TBARS) and nitric oxide (NO) levels were higher than in healthy controls (Zhang et al., Reference Zhang, Zhao, He and Wan2010). Reports indicate that patients with schizophrenia who are not taking medication exhibit dysfunctions in the antioxidant system, which are partially ameliorated following antipsychotic treatment (Xuan et al., Reference Xuan, Pan, Qiu, Yang, Su, Liu, Chen, Feng, Fang and Jia2011). Malondialdehyde (MDA), the final product of lipid peroxidation, serves as a significant indication of oxidative stress and is often quantified using the TBARS method (Janero, Reference Janero1990; Sarandol et al., Reference Sarandol, Kirli, Akkaya, Altin, Demirci and Sarandol2007). Studies have shown that the levels of MDA and TBARS in the plasma, serum and red blood cells of patients with schizophrenia are higher than in healthy people (Herken et al., Reference Herken, Uz, Özyurt, Söğüt, Virit and Akyol2001; Zhang et al., Reference Zhang, Tan, Cao, Wu, Xu, Shen and Zhou2006). By contrast, research examining the impact of antipsychotic therapies on oxidative parameters has produced inconsistent results. Some studies have reported that antipsychotic medication reduces MDA levels (Dakhale et al., Reference Dakhale, Khanzode, Khanzode, Saoji, Khobragade and Turankar2004; Al-Chalabi et al., Reference Al-Chalabi, Thanoon and Ahmed2009), while others have found no significant change in TBARS levels (Huang et al., Reference Huang, Liou and Lin2010). A study involving animals indicated that haloperidol elevated brain TBARS levels, while clozapine did not produce this effect (Reinke et al., Reference Reinke, Martins, Lima, Moreira, Dal-Pizzol and Quevedo2004).
Electroconvulsive therapy and oxidative stress
Electroconvulsive therapy (ECT) has been utilised in clinical practice as an efficacious therapeutic modality, especially for schizophrenia patients who exhibit insufficient response to antipsychotics, in instances of catatonia, or in critical circumstances (Ward et al., Reference Ward, Szabo and Rakesh2018; Aoki et al., Reference Aoki, Tajika, Suwa, Kawashima, Yasuda, Shimizu, Uchinuma, Tominaga, Tan, Koh, Tor, Nikolin, Martin, Kato, Loo, Kinoshita, Furukawa and Takekita2024). The mechanisms behind the therapeutic effects of ECT remain incompletely understood. In experimental animal studies, electroconvulsive shock (ECS), which is used as a model of ECT (Öngür et al., Reference Öngür, Pohlman, Dow, Eisch, Edwin, Heckers, Cohen, Patel and Carlezon2007), has demonstrated variable effects on oxidative stress markers. While certain studies have indicated that ECS increases oxidative stress (Patel, Reference Patel2002), others have suggested that it reduces lipid peroxidation (Barichello et al., Reference Barichello, Bonatto, Agostinho, Reinke, Moreira, Dal-Pizzol, Izquierdo and Quevedo2004a) or produces no change (Jornada et al., Reference Jornada, Feier, Barichello, Vitali, Reinke, Gavioli, Dal-Pizzol and Quevedo2007). Of course, these animal studies do not cover disorders such as schizophrenia, which can cause stress in the brain. In addition, inconsistent findings may be accounted for by differences in experimental conditions (e.g. oxygenation level, single or repeated administration, timing). The controlled administration of ECT in clinical practice, which aims to regulate pathological processes rather than mimic spontaneous epileptic activity, may produce different outcomes compared to those observed in animal models. Similarly inconsistent findings have been obtained in the small number of clinical studies conducted on patients with depression or schizophrenia. One study reported no significant changes in MDA and NO levels in patients with depression undergoing ECT, while a decrease in superoxide dismutase activity was observed (VıRıT et al., Reference VıRıT, Dalkilic, Bulut, Bülbül, Altinda, Armutcu, Koçoğlu, Citak and Asuman2010). Another study observed a decrease in serum levels of reactive oxygen species, such as NO, after ECT (Atagun et al., Reference Atagun, Atay, Balaban, Ipekcioglu, Alpugan, Yalcin, Senat, Karamustafalioglu, Ilnem and Erel2021). A study investigating the impact of ECT on schizophrenia patients using antipsychotics indicated that ECT significantly reduced MDA levels without adversely affecting oxidative stress markers (Kartalci et al., Reference Kartalci, Karabulut, Ozcan, Porgali and Unal2011). These findings suggest that ECT may affect oxidative processes through different mechanisms beyond therapeutic seizures.
Aim of the study
The aim of this study is to compare the effects of pharmacological treatment and ECT on oxidative stress in patients with schizophrenia, and to evaluate whether the addition of ECT to pharmacological treatment has an additional impact on oxidative stress parameters. It was hypothesised that patients with schizophrenia who received ECT would show a significant change in TBARS levels compared to those receiving pharmacological treatment alone, indicating an alteration in oxidative stress processes.
Methods
Sample and study design
This prospective, observational, comparative study included patients admitted to the psychiatry clinic of Ankara Bilkent City Hospital for inpatient treatment due to a psychotic episode. The study does not include a healthy control group. The inclusion criteria for the study were defined as being aged between 18 and 65, having received at least five years of education, and meeting the diagnostic criteria for schizophrenia according to DSM-5. The following are among the exclusion criteria: accompanying intellectual disability; autoimmune or chronic inflammatory diseases; cancer; pregnancy; active infection; use of anti-inflammatory or immunosuppressive drugs; alcohol or substance abuse; and the presence of severe cardiac, renal, or pulmonary disease.
The decision as to whether patients would receive pharmacotherapy alone or pharmacotherapy plus ECT was made by the treating psychiatrist as part of routine clinical practice. The researchers had no influence over the decision to administer ECT or the treatment plan. All ECT sessions were conducted in a clinical setting using a Thymatron System IV device (Somatics, LLC, Lake Bluff, IL, USA) with bilateral electrode placement. Anaesthesia was induced with intravenous thiopental sodium (3–5 mg/kg), and muscle relaxation was achieved with rocuronium bromide (0.6 mg/kg). The treatment was administered three times per week, with each patient receiving a total of eight to twelve sessions. The number of ECT sessions varied according to individual clinical decisions but typically fell within this range. Seizure activity was monitored using both motor and electroencephalographic (EEG) parameters. Stimulus dosing was determined according to routine clinical practice, with adjustments made based on individual seizure threshold and clinical response. Seizure duration (motor and EEG-recorded) was documented for each session as part of routine clinical monitoring. Detailed EEG recordings were stored in clinical records but were not included in the present analysis, as they were beyond the scope of the study.
The authors assert that all procedures contributing to this work comply with the ethical standards of the relevant national and institutional committees on human experimentation and with the Helsinki Declaration of 1975, as revised in 2008. The study was approved by the Ankara Bilkent City Hospital Clinical Research Ethics Committee, (Approval number: TABED 1-24-306). Written informed consent was obtained from all participants or their legal representatives prior to inclusion in the study. All procedures were conducted in accordance with the principles of Good Clinical Practice.
Data collection tools
An experienced psychiatrist obtained a complete medical and psychiatric history from all patients on the first day of hospitalisation. The data collection tools were administered, and a physical examination and routine laboratory tests were performed.
Sociodemographic data form
This form, created by researchers, includes variables such as patients’ age, sex, educational status, employment status, smoking status, age at onset of illness, duration of illness (months), total number of psychotic episodes, clozapine use, history of suicide, family history of psychiatric disorders, and total number of hospitalisations.
Positive and negative syndrome scale (PANSS)
This is a structured measure that was developed in 1987 by Stanley Kay, Lewis Opler and Abraham Fiszbein in order to assess the severity of symptoms in patients with schizophrenia (Kay et al., Reference Kay, Fiszbein and Opler1987). The scale consists of thirty items in total: seven positive symptoms, seven negative symptoms and sixteen items measuring general psychopathology. Each item is scored from 1 to 7. The Turkish validity and reliability of the scale was established by Kostakoğlu et al. (Reference Kostakoğlu, Batur, Tiryaki and Göğüş1999). No cut-off point was calculated in the validity and reliability study conducted for the Turkish version of the scale. Therefore, it is only useful for comparative studies.
Clinical global impression scale (CGI)
Developed by the U.S. National Institute of Mental Health and published in 1976, this scale is used in clinical research to assess severity of illness, improvement, and side effect intensity (Guy, Reference Guy1976). This study used severity of illness and improvement scores.
Biochemical measurement
Blood samples were collected from patients who met the inclusion criteria on the first (at admission) and last (at discharge) days of hospitalisation. Blood samples for measuring serum TBARS levels were collected from patients after they had fasted for at least 8 hours, between 8:00 and 9:00 a.m. The blood samples were then centrifuged at 4000 × g for 10 minutes and the separated sera stored in Eppendorf tubes at −80°C until the day of analysis. TBARS levels were measured using an ELISA kit (Sunlong Biotech, Hangzhou, China) and analysed with a microplate reader. All measurements were performed in duplicate, and the mean values were used for analysis. The intra-assay and inter-assay coefficients of variation (%CV) of the kit were determined as <10% and <12%, respectively. Results were expressed in nmol/L.
Statistical analyses
All data were analysed using SPSS 28.0 (IBM Corp., Armonk, NY, USA). The distribution of continuous variables was assessed with the Shapiro–Wilk test, which indicated a non-normal distribution; therefore, non-parametric tests were applied. Descriptive variables, particularly demographic characteristics, were presented as mean ± standard deviation to provide a general overview of the sample. However, the distribution of variables was assessed, and since most variables were not normally distributed, non-parametric tests were used for statistical analyses. The Mann–Whitney U test was used to compare continuous variables between two independent groups, and the Wilcoxon signed-rank test was applied for paired measurements. Categorical variables were analysed using the Pearson chi-square (χ2) test. Results are presented as median and interquartile range (IQR), with minimum and maximum values reported in tables.
TBARS levels were measured for each patient before and after ECT, and the paired data were visualised in a scatter plot, with individual values connected by grey lines. To prevent clustering of high values, the y-axis was presented on a logarithmic scale. TBARS units are expressed in nmol/L, and increases/decreases were highlighted using red and blue colours. Statistical analyses and visualisations were performed using Python (version 3.11), employing the pandas, matplotlib, and seaborn libraries. Group comparisons of percentage TBARS changes were conducted using the Mann–Whitney U test. Statistical significance was set at p < 0.05 for all analyses.
Results
Description of the sociodemographic and clinical characteristics of the sample
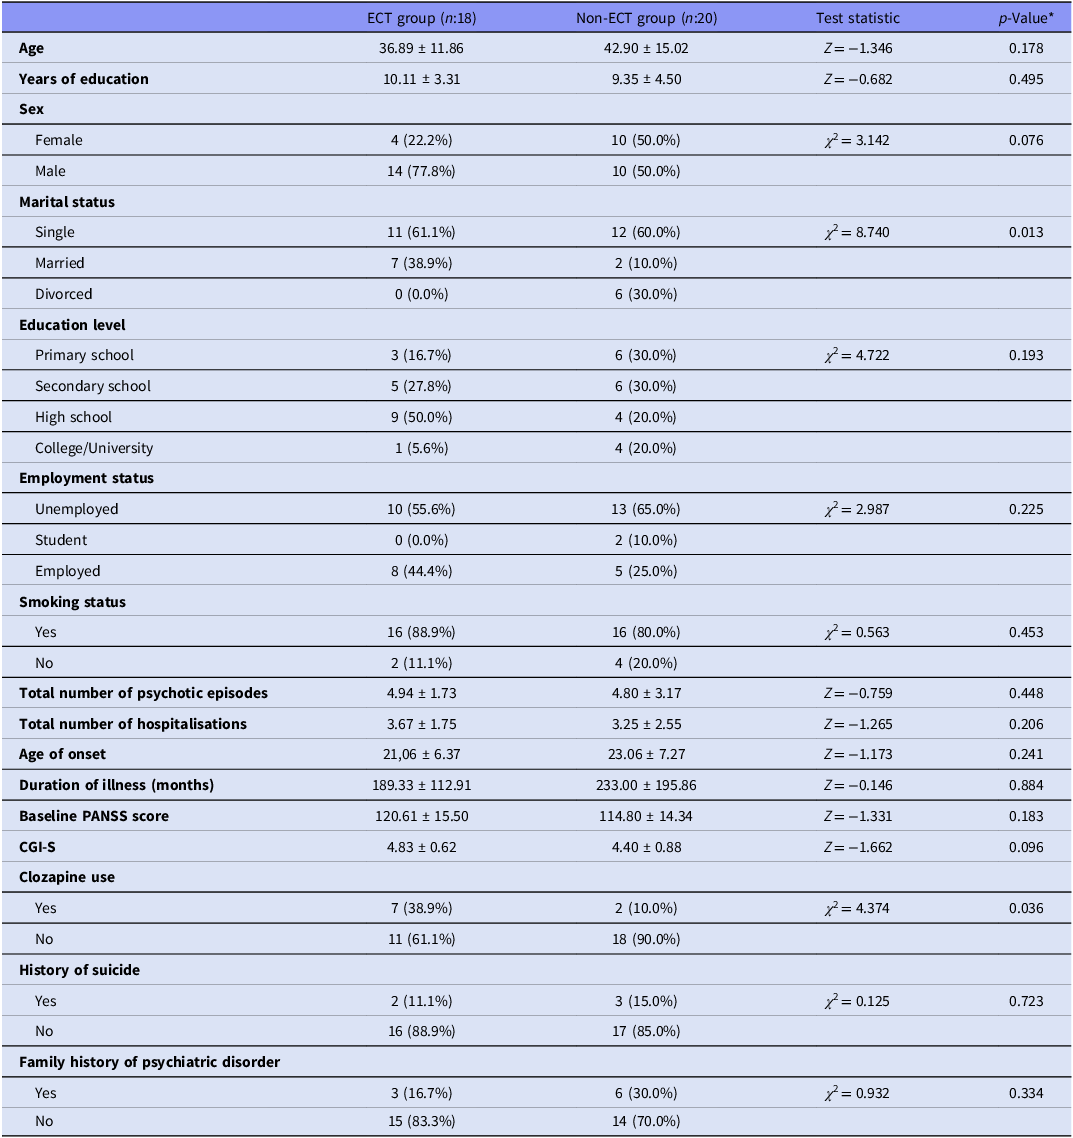
A total of 38 patients with schizophrenia were included in the study, of whom 18 received ECT, while 20 did not receive ECT and were treated pharmacologically. The mean age of the study population was 39.9 ± 13.9 years, with 24 males (63.2%) and 14 females (36.8%). The mean age at illness onset was 22.3 ± 6.8 years, and the mean total duration of illness was 211.4 ± 162.3 months. When comparing the 18 patients who received ECT with the 20 patients who did not receive ECT, no significant differences were observed in age (Z = –1.346, p = 0.178), age at illness onset (Z = –1.173, p = 0.241), total illness duration (Z = –0.146, p = 0.884), or pre-ECT PANSS scores (Z = –1.331, p = 0.183).
The proportion of patients using clozapine was 38.9% (7/18) in the ECT group and 10.0% (2/20) in the non-ECT group, which was statistically significant (χ 2 = 4.374, p = 0.036). No significant differences were found between the ECT and non-ECT groups regarding sex, educational level, employment status, smoking status, history of suicide, or family history of psychiatric disorders.
The demographic and clinical characteristics of patients receiving ECT and those not receiving ECT are summarised in Table 1.
Demographic and clinical characteristics of patients receiving ECT and those not receiving ECT

Table 1. Long description
The table compares demographic and clinical characteristics of patients receiving ECT and those not receiving ECT. It has 18 rows and 10 columns. The columns are labeled as ECT group (n=18), Non-ECT group (n=20), Test statistic, and p-Value. The rows are labeled as Age, Years of education, Sex, Marital status, Education level, Employment status, Smoking status, Total number of psychotic episodes, Total number of hospitalisations, Age of onset, Duration of illness (months), Baseline PANSS score, CGI-S, Clozapine use, History of suicide, and Family history of psychiatric disorder. Each row provides specific values for the ECT and Non-ECT groups, along with corresponding test statistics and p-values. Notable trends include differences in marital status, education level, clozapine use, and family history of psychiatric disorder between the two groups.
* Mann–Whitney U test for continuous variables; Pearson chi-square test for categorical variables.
PANSS, positive and negative syndrome scale; CGI-S, clinical global impression – severity of illness; ECT, electroconvulsive therapy.
Changes in TBARS levels in the group receiving ECT in addition to pharmacotherapy
In patients receiving ECT (n = 18), TBARS levels were evaluated before and after treatment. The median TBARS level before ECT was 756.5 nmol/L (IQR: 391.8), and after ECT it was 768.5 nmol/L (IQR: 505.5), with no statistically significant difference observed between pre- and post-ECT TBARS levels (Z = –1.136; p = 0.256). Changes in TBARS levels among patients receiving ECT are illustrated in Figure 1.
Changes in TBARS levels in patients receiving ECT.

Changes in TBARS levels in the group receiving pharmacotherapy alone
In patients not receiving ECT (n = 20), TBARS levels were evaluated on the day of hospitalisation and after hospitalisation. The median TBARS level on the day of hospitalisation was 644.0 nmol/L (IQR: 499.2), and after treatment it was 693.5 nmol/L (IQR: 343.5), with no statistically significant difference observed (Z = –1.512; p = 0.130). Changes in TBARS levels among patients not receiving ECT are illustrated in Figure 2.
Changes in TBARS levels in non-ECT group.

Figure 2. Long description
Panel A: A line graph shows TBARS levels before and after treatment. The horizontal axis is labeled ‘Measurement Time’ with two points: ‘Before’ and ‘After’. The vertical axis is labeled ‘TBARS Level’ with a range from 0 to 3500. Two data lines are present: one red line indicating ‘TBARS increased’ and one blue line indicating ‘TBARS decreased’. The red line shows an upward trend from before to after treatment, while the blue line shows a slight downward trend. Panel B: A table summarizes TBARS measurements at admission and discharge. The table includes columns for ‘TBARS Measure’, ‘At admission’, ‘At discharge’, ‘Z’, and ‘P value’. The ‘TBARS (nmol per mL)’ row shows interquartile ranges and minimum-maximum values for both admission and discharge. The ‘Z’ value is -1.512, and the ‘P value’ is 0.130.
Comparison of changes in TBARS levels between the two groups
Median TBARS levels were compared between patients who received ECT (n = 18) and those who did not (n = 20). On the day of hospitalisation median TBARS levels were 756.5 nmol/L in the ECT group and 644.0 nmol/L in the non-ECT group. After the treatment median levels were 768.5 nmol/L and 693.5 nmol/L, respectively. Mann–Whitney U tests indicated no significant differences between the groups at either time point (Z = –1.389, p = 0.165; Z = –0.307, p = 0.759 respectively). Comparison of TBARS Levels on the Day of Hospitalisation and After Treatment Between ECT and Non-ECT Groups are presented in Table 2.
Comparison of TBARS levels on the day of hospitalisation and after treatment between ECT and non-ECT groups

Table 2. Long description
A table comparing TBARS levels between ECT and non-ECT groups at admission and discharge. The table has 4 rows and 7 columns. Column headers are TBARS (nmol/L), Groups, Median, IQR, Min, Max, and Test statistic. Row labels are At admission and At discharge. At admission, ECT group has a median of 756.5, IQR of 391.8, Min of 433, Max of 4196, and Test statistic of Z = -1.389. Non-ECT group has a median of 644, IQR of 499.3, Min of 392, Max of 2983, and Test statistic of Z = -1.389. At discharge, ECT group has a median of 768.5, IQR of 505.5, Min of 492, Max of 5096, and Test statistic of Z = -0.307. Non-ECT group has a median of 693.5, IQR of 343.5, Min of 471, Max of 3496, and Test statistic of Z = -0.307.
* Mann–Whitney U Test.
The percentage change in TBARS levels from before treatment to post-treatment was similar between patients who received ECT (n = 18) and those who did not (n = 20) (mean rank: 18.78 vs. 20.15; Z = –0.380, p = 0.704). The mean percentage change was 9.64% (SD = 27.76%; range: –32.98% to 71.01%) in the ECT group and 15.34% (SD = 31.58%; range: –29.76% to 74.26%) in the non-ECT group, with median values of 5.59% and 10.10%, respectively. The percentage change in TBARS levels from before to after treatment in patients who received ECT and those who did not is shown in Figure 3.
Changes in TBARS levels: comparison between ECT and non-ECT groups.

Analysis of the relationship between TBARS levels and clinical variables
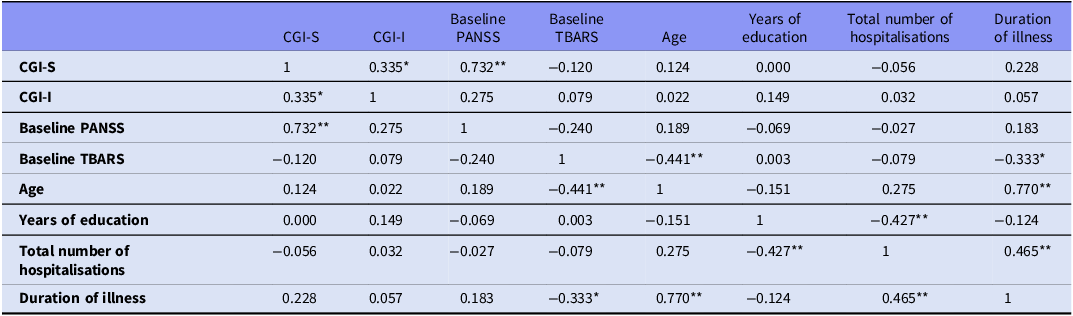
Spearman correlation analysis was conducted to evaluate the relationship between clinical and biochemical parameters in a total of 38 patients with schizophrenia. The analysis revealed no significant correlation between TBARS levels and CGI–Severity of illness (ρ = –0.120, p = 0.471). No significant correlation was found between TBARS levels and baseline PANSS scores (ρ = –0.240, p = 0.147). TBARS levels were found to be moderately and negatively correlated with age (ρ = –0.441, p = 0.006) and total duration of illness (ρ = –0.333, p = 0.041). A statistically significant negative correlation was found between years of education and total number of hospitalisations (ρ = –0.427, p = 0.008). The correlation analysis between TBARS levels and clinical variables in patients with schizophrenia is presented in Table 3.
Correlation analysis between TBARS levels and clinical variables in patients with schizophrenia (n = 38)

Table 3. Long description
A table with 8 rows and 9 columns showing correlation coefficients between TBARS levels and clinical variables in schizophrenia patients. The columns are labeled CGI-S, CGI-I, Baseline PANSS, Baseline TBARS, Age, Years of education, Total number of hospitalisations, and Duration of illness. Each row represents the correlation coefficient between the corresponding variables. Notable correlations include a moderate negative correlation between Baseline TBARS and Age (-0.441), and a significant negative correlation between Years of education and Total number of hospitalisations (-0.427).
PANSS, positive and negative syndrome scale; CGI-S, clinical global impression – severity of illness; CGI-I, clinical global impression – improvement.
Values represent Spearman correlation coefficients. * p < 0.05, ** p < 0.01.
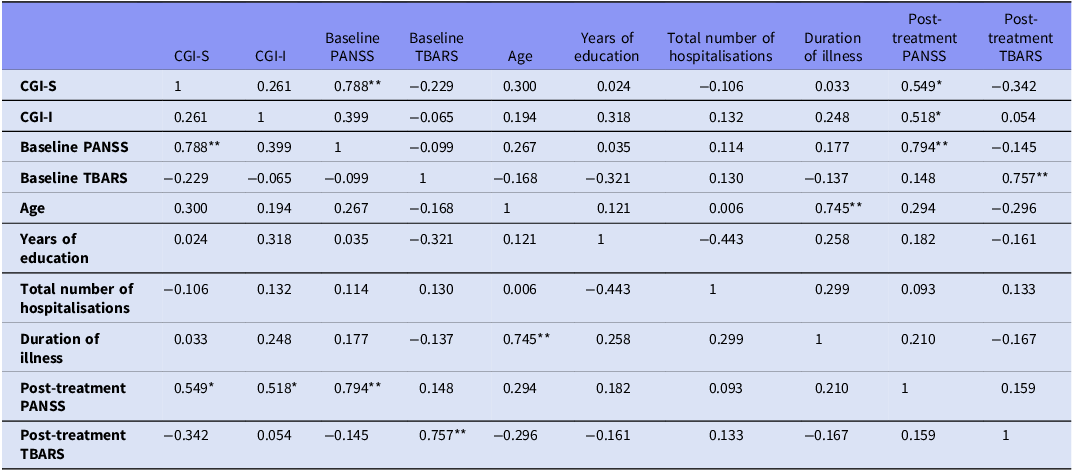
In the correlation analysis conducted to evaluate the relationships between clinical and biochemical parameters in 18 patients with schizophrenia who received ECT, a strong positive correlation was found between CGI–Severity of illness and baseline PANSS scores (ρ = 0.788, p < 0.001). Additionally, moderate positive correlations were observed between CGI–Severity of illness and post-ECT PANSS scores (ρ = 0.549, p = 0.018) and between CGI–Improvement and post-ECT PANSS scores (ρ = 0.518, p = 0.028). At the biochemical level, a strong positive correlation was found between pre-ECT and post-ECT TBARS levels (ρ = 0.757, p < 0.001). In addition, a strong positive correlation was observed between age and duration of illness (in months) (ρ = 0.745, p < 0.001). The correlation analysis between TBARS levels and clinical variables in patients with schizophrenia who received ECT (n = 18) is presented in Table 4. Correlation analysis revealed no significant association between TBARS changes and PANSS scores. However, a significant negative correlation was observed between TBARS change and CGI improvement (ρ = –0.404, p = 0.012).
Correlation analysis between TBARS levels and clinical variables in patients with schizophrenia who received ECT (n = 18)

Table 4. Long description
A table with 10 rows and 10 columns showing correlation analysis between TBARS levels and clinical variables in patients with schizophrenia. The columns are labeled as CGI-S, CGI-I, Baseline PANSS, Baseline TBARS, Age, Years of education, Total number of hospitalisations, Duration of illness, Post-treatment PANSS, and Post-treatment TBARS. Each row represents the correlation coefficient between the corresponding variables. Row 1: CGI-S, 1, 0.261, 0.788**, -0.229, 0.300, 0.024, -0.106, 0.033, 0.549*, -0.342. Row 2: CGI-I, 0.261, 1, 0.399, -0.065, 0.194, 0.318, 0.132, 0.248, 0.518*, 0.054. Row 3: Baseline PANSS, 0.788**, 0.399, 1, -0.099, 0.267, 0.035, 0.114, 0.177, 0.794**, -0.145. Row 4: Baseline TBARS, -0.229, -0.065, -0.099, 1, -0.168, -0.321, 0.130, -0.137, 0.148, 0.757**. Row 5: Age, 0.300, 0.194, 0.267, -0.168, 1, 0.121, 0.006, 0.745**, 0.294, -0.296. Row 6: Years of education, 0.024, 0.318, 0.035, -0.321, 0.121, 1, -0.443, 0.258, 0.182, -0.161. Row 7: Total number of hospitalisations, -0.106, 0.132, 0.114, 0.130, 0.006, -0.443, 1, 0.299, 0.093, 0.133. Row 8: Duration of illness, 0.033, 0.248, 0.177, -0.137, 0.745**, 0.258, 0.299, 1, 0.210, -0.167. Row 9: Post-treatment PANSS, 0.549*, 0.518*, 0.794**, 0.148, 0.294, 0.182, 0.093, 0.210, 1, 0.159. Row 10: Post-treatment TBARS, -0.342, 0.054, -0.145, 0.757**, -0.296, -0.161, 0.133, -0.167, 0.159, 1.
PANSS, positive and negative syndrome scale; CGI-S, clinical global impression – severity of illness; CGI-I, clinical global impression – improvement; ECT, electroconvulsive therapy.
Values represent Spearman correlation coefficients. * p < 0.05, ** p < 0.01.
Baseline TBARS levels were compared by sex, smoking status, and history of suicide attempt using the Mann–Whitney U test. No significant differences were observed for sex (median 756.5 vs. 706.5, Z = –0.696, p = 0.486), smoking (median 731.5 vs. 598.0, Z = –1.441, p = 0.149), or suicide history (median 1100.0 vs. 721.0, Z = –1.274, p = 0.203). Similarly, no significant differences in TBARS levels were observed between smokers and non-smokers at discharge (p = 0.138). In addition, TBARS levels were compared between patients using clozapine and those not using clozapine. No significant differences were observed at baseline (Z = –1.442, p = 0.149) or post-treatment (Z = –0.756, p = 0.450).
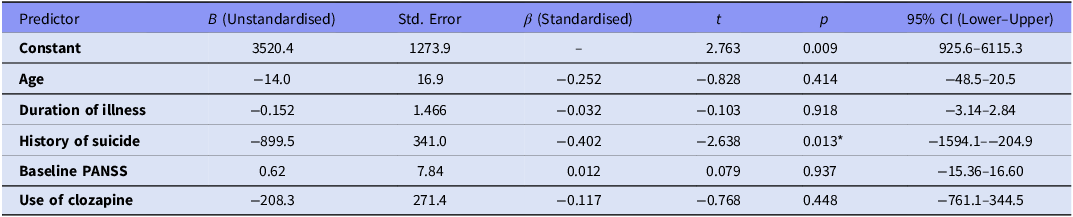
Multiple linear regression was conducted to examine the predictors of pre-admission TBARS levels. Variables included in the regression model were selected based on their clinical relevance and prior evidence in the literature, while limiting the number of predictors to reduce the risk of overfitting given the sample size. The overall model was significant (F(5,32) = 2.77, p = 0.034), explaining approximately 30% of the variance in TBARS (Adjusted R 2 = 0.193). Among the predictors, only a history of suicide was significantly associated with TBARS levels (B = –899.5, β = –0.402, p = 0.013), indicating that patients with a history of suicide had significantly lower TBARS levels. Age, total illness duration, PANSS pre-ECT scores, and current treatment were not significantly related to TBARS levels (all p > 0.05). Regression results are presented with 95% confidence intervals in Table 5.
Multiple linear regression analysis of predictors of pre-admission TBARS levels

Table 5. Long description
A table titled ‘Multiple linear regression analysis of predictors of pre-admission TBARS levels’ with six rows and eight columns. The columns are labeled ‘Predictor’, ‘B (Unstandardised)’, ‘Std. Error’, ‘β (Standardised)’, ‘t’, ‘p’, and ‘95% CI (Lower-Upper)’. The predictors listed are ‘Constant’, ‘Age’, ‘Duration of illness’, ‘History of suicide’, ‘Baseline PANSS’, and ‘Use of clozapine’. The table provides unstandardised and standardised coefficients, standard errors, t-values, p-values, and 95% confidence intervals for each predictor. Notable values include a significant p-value of 0.013 for the ‘History of suicide’ predictor, indicating a significant association with TBARS levels.
R = 0.550, R 2 = 0.302, Adjusted R 2 = 0.193; Std. Error of Estimate = 688.78; ANOVA F(5. 32) = 2.773, p = 0.034; *p < 0.05 considered significant.
Discussion
This study investigated the effect of ECT on TBARS levels, a marker of oxidative stress, in patients diagnosed with schizophrenia. According to our findings, there was no significant change in TBARS levels before or after treatment, whether the patients received pharmacotherapy alone or in combination with ECT. When the two groups were compared, no significant difference was found in TBARS levels before and after treatment. However, TBARS levels showed a negative correlation with age and duration of illness; in the multivariate regression analysis, only a history of suicide was found to be significantly and negatively associated with TBARS levels. To the best of our knowledge, no previous study has compared the potential impact of ECT on TBARS levels in two groups of patients with schizophrenia that are clinically similar, using real-world data.
The literature regarding the impact of ECT on oxidative stress indicators is notably inconsistent. Some studies have reported a decrease (Barichello et al., Reference Barichello, Bonatto, Feier, Martins, Moreira, Dal-Pizzol, Izquierdo and Quevedo2004b; Lv et al., Reference Lv, Hu, Zhang, Huang, Zhu, Geng, Cheng, Bao, Wang and Zhang2020), others an increase (Feier et al., Reference Feier, Jornada, Barichello, Vitali, Bonatto, Moreira, Dal-Pizzol and Quevedo2006; Goncalves et al., Reference Goncalves, Abelaira, Rosa, De Moura, Veron, Borba, Botelho, Goldim, Garbossa and Fileti2021), and some no change (Jornada et al., Reference Jornada, Feier, Barichello, Vitali, Reinke, Gavioli, Dal-Pizzol and Quevedo2007) in TBARS or MDA levels following ECT. Consistent with our findings, research involving individuals with depression also indicated no significant changes in MDA and NO levels following ECT (VıRıT et al., Reference VıRıT, Dalkilic, Bulut, Bülbül, Altinda, Armutcu, Koçoğlu, Citak and Asuman2010). These discrepancies may be due to differences in the timing of measurements, the number of ECT sessions, methodological variations and sample heterogeneity. It is thought that seizures themselves may increase oxidative stress. Prolonged epileptic seizures are known to increase cellular energy demands, disrupt mitochondrial function and upset the balance between oxidative metabolites and antioxidant systems (Puttachary et al., Reference Puttachary, Sharma, Stark and Thippeswamy2015). Despite the seizures induced by ECT in our study, no significant increase in TBARS levels was observed. This suggests that ECT operates through a different biophysiological mechanism to therapeutic seizures, and that it may even support antioxidant systems.
The literature has also emphasised that ECT may have different effects on different subgroups of people with schizophrenia. For example, one study reported a significant decrease in MDA levels following ECT only in patients experiencing their first episode of schizophrenia, whereas this effect was absent in patients with chronic schizophrenia. The same study also showed that baseline MDA levels in patients newly diagnosed with schizophrenia were significantly higher than in chronic cases (Kartalci et al., Reference Kartalci, Karabulut, Ozcan, Porgali and Unal2011). Consistent with these findings, our sample comprised chronic patients with prolonged disease duration, and TBARS levels exhibited a negative correlation with both age and illness duration. This indicates that oxidative stress may be more significant in the first phases of the disorder but may diminish in the chronic phase, potentially due to compensatory mechanisms. The concepts of the ‘Immune-Inflammatory Response System’ and the ‘Compensatory Immune-Regulatory Reflex System’, which both describe bidirectional immune system regulation in schizophrenia, may also support this finding (Li et al., Reference Li, Zhang, Li, Wang, Xiang, Zhang, Su, Huang, Zhang and Zhao2016). The negative correlation between TBARS levels, age, and duration of illness in our sample of chronic patients may reflect the effect of counter-regulatory mechanisms developed in response to long-term immune activation. Interestingly, a significant negative correlation was found between changes in TBARS levels and CGI improvement scores. This finding suggests that alterations in oxidative stress may be associated with clinical improvement. However, given the limited sample size, this result should be interpreted cautiously and requires confirmation in larger studies. Furthermore, smoking is a significant confounding factor that may affect TBARS levels. Studies in the literature have reported that smoking can lower TBARS levels (Zhang et al., Reference Zhang, Tan, Zhou, Haile, Wu, Cao, Kosten and R Kosten2007). The majority of the people in our sample were smokers, which means that this may have hidden the levels of oxidative stress they had. However, in our sample, additional analyses did not reveal significant differences in TBARS levels between smokers and non-smokers at either baseline or discharge.
The history of suicide was identified as a significant negative predictor of TBARS levels in the regression analysis. Although this finding is intriguing, it should be interpreted with caution. It appears to be inconsistent with previous studies reporting higher TBARS levels in individuals with suicidal behaviour (Vargas et al., Reference Vargas, Nunes, De Castro, Bortolasci, Barbosa, Morimoto, Venugopal, Dodd, Maes and Berk2013; Sowa-Kućma et al., Reference Sowa-Kućma, Styczeń, Siwek, Misztak, Nowak, Dudek, Rybakowski, Nowak and Maes2018; Vasupanrajit et al., Reference Vasupanrajit, Jirakran, Tunvirachaisakul and Maes2021). However, given the relatively small sample size and the number of variables included in the model, this association may be unstable and could represent a statistical artefact rather than a robust biological relationship. One possible explanation is that our sample largely consisted of patients with a chronic course of illness, in whom long-term disease processes and potential compensatory antioxidant mechanisms may influence oxidative balance. However, this interpretation remains speculative. Therefore, this finding should be considered exploratory and hypothesis-generating. Further studies with larger samples and longitudinal designs are needed to clarify the relationship between suicidal history and oxidative stress, as well as the underlying mechanisms.
When interpreting the findings of our study, it is important to take into account the following limitations. First, the observational design and non-randomised treatment allocation introduce the possibility of confounding. Although clozapine use was significantly more frequent in the ECT group, we attempted to control for this by including clozapine use in regression analyses and conducting additional subgroup analyses, which did not reveal significant differences in TBARS levels between clozapine users and non-users. This suggests that clozapine may not have substantially influenced TBARS levels in our sample. However, given the relatively small sample size, residual confounding cannot be excluded, and these findings should be interpreted with caution. Second, oxidative stress was assessed using peripheral TBARS measurements as the sole biomarker. Although TBARS is widely used as an indicator of lipid peroxidation, it is a non-specific marker that may be influenced by various methodological and peripheral factors and may not fully reflect oxidative processes occurring in the central nervous system. In addition, the absence of complementary oxidative and antioxidant markers (such as superoxide dismutase, catalase, glutathione peroxidase, or total antioxidant capacity), together with the lack of intermediate measurements during ECT sessions, limits the ability of this study to comprehensively characterise oxidative dynamics and detect potential transient or cumulative changes.. Moreover, the relatively small sample size may have limited the statistical power to detect modest effects. The relatively wide confidence intervals observed for several predictors further reflect the limited precision of the estimates. Therefore, the absence of statistically significant findings should be interpreted cautiously rather than as definitive evidence of no effect. The concurrent use of antipsychotic medications during ECT represents a potential confounding factor that may influence oxidant–antioxidant parameters. Although clozapine use was included in the regression model, other medication effects were not fully accounted for due to the heterogeneity of treatments, the small sample size, and the need to limit predictors to avoid overfitting. Nevertheless, excluding antipsychotic treatment would not be feasible in a real-world clinical setting. Another limitation of the study is that measurements were not taken between ECT sessions, which may have prevented the detection of transient biochemical changes. Another limitation is that the statistical analysis did not account for the antipsychotic medications used by the patients (except clozapine). However, one of the strengths of our study is that we made a prospective comparison between chronic schizophrenia patients with similar clinical characteristics, some of whom received pharmacotherapy plus ECT, and others who received pharmacotherapy alone. To the best of our knowledge, this is the first study of its design. Furthermore, combining the evaluation of clinical indicators with biochemical data enhances the clinical relevance of our findings. However, to demonstrate more clearly the potential effects of ECT on oxidative stress and antioxidant defence systems, larger-sample, longitudinal studies involving different clinical subgroups are needed.
Acknowledgements
Not applicable.
Funding statement
This research did not receive any specific grants from funding agencies in the public, commercial, or not-for-profit sectors.
Competing interests
The authors declare that they have no competing interests.





 Open access

