



1. Introduction
Vorticity plays a singularly important role in fluid dynamics. This is because (a) the generation/appearance of vorticity in a flow provides direct information regarding the influence of viscosity; (b) flow instabilities and transition to turbulence occur in vorticity dominant regions such as shear layers, boundary layers and vortices; and finally, (c) vorticity organized in the form of vortices is known to induce aerodynamic loads on proximal surfaces,
The current paper concerns this third aspect of vorticity, i.e. the ability of vortices to induce aerodynamic loads on immersed surfaces – a fact that has been exploited to great effect in nature (Ellington et al. Reference Ellington, van den Berg, Willmott and Thomas1996; Triantafyllou, Triantafyllou & Yue Reference Triantafyllou, Triantafyllou and Yue2000) as well as in engineered wings and control surfaces (Carr Reference Carr1988; Eldredge & Jones Reference Eldredge and Jones2019). Indeed, unsteady aerodynamics is one arena where a number of studies have focused on determining the aerodynamic loads induced by vortices in a flow (Dickinson & Götz Reference Dickinson and Götz1993; Sane Reference Sane2003; Shyy & Liu Reference Shyy and Liu2007; Chen, Colonius & Taira Reference Chen, Colonius and Taira2010; Gharali & Johnson Reference Gharali and Johnson2013; Mulleners & Raffel Reference Mulleners and Raffel2013; Pitt Ford & Babinsky Reference Pitt Ford and Babinsky2013; Xia & Mohseni Reference Xia and Mohseni2013). This task is made difficult not only by the fact that most flows consist of multiple interacting vortices and shear layers, but also that there continues to be significant ambiguity regarding the very definition of a vortex (Haller Reference Haller2015) and its relationship to the induced pressure field.
One method for vortex identification that is commonly used is the so-called ‘ $Q$-criterion’ (Hunt, Wray & Moin Reference Hunt, Wray and Moin1988; Jeong & Hussain Reference Jeong and Hussain1995). The quantity
 $Q$ is the second invariant of the velocity gradient tensor and can be defined as
 $Q = (||\bar {\boldsymbol{\varOmega }}||^2 - ||\bar {\boldsymbol{\mathsf{S}}}||^2 )/{2}$. Here
 $\bar {\boldsymbol{\mathsf{S}}}$ and
 $\bar {\boldsymbol{\varOmega }}$ are the strain-rate and rotation tensors given by
 $\bar {\boldsymbol{\mathsf{S}}} = [ \boldsymbol {\nabla } \boldsymbol {u} + (\boldsymbol {\nabla } \boldsymbol {u} ) ^\textrm {T}]/{2}$ and
 $\bar {\boldsymbol{\varOmega}} = [ \boldsymbol {\nabla } \boldsymbol {u} - (\boldsymbol {\nabla } \boldsymbol {u} ) ^\textrm {T}]/{2}$, respectively, where
 $\boldsymbol{u}$ is the fluid velocity vector. A vortex, according to the
 $Q$-criterion, is then defined as a connected region where
 $Q>0$. This corresponds to regions where the Frobenius norm of the rotation tensor is greater than that of the strain-rate tensor.
Interestingly, while the quantity  $Q$ has mostly been associated with the flow kinematics, Jeong & Hussain (Reference Jeong and Hussain1995) noted that the pressure Poisson equation for incompressible flow, derived by taking the divergence of the Navier–Stokes equation, can be expressed as
 \begin{equation} \nabla^2p ={-}\rho \boldsymbol{\nabla} \boldsymbol{\cdot} \left( \boldsymbol{u} \boldsymbol{\cdot} \boldsymbol{\nabla} \boldsymbol{u} \right) \equiv \rho \boldsymbol{\nabla} \boldsymbol{u} \boldsymbol{:} \left( \boldsymbol{\nabla} \boldsymbol{u} \right)^\textrm{T} \equiv 2 \rho Q, \end{equation}
where  $p$ and
 $\rho$ are the fluid pressure and density, respectively. Equation (1.1) shows that
 $Q$ appears in the source term of the pressure Poisson equation and is thus not merely a kinematic quantity, but one with direct implications for the dynamics of the flow as well. Furthermore, while regions of positive
 $Q$, which are used to identify vortices, may draw much of our attention, (1.1) shows that regions with negative
 $Q$, i.e. strain-dominated regions, are no less significant with regard to their effect on pressure.
A question that immediately arises from (1.1) is: Do vortices have regions of negative  $Q$ associated with them and, if so, how significant are these regions? To answer this, we first note that the following Neumann boundary condition completes the prescription of the above boundary-value problem:
 $\hat {\boldsymbol {n}} \boldsymbol {\cdot } \boldsymbol {\nabla } p = \hat {\boldsymbol {n}} \boldsymbol {\cdot } [ -\rho { ({\textrm {d} \boldsymbol {u}}/{\textrm {d}t}}) + \mu \nabla ^2 \boldsymbol {u}]$, where
 $\boldsymbol{\hat{n}}$ is the unit normal vector at the boundaries and
 $\mu$ is the fluid viscosity. We now consider a vortex in an infinite quiescent flow for which the boundary condition at the far-field would be homogeneous. The divergence theorem applied to the pressure Poisson equation would therefore require that
 $\int _{V_f} Q \,\textrm {d}V \equiv 0$, where
 $V_f$ is the volume of the flow domain. This implies that, for such a vortex, the volume integral of the negative-
 $Q$ region is equal to the volume integral of positive
 $Q$ in the vortex core. Furthermore, immediately outside the region of positive
 $Q$, the velocity gradients have to be non-zero and, therefore, this region immediately surrounding the vortex core should have
 $Q < 0$. Thus, for any vortex in a viscous flow, the positive-
 $Q$ core is necessarily associated with a negative-
 $Q$ ‘corona’ of equivalent significance. This can easily be confirmed for exact vortex solutions of the Navier–Stokes equations such as the Rankine vortex (Acheson Reference Acheson1990), the Lamb–Oseen vortex (Lamb Reference Lamb1993), and others. While the presence of boundaries and other flow complexities might eliminate the strict equipartitioning of
 $Q$ for a vortex, we nevertheless expect that every vortex will have a significant corona of negative
 $Q$ around it. This observation, combined with (1.1), suggests that the strain-dominated region around a vortex could have a significant contribution to the net aerodynamic load induced by a vortex. However, although the overall effect of these strain-dominated regions on aerodynamic loading has implicitly been included in past studies, our physical intuition regarding aerodynamic loading has generally been tied to the growth, motion and overall evolution of the rotational core of vortices. The role of the strain-induced region on force production has, thus far, not garnered significant attention.
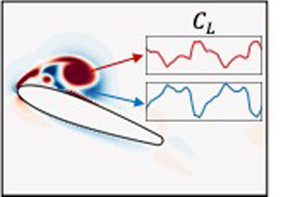
In this paper, we examine the aerodynamic loads induced by vortices on an immersed surface, and, in particular, we focus on the distinct roles played by regions of positive as well as negative  $Q$ associated with vortices. For this analysis, we choose to focus on the problem of a sinusoidally pitching airfoil that exhibits dynamic stall, and generates leading-edge (LEV) and trailing-edge vortices (TEV). We employ a force partitioning approach that allows us to precisely quantify the force contributions of various vortices and vortical regions in the flow. Using this analysis, we examine the phenomenon of dynamic stall and show that our understanding of vortex-induced loads is incomplete without also discussing the role played by the corona of negative
 $Q$ around a vortex.
2. Methods and problem description
2.1. Computational model and numerical method
The two-dimensional computational model studied in this work consists of a sinusoidally pitching NACA0015 airfoil with a rounded trailing edge, immersed in a uniform free-stream flow with velocity  $U_{\infty }$. The flow simulations have been performed using the sharp-interface immersed boundary method of Mittal et al. (Reference Mittal, Dong, Bozkurttas, Najjar, Vargas and von Loebbecke2008) and Seo & Mittal (Reference Seo and Mittal2011). This method is well-suited for moving-boundary problems as it allows the use of simple non-conformal Cartesian grids to simulate a variety of different shapes and motions of the immersed body. Further, the ability to preserve the sharp interface around the immersed boundary ensures very accurate computations of surface quantities. The Navier–Stokes equations are solved using a fractional-step method. Spatial derivatives are discretized using second-order central differences, and time stepping is achieved using the second-order Adams–Bashforth method. The pressure Poisson equation is solved using a geometric multigrid method. This code has been extensively validated in previous studies for a wide variety of stationary as well as moving-boundary problems (Mittal et al. Reference Mittal, Dong, Bozkurttas, Najjar, Vargas and von Loebbecke2008; Seo & Mittal Reference Seo and Mittal2011), where its ability to maintain local (near the immersed body) as well as global second-order accuracy has been established.
The Reynolds number of the flow is defined as  $Re = U_{\infty } C /\nu$, where
 $C$ is the chord length of the airfoil and
 $\nu$ is the kinematic viscosity of the fluid. The pitch oscillation is prescribed as
 $\theta = \theta _0 + A_{\theta }\sin {(2 {\rm \pi}f t)}$, where
 $\theta$ is the instantaneous pitch angle,
 $\theta _0$ is the mean pitch angle and
 $A_{\theta }$ is the pitch amplitude. The dimensionless pitching frequency is given by
 $f = F C/U_{\infty }$, where
 $F$ is the pitch frequency, and
 $t$ is the dimensionless time (also scaled by
 $U_{\infty }$ and
 $C$). This model is placed symmetrically in a large
 $21C \times 23C$ computational domain with a grid of size
 $384\times 320$ points. The grid around the airfoil is isotropic, and corresponds to approximately
 $125$ points along the chord. A Dirichlet velocity boundary condition is used at the inlet boundary of the domain, and zero-gradient Neumann conditions are specified at all other boundaries. Grid refinement studies and other details can be found in Menon & Mittal (Reference Menon and Mittal2019, Reference Menon and Mittal2020a).
2.2. Force partitioning and vortex-induced aerodynamic loads
A key element of the current study is the ability to estimate the aerodynamic loads induced by vortices. This is accomplished using the force partitioning method (FPM) of Zhang, Hedrick & Mittal (Reference Zhang, Hedrick and Mittal2015) and Menon & Mittal (Reference Menon and Mittal2020c), a concise description of which is presented here. The first step in the FPM is the calculation of an auxiliary potential field,  $\phi _i$, which satisfies the following equation:
 \begin{equation} {\nabla}^2 \phi_{i} = 0, \quad\mathrm{in} \ V_f \quad \mathrm{with}\ \hat{\boldsymbol{n}} \boldsymbol{\cdot} \boldsymbol{\nabla} \phi_{i}= \begin{cases} n_i, & \mathrm{on} \ B \\ 0, & \mathrm{on} \ \varSigma \end{cases} \quad \mathrm{for} \ i=1, 2, 3. \end{equation}
Here, as shown in figure 1(a),  $V_f$ is the fluid domain with outer boundary
 $\varSigma$ and
 $B$ is the surface of the immersed body. The unit normal pointing outward from the fluid domain and into the internal and external boundaries,
 $B$ and
 $\varSigma$, is given by
 $\hat {n}$ and the index
 $i$ determines the vector component of the aerodynamic force that is being partitioned. In the current two-dimensional problem,
 $i=1$ and
 $2$ correspond to the drag and lift forces, respectively, on the airfoil. We note that this auxiliary potential is a function only of the instantaneous position and shape of the immersed body and the outer domain boundary. Figure 1(b) shows an example
 $\phi _2$ field around an airfoil.
(a) Schematic of the set-up for the FPM, along with relevant symbols. (b) Sample snapshot of the  $\phi _2$ field around an airfoil.

The next step is to project the Navier–Stokes equation onto the gradient of the auxiliary potential and integrate over the volume of the fluid domain. This results in
 \begin{equation} -\int_{V_f} \boldsymbol{\nabla} p \boldsymbol{\cdot} \boldsymbol{\nabla} \phi_i \,\textrm{d}V = \int_{V_f} \rho \left[ \frac{\partial \boldsymbol{u}}{\partial t} + \boldsymbol{u} \boldsymbol{\cdot} \boldsymbol{\nabla} \boldsymbol{u} - \nu \nabla^2 \boldsymbol{u} \right] \boldsymbol{\cdot} \boldsymbol{\nabla} \phi_i \,\textrm{d}V \quad \mathrm{for} \ i=1, 2, 3. \end{equation}
By making use of properties of  $\phi _i$ as prescribed in (2.1), as well as the incompressibility constraint and the divergence theorem, (2.2) can be rewritten for the pressure-induced force on the body as follows:
 \begin{align} F_i &= \int_{B} p \, n_i \, \textrm{d}S ={-} \rho \int_{B} \hat{\boldsymbol{n}} \boldsymbol{\cdot} \left( \frac{\textrm{d} \boldsymbol{U}_B}{\textrm{d} t} \phi_i \right) \textrm{d}S + \rho \int_{V_f} \boldsymbol{\nabla} \boldsymbol{\cdot} \left( \boldsymbol{u} \boldsymbol{\cdot} \boldsymbol{\nabla} \boldsymbol{u} \right) \phi_i \, \textrm{d}V\nonumber\\ &\quad - \mu \int_{V_f} \left( \nabla^2 \boldsymbol{u} \right) \boldsymbol{\cdot} \boldsymbol{\nabla} \phi_i \,\textrm{d}V - \rho \int_{\varSigma} \hat{\boldsymbol{n}} \boldsymbol{\cdot} \left( \frac{\textrm{d} \boldsymbol{u}}{\textrm{d} t} \phi_i \right) \textrm{d}S\quad \mathrm{for} \ i=1 , 2 , 3 \end{align}
where  $\boldsymbol {U}_B$ is the local velocity of the immersed surface. The four terms on the right-hand-side of (2.3) represent distinct components of the pressure-induced force on the surface. The first term contains the well-known linear acceleration reaction (i.e. added mass) force (Menon & Mittal Reference Menon and Mittal2020b) as well as the centripetal acceleration reaction, which was shown by Zhang et al. (Reference Zhang, Hedrick and Mittal2015) to be an important lift generation mechanism for insect wings. The third term is the pressure force associated with viscous diffusion in the flow and this term is usually significant only for low-Reynolds-number flows. The fourth term is associated with flow acceleration at the outer boundary and this term is negligible for large domains and steady free-stream flows. The surface shear stress also induces a force on the surface that is independent of the pressure-induced force, but this component of the force is also very small for high-Reynolds-number flows. Further details of this FPM applied to aerodynamic forces as well as moments can be found in Zhang et al. (Reference Zhang, Hedrick and Mittal2015) and Menon & Mittal (Reference Menon and Mittal2020b,Reference Menon and Mittalc).
The second term in (2.3), which is the primary focus of the current study, can be expressed as
 \begin{equation} F_i^\omega = \rho \int_{V_f} \boldsymbol{\nabla} \boldsymbol{\cdot} \left( \boldsymbol{u} \boldsymbol{\cdot} \boldsymbol{\nabla} \boldsymbol{u} \right) \phi_i \, \textrm{d}V \equiv{-} \rho \int_{V_f} 2 Q \phi_i \,\textrm{d}V\quad \mathrm{for} \ i=1 , 2 , 3 . \end{equation}
Given the centrality of  $Q$ in this force component, we identify this term as the ‘vortex-induced force’ and denote it as
 $\boldsymbol {F}^\omega$. This vortex-induced force is found to be a dominant component in a variety of flows including those over flapping wings (Zhang et al. Reference Zhang, Hedrick and Mittal2015), bluff bodies (Menon & Mittal Reference Menon and Mittal2020b), pitching foils (Menon & Mittal Reference Menon and Mittal2020c) and delta wings (Li, Zhao & Graham Reference Li, Zhao and Graham2020). This is also true for the particular pitching airfoil problem relevant to this paper. As we will show in the next section, the order of magnitude of vortex-induced force oscillations is
 $O(1)$ and this term accounts for the majority of the total lift on the airfoil. In comparison, the viscous and added-mass terms show oscillations with orders of magnitude
 $O(10^{-1})$ and
 $O(10^{-2})$, respectively, (not shown here for brevity). Plots of these force contributions for sample pitching airfoil cases can be found in Menon & Mittal (Reference Menon and Mittal2020c).
It is also useful to note that the volume-integral form of the vortex-induced force term in (2.4) allows us to compute the force contribution of any region (or flow structure) of interest by constructing appropriate spatial volumes enclosing the flow structure, and evaluating the integral over this volume. Zhang et al. (Reference Zhang, Hedrick and Mittal2015) used this idea to determine the contribution to lift of LEV over flapping insect wings and Menon & Mittal (Reference Menon and Mittal2020b) employed this to show that during stationary-state, transverse flow-induced vibration of a bluff body, the wake vortices serve to damp the vibrations whereas the boundary layer on the oscillating cylinder surface tends to promote oscillations.
The construction of such integral volumes in complex, time-varying flows is itself a challenge and, in this work, we perform this task using a novel automated data-driven procedure described in Menon & Mittal (Reference Menon and Mittal2020c). The input to this framework is a time-resolved flow field that is represented on a grid. At each time step, regions of strain- and rotation-dominated flow are identified as grid points which satisfy  $Q < -\epsilon _S | Q_{max}|$ and
 $Q > \epsilon _{\varOmega } |Q_{max}|$ thresholds, respectively, where
 $|Q_{max}|$ is representative of the maximum magnitude of
 $Q$ in the flow. The thresholds
 $\epsilon _S$ and
 $\epsilon _{\varOmega }$ are chosen to be small numbers, typically of
 $O(10^{-3})$, so as to provide an accurate identification of strain- and rotation-dominant regions while being relatively insensitive to numerical errors. In each case, this thresholding yields a subset of the total grid which consists of several disconnected and dense clusters of grid points. These grid points are then segmented into distinct flow structures using the density-based clustering algorithm DBSCAN (Ester et al. Reference Ester, Kriegel, Sander and Xu1996). This is followed by a tracking procedure which allows us to consistently label each segmented flow structure over multiple time steps. This tracking is based on comparing the location of clusters between time steps using a simple model of scalar convection. By isolating appropriate spatial volumes corresponding to these structures as they evolve spatio-temporally, we can then rigorously evaluate the forces induced on the airfoil by each of these structures as per (2.4).
For computational feasibility, we perform this isolation, tracking and force evaluation within a subdomain of size  $2.5C \times 2C$ around the airfoil within which the computed vortex-induced lift is approximately equal to that integrated over the entire flow domain. Furthermore, we partition the vortex-induced lift into components associated with positive-
 $Q$ regions and negative-
 $Q$ regions; these are referred to as ‘rotation-induced’ and ‘strain-induced’ lift, respectively, and the corresponding lift coefficients denoted by
 $C_L^\varOmega$ and
 $C_L^S$, respectively.
Before the results are presented, it is instructive to place this method within the context of past studies that have quantified the aerodynamic loads induced by individual vortices in a flow. Two studies that are particularly relevant here are those of Pitt Ford & Babinsky (Reference Pitt Ford and Babinsky2013) and Onoue & Breuer (Reference Onoue and Breuer2016) who analysed the loading induced by the LEV and TEV using experimental measurements in unsteady airfoil flows. The common features of the approaches employed by Pitt Ford & Babinsky (Reference Pitt Ford and Babinsky2013) and Onoue & Breuer (Reference Onoue and Breuer2016) are as follows: (a) the assumption of two-dimensionality; (b) use of inviscid models with point vortices in the field combined with conformal mapping and image-vortices to satisfy no-penetration on the airfoil surface; (c) parameterization of vortex circulation from experimental data; and (d) calculation of induced aerodynamic load via the Blasius formula (Batchelor Reference Batchelor1967). The predictions from such models can be quite good and lead to excellent insights into vortex-induced aerodynamic loads.
In comparison, the FPM provides an approach to vortex-induced load quantification that neither requires the assumption of two-dimensionality (see Zhang et al. (Reference Zhang, Hedrick and Mittal2015) for application to a 3-D flow) nor that of inviscid flow. This eliminates the need for conformal mapping and the difficulties associated with flow regularization around sharp edges (by enforcing the Kutta condition). It also removes errors associated with the inviscid flow assumption and the use of point-vortex models. By alleviating these constraints, the FPM demonstrated here is therefore rigorously applicable to general viscous flows. This method allows the evaluation of aerodynamic loading due to individual flow structures in flows that contain several such features interacting and deforming in complicated ways. Furthermore, this method also provides the contribution of acceleration reaction effects as well as viscous diffusion to aerodynamic loads, and can therefore also be applied to flows at low Reynolds numbers. Finally, while the force partitioning is applied here to data from viscous flow simulations, it is, in principle, applicable to experimental data as well.
3. Results
The analysis is based on two cases of a pitching airfoil with different dimensionless pitching frequencies:  $f = 0.35$ and
 $0.10$. The other parameters which are kept the same for these cases are
 $Re=1000$,
 $\theta _0 =15^{\circ }$ and
 $A_{\theta } =20^{\circ }$. Figure 2 shows the lift vs pitch angle for the two cases. While both cases exhibit the classic features of dynamic stall (instantaneous lift that significantly exceeds the corresponding static lift followed by a rapid drop in lift), the differences between the two due to the pitching frequency provide an effective substrate to examine vortex-induced forces in a comprehensive manner.
Coefficient of lift ( $C_L$) vs pitch-angle (
 $\theta$) plots for the two cases: (a)
 $f = 0.35$,
 $A_{\theta }=20^{\circ }$; (b)
 $f = 0.10$,
 $A_{\theta }=20^{\circ }$. Labels
 $t_1$–
 $t_4$ correspond to time instances examined in subsequent discussion and figures. The dashed line indicates the lift coefficient for corresponding static airfoil (Menon & Mittal Reference Menon and Mittal2020a).

3.1. Case 1:  $f=0.35$

We first discuss the case with  $f=0.35$, and specifically examine the time instances marked
 $t_1$–
 $t_4$ in figure 2. Figure 3(a) shows a snapshot of vorticity at time
 $t_1$, and we see four key features: a large primary LEV (pLEV) from the previous cycle which is in the near-wake of the foil, a large TEV which is near the trailing edge, a secondary LEV (sLEV) which is located near midchord and a shear layer on the suction side which is the initial stage in the formation of the next pLEV.
Flow snapshots and lift contributions for the case with  $f=0.35$. (a) Contours of spanwise vorticity at time
 $t_1$. (b–e) Filled contours of
 $Q$, with levels
 $[-40,40]$, overlaid with line contours of
 $\phi _2$. ( f–i) Distribution of vortex-induced lift (
 $f_2^\omega = -2 Q \phi _2$) with contour levels
 $[-65,65]$. Dashed lines and labels show integration volumes corresponding to each vortex which are used to compute the vortex-induced lift associated with these regions as per equation (2.4). Snapshots (b–e) and ( f–i) are at time instances
 $t_1$ –
 $t_4$ from top to bottom. ( j) Total lift coefficient (
 $C_L$; black solid line) compared with vortex-induced lift (
 $F_2^{\omega }$; black dashed line). Pitch angle is shown for reference (
 $\theta$; black dotted line). (k) Rotation-induced lift (
 $C^{\varOmega }_L$; red solid line) and contributions from the pLEV (orange solid line), TEV (pink solid line) and sLEV (green solid line). (l) Rotation-induced lift due to regions of
 $Q>0$ (
 $C^{\varOmega }_L$; red solid line) and strain-induced lift due to regions of
 $Q<0$ (
 $C^{S}_L$; blue solid line). Time instances
 $t_1$–
 $t_4$ are indicated using dashed grey lines.

Figure 3(b–e) shows the  $Q$ fields at time instances
 $t_1$–
 $t_4$, overlaid with contours of
 $\phi _2$. These
 $Q$ fields clearly identify the key vortices that are generated during the pitching cycle as regions of positive
 $Q$ and for time
 $t_1$, figure 3(b) can be correlated with the vorticity plot in figure 3(a). Also noticeable in the plots of
 $Q$ are the large regions of
 $Q<0$ that surround the vortices, which corroborates our earlier discussion about the existence of such regions around vortices. These regions of negative
 $Q$ tend to be more spread out than the vortex cores. There is also a region of negative
 $Q$ near the leading edge of the airfoil that is sustained throughout the pitching cycle.
The distribution of  $\phi _2$ has some distinctive features that have important implications for the vortex-induced lift. First, it has opposite sign over the two surfaces of the airfoil. Thus, a vortex adjacent to one surface of the airfoil would generate a force in the opposite direction to that induced by the same vortex adjacent to the other surface. Second, the magnitude of
 $\phi _2$ is highest near midchord and decays towards the leading and trailing edges. Therefore, a vortex located near midchord would generate a larger lift force than the same vortex located near the leading or trailing edges. Finally,
 $\phi _2$ decays with distance from the airfoil and hence, as expected, the influence of a vortex on the lift would diminish with distance from the airfoil.
Figure 3( f–i) shows corresponding contour plots of the integrand of the vortex-induced lift,  $f_2^\omega = -2 Q \phi _2$. This represents the vortex-induced lift per unit volume of fluid and these plots can be interpreted based on the distribution of
 $Q$ and
 $\phi _2$ shown in figure 3(b–e). We see that the most lift-inducing flow structures are those with large
 $Q$ magnitudes and/or those near midchord due to the large magnitude of
 $\phi _2$.
The dynamical influence of the various flow structures observed in the flow snapshots discussed above are quantified in figure 3( j–l). Figure 3( j) shows the time variation of the total lift coefficient, shown as a solid black line, and the vortex-induced lift coefficient (dashed black line) over two pitching cycles. First, it is noted that the vortex-induced lift is nearly identical to the total lift and this highlights the predominance of this component of the lift force. As mentioned in § 2.2, the added mass and viscous contributions have orders of magnitude  $O(10^{-2})$ and
 $O(10^{-1})$, respectively. Second, the lift curve shows a rapid drop between
 $t_1$ and
 $t_3$, which represents the typical signature of dynamic stall. The generally accepted notion is that dynamic stall occurs when an attached LEV, which generates high lift, undergoes a ‘shedding’ event (Carr Reference Carr1988; Dickinson & Götz Reference Dickinson and Götz1993; Chen et al. Reference Chen, Colonius and Taira2010). We can evaluate this notion rigorously by computing the distinct lift contributions of each vortex highlighted above. This is done using an automated framework that segments and tracks the volumes of the
 $Q>0$ regions occupied by each of the vortices. These spatial volumes are shown as
 $Q=0$ contours using the dashed lines in figure 3( f–i). The resulting ‘rotation-induced lift’ for the various vortices is presented in figure 3(k). We see that the pLEV is indeed the dominant generator of lift on the airfoil, with the sLEV and the TEV generating much smaller contributions (peak lift due to sLEV and TEV is approximately 15 % of the pLEV). However, very surprisingly, we note that from time
 $t_1$ to
 $t_3$ while the total lift on the airfoil falls, the lift induced by the pLEV actually increases and reaches a peak at
 $t_3$. This increase in pLEV-induced lift is consistent with its growth while staying attached in a region of relatively large
 $\phi _2$, as seen in figure 3(c,d) as well as 3(g,h). When the pLEV is released and starts to move away from the surface of the foil, as seen in figures 3(e) and 3(i) at
 $t_4$, the lift induced by it reduces, as expected. However, the total lift actually increases during this time, from
 $t_3$ to
 $t_4$. Thus, the total lift on the airfoil is nearly perfectly out of phase with the lift induced by the pLEV. This observation runs contrary to our phenomenological understanding of the role of LEV in lift enhancement and dynamic stall. In fact, this phase lag between the growth of the pLEV and the lift maximum has been previously reported by Xia & Mohseni (Reference Xia and Mohseni2013) and Gharali & Johnson (Reference Gharali and Johnson2013).
The cause of this seemingly anomalous behaviour becomes clear when we examine the components of the vortex-induced lift associated the negative- $Q$ regions (what we call ‘strain-induced lift’) as shown in figure 3(l). This plot shows that even though the positive lift induced by the growing LEV does indeed increase between phases
 $t_2$ and
 $t_3$, this increase is counteracted by an increase in the negative lift induced by regions of
 $Q<0$ that surround the LEV. These regions of negative
 $Q$ occur in areas where the
 $\phi _2$ has a high magnitude, as seen in figure 3(c–e), and that helps accentuate their effect on the total lift. Thus, the rapid drop in lift occurs not due to the ‘shedding’ of the LEV but due to the growth of the strain-dominated negative-
 $Q$ regions that develop around the growing LEV. Similarly, the rise in total lift between
 $t_3$ and
 $t_4$, which occurs despite the reduction in pLEV-induced lift, is driven by the slightly more rapid reduction in the negative strain-induced lift. Some studies have, in fact, reported a phase lag between the onset of dynamic stall and attainment of peak LEV circulation (Gharali & Johnson Reference Gharali and Johnson2013; Xia & Mohseni Reference Xia and Mohseni2013). For the current case, we show that such a phase lag, which runs counter to our intuition regarding dynamic stall, can be explained by the significant influence of strain-induced loading. Thus, this case challenges our conventional understanding of phenomenological connection between LEV evolution and dynamic stall, and points to the significant role that the strain-dominated regions can play in determining the aerodynamic loads on the surface.
3.2. Case 2: $f=0.10$

We now contrast this behaviour with that at low-frequency oscillations of  $f=0.10$. The hysteresis plot in figure 2(b) shows that the pitch-angle reversal in this case corresponds to a sharper initial drop in lift, indicating that the vortices in this low-frequency oscillation interact differently with the time scale of oscillation. The snapshots of
 $Q$, shown for this case in figure 4(b–e), highlight the main vortex structures in the flow. We see that it is dominated by the same three vortices as in the previous case – the pLEV, the sLEV and the TEV. However, on comparing figures 4(b) and 3(d), which correspond to time instances soon after the pLEV-separation in the present and previous case, respectively, we see that the pLEV in the current low-frequency case is larger in size and farther away from the surface of the airfoil. This is a result of the slower pitching motion, which allows more time for the growth and downstream motion of the pLEV.
Flow snapshots and lift contributions for the case with  $f=0.10$. (a) Contours of spanwise vorticity at time
 $t_1$. (b–e) Filled contours of
 $Q$, with levels
 $[-40,40]$, overlaid with line contours of
 $\phi _2$. ( f–i) Distribution of vortex-induced lift (
 $f_2^\omega = -2 Q \phi _2$) with contour levels
 $[-65,65]$. Snapshots (b–e) and ( f–i) are at time instances
 $t_1$ –
 $t_4$ from top to bottom. ( j) Total lift coefficient (
 $C_L$; black solid line) compared with vortex-induced lift (
 $F_2^{\omega }$; black dashed line). Pitch angle is shown for reference (
 $\theta$; black dotted line). (k) Rotation-induced lift (
 $C^{\varOmega }_L$; red solid line) and contributions from the pLEV (orange solid line), TEV (pink solid line) and sLEV (green solid line). (l) Rotation-induced lift due to regions of
 $Q>0$ (
 $C^{\varOmega }_L$; red solid line) and strain-induced lift due to regions of
 $Q<0$ (
 $C^{S}_L$; blue solid line). Time instances
 $t_1$–
 $t_4$ are indicated using dashed grey lines.

This increased distance of the pLEV from the surface has important consequences for the lift induced by the pLEV as well as its surrounding region of strain. Figure 4( f–i) shows snapshots of  $f_2^\omega$ for this case, and we see from figures 4(g) and 4(h) that the induced-force density of the pLEV as well as the straining regions around it are significantly smaller than in the
 $f=0.35$ case discussed earlier (note the difference in
 $f_2^\omega$ contour levels between the two cases). In particular, a comparison of the lift distribution in figure 4(g–i) with that of figure 3(g–i) shows a stark contrast in the distance of the pLEV from the wall soon after pLEV-separation, as well as the resultant confinement of the strain associated with the pLEV near the wall.
The implications of these observations are evident in figure 4( j–l). Figure 4( j) again shows that the vortex-induced lift dominates the overall lift production. The contributions of total rotation-induced lift (i.e.  $Q>0$ regions) as well as those of the individual vortices are quantified in figure 4(k). First, we note that the peak in the total rotation-induced lift aligns (at time
 $t_2$) well with that for the total lift. This is in contrast to the previous case where the two were quite out of phase. Second, the contribution of the pLEV peaks at time
 $t_1$, which is in phase with
 $C_L$ but slightly ahead of the the peak rotation-induced lift. The sLEV appears around this time and augments the rotation-induced lift, resulting in the peak
 $C_L^{\varOmega }$ at
 $t_2$. There is also a second peak in the total rotation-induced lift at
 $t_4$ which, as evident from figure 4(k), is generated by the TEV.
Finally, figure 4(l) shows the contribution of the rotation and strain-induced lifts to the total vortex-induced lift. We note that the strain-induced lift has a time-profile that is similar to the rotation-induced lift but remains consistently lower in magnitude for most of the pitching cycle. This is consistent with the observation that regions of large-strain around the vortices are generated relatively further away from the airfoil in this case as compared with the previous case. Furthermore, this also explains the fact that  $C_L$ is in phase with the rotation-induced lift in this case, unlike the behaviour seen for
 $f=0.35$.
Thus, this lower frequency case presents a more conventional phenomenology of dynamic stall where the total lift correlates, as expected, with the growth and movement of the rotational cores of the vortices. The strain-induced lift force, despite being comparable in magnitude to the rotation-induced lift and of significantly greater magnitude than the total lift, does not play as significant a role for this case, as it does for the first one.
4. Conclusions
We have shown that while studies of vortices and their effects on aerodynamic loads have mostly focused on the rotational cores of vortices, vortex cores are in fact surrounded by dynamically significant regions where strain dominates over rotation. In particular, these strain-dominated regions exert a considerable, and sometimes even dominant, influence on the induced aerodynamic loads. By using simulations of flow past a pitching airfoil and employing a powerful FPM to separate the force contributions of various regions of the flow, we have shown that the lift induced by the strain-dominated regions around vortices is of a magnitude comparable to that induced by the rotational cores of the vortices. For one of the two cases presented here, we also show that dynamic stall, i.e. the rapid drop in lift for an unsteady airfoil, is less connected with the conventional notion of LEV shedding and more with the formation and evolution of the strain-dominated ‘corona’ of the LEV.
We close by pointing out that previous investigations (Pitt Ford & Babinsky Reference Pitt Ford and Babinsky2013; Wang & Eldredge Reference Wang and Eldredge2013; Xia & Mohseni Reference Xia and Mohseni2013; Onoue & Breuer Reference Onoue and Breuer2016) of vortex-induced aerodynamic loads do implicitly include the effect of strain-dominated regions of a vortex in estimating induced loads. However, the accompanying interpretations of the mechanisms and phenomenology has been based primarily on the rotational vortex cores and has largely ignored the strain-dominated regions associated with vortices. The current study showcases the significant and sometimes dominant influence of the strain-dominated regions around a vortex, and highlights the utility of explicitly accounting for these effects when examining the mechanisms that govern aerodynamic loading in vortex-dominated flows.
Funding
We acknowledge support from AFOSR grant number FA9550-16-1-0404, monitored by Dr G. Abate, and XSEDE computational resources supported by the NSF through allocation TG-CTS100002.
Declaration of interests
The authors report no conflict of interest.



