Introduction
The fatty acid composition of intramuscular and adipose tissues of pigs can be efficiently modulated by dietary ingredients (Bee and Wenk, Reference Bee and Wenk1994; Scheeder et al., Reference Scheeder, Gläser, Eichenberger and Wenk2000; Bee et al., Reference Bee, Gebert and Messikommer2002; Gläser et al., Reference Gläser, Wenk and Scheeder2002). Thus, by changing the pig’s diet, the pig industry can cope with novel or adapted recommendations from nutritionists with respect to the fatty acid profile of human diets. Based on evidence derived from epidemiological, clinical and biochemical studies, one major concern today is the low n-3 fatty acid content of Western diets (Harris, Reference Harris2007). The linolenic acid (C18:3n-3) and to some extent the eicosapentaenoic (EPA; C20:5n-3), docosapentaenoic (DPA; C22:5n-3) and docosahexaenoic acid (DHA; C22:6n-3) levels of pork can be increased by feeding sources such as linseed, which contains about 30% oil, of which 50% is linolenic acid (Enser et al., Reference Enser, Richardson, Wood, Gill and Sheard2000; Matthews et al., Reference Matthews, Homer, Thies and Calder2000; Kouba et al., Reference Kouba, Enser, Whittington, Nute and Wood2003). The results from the aforementioned studies reveal that higher n-3 tissue lipid concentrations entail a concomitant lower n-6/n-3 ratio; a ratio that is recommended to be less than 4 : 1 (Wood et al., Reference Wood, Richardson, Nute, Fisher, Campo, Kasapidou, Sheard and Enser2004), but in Switzerland reaches values of 12 : 1 in tissue lipids of pigs fed standard grower–finisher diets (Scheeder et al., Reference Scheeder, Gläser, Eichenberger and Wenk2000; Bee et al., Reference Bee, Guex and Herzog2004).
The main concern of increasing the n-3 fatty acid concentration in pork arises from a higher susceptibility to lipid oxidation (D’Arrigo et al., Reference D’Arrigo, Hoz, Lopez-Bote, Cambero, Pin and Ordóñez2002a; Rey et al., Reference Rey, Lopez-Bote, Kerry, Lynch, Buckley and Morrissey2004). D’Arrigo et al. (Reference D’Arrigo, Hoz, Lopez-Bote, Cambero, Pin, Rey and Ordóñez2002b) found that the oxidative stability of the adipose tissue lipids could be markedly enhanced by supplementing a linseed oil-fortified diet with α-tocopherol. Another approach could be to specifically modulate the fatty acid profile of the subcutaneous fat (SF) by increasing the concentration of saturated fatty acids (SFA) at the expense of the monounsaturated fatty acids (MUFA) and, thus, keeping the n-3 polyunsaturated fatty acid (PUFA) amount unchanged. Feeding pigs with diets fortified with conjugated linoleic acid (CLA) has been proven to be effective in lowering the MUFA/PUFA ratio (Bee, Reference Bee2000) and by that lower susceptibility to lipid oxidation (Joo et al., Reference Joo, Lee, Ha and Park2002; Corino et al., Reference Corino, Magni, Pastorelli, Rossi and Mourot2003). However, the diets used in the aforementioned studies were not supplemented with highly unsaturated fats and it is unclear whether under these circumstances similar protective effects can be expected. A possible drawback combining linolenic acid-fortified diets with CLA is that CLA is believed to compete with the Δ6-desaturase activity (Belury and Kempa-Steczko, Reference Belury and Kempa-Steczko1997) and thus, impede accumulation of the longer chain (C20-22) fatty acids of the n-3 series. Recent results from a study with rats are promising as they revealed that compared with animals fed sunflower oil and linseed oil those fed CLA and linseed oil had the highest concentrations of long-chain (n-3) PUFA deriving from Δ6, Δ5 and Δ4-desaturation of linolenic acid in liver phospholipids (Eder et al., Reference Eder, Slomma, Becker and Brandsch2005).
The aim of the present study was to evaluate the effect of the dietary supply of extruded linseed combined with CLA or tallow, a fat known for its high degree of saturation, on muscle and SF fatty acid composition. Besides determining the impact of the varying dietary fatty acid supplies on growth performance, carcass characteristics and meat quality traits with special emphasis on lipid oxidation also their effects on fat metabolism were monitored.
Materials and methods
Experimental diets
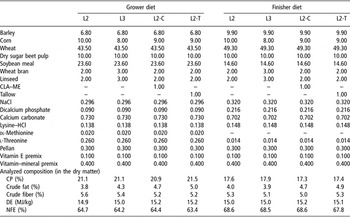
One basal grower–finisher diet was formulated based on wheat, corn, barley, soy bean meal and dry sugar beet pulp (Table 1) according to Swiss nutrient requirements for growing-finishing pigs (Stoll et al., Reference Stoll, Kessler, Gutzwiller, Bee, Chaubert, Gafner, Bracher, Jost, Pfirter and Wenk2004). The basal diets were then supplemented with either 2% extruded linseed (L2), 3% extruded linseed (L3), 2% extruded linseed and 1% CLA (L2-C) or 2% extruded linseed and 1% tallow (L2-T). A commercial source of CLA (ME-CLA; BASF, Offenbach, Germany), supplied in the form of methyl esters of CLA, was used to supplement the L2-C diet. In all diets, vitamin E was included at the level of 30 mg/kg diet. The diets were pelleted (4.5 mm diameter) at 60°C. During feed processing, feed samples were taken and bulked to determine nutrient content and lipid composition.
Composition of the growing and finishing diet (as-fed basis)Footnote †

† Abbreviations are: DM = dry matter; L2 = grower–finisher diet supplemented with 2% extruded linseed; L3 = grower–finisher diet supplemented with 3% extruded linseed; L2-C = grower–finisher diet supplemented with 2% extruded linseed and 1% CLA-oil; L2-T = grower–finisher diet supplemented with 2% extruded linseed and 1% tallow; Pellan = a binder that aids in pellet formation (Mikro-Technik GmbH & Co. KG, Germany); vitamin E premix = premix of Lutavit E 505 (BASF, Germany) with wheat flower in order to obtain a vitamin E concentration of 30 mg/kg diet; vitamin–mineral premix supplied the following nutrients per kilogram of diet: 20 000 IU vitamin A, 200 IU vitamin D3, 39 IU vitamin E, 2.9 mg riboflavin, 2.4 mg vitamin B6, 0.010 mg vitamin B12, 0.2 mg vitamin K3, 10 mg pantothenic acid, 1.4 mg niacin, 0.48 mg folic acid, 199 g cholin, 0.052 mg biotin, 52 mg Fe as Fe-sulfate, 0.16 mg I as Ca(IO)3, 0.15 mg Se as Na2Se, 5.5 mg Cu as CuSO4, 81 mg Zn as ZnO2, 15 mg Mn as MnO2; DE = digestible energy content calculated according to the formula: DE = 18.974 × CP (g/g DM) + 33.472 × crude fat (g/g DM) + 16.611 × NFE (g/g DM) − 21.216 × crude fiber (g/g DM) + 16.611 × NFE (g/g DM); NFE = DM – ash – CP – crude fat – crude fiber.
Growth trail and carcass measurements
The Swiss Federal Committee for Animal Care and Use approved all procedures involving animals.
Swiss Large White barrows (n = 32; mean ± s.d. BW = 17.8 ± 0.75 kg) originating from eight litters were allocated on the basis of litter and BW into four treatment groups. From the beginning of the experiment to 60 kg and from 60 to 104.0 ± 1.00 kg BW, the barrows had ad libitum access to either the L2, L3, L2-C or L2-T grower–finisher diet, respectively. Barrows were reared for the entire experimental period in group-pens (eight per pen) equipped with single-space computerized feeders (Mastleistungsprüfung MLP-RAP; Schauer Agrotronic AG, Sursee, Switzerland). Access to the feeder was restricted to one pig at a time. The feeder had a steel trough set on a scale. When the barrow entered the feeder, he was recognized by the electronic system (MLP-Manager 1.2; Schauer Maschinenfabrik Ges.m.b.H & CoKG, Prambachkirchen, Austria), the cover over the trough opened, the trough was elevated from the scale and the pig had access to the feed. The electronic system detected the opening and recorded the time and the weight of the trough immediately prior to pig entry. Each barrow was fitted with a uniquely coded ear tag transponder and the identification circuit recorded the pig’s number. When the barrow finished feeding and withdrew from the trough, the electronic system locked the access to the feed by closing the cover of the trough and the trough was set on the scale. Then the electronic system recorded the time and the weight of the trough. The difference between the pre- and post-visit trough weight was stored in a data file with the pen number, the pig’s identification number, and the date and the time of entry and exit. These data sets were used to calculate the individual feed intake. Between each visit the weight of the trough was checked by the electronic system and if it fell below a pre-set minimum the feeder was locked and the trough topped up with food. The scale of each feeder was checked weekly. Individual BW was determined each week. Feed was withheld from the barrows 12 h before transportation to the research station abattoir where they were electrically stunned and exsanguinated. Internal organs were removed and warm carcass weight was obtained. One day after slaughter the left side of each carcass was weighed and dissected according to meat cutting standards applied by the Swiss Pig Performance Testing Station (MLP, Sempach, Switzerland), as previously described (Bee, Reference Bee2001).
Tissue sampling and preparation
From the right side of each carcass, samples of the SF and longissimus muscle (LM) in the region of the 10th dorsal vertebra were collected 30 min post mortem. Subsequently, weighted quantities of the SF were homogenized in an ice-cooled homogenization buffer (250 mM sucrose; 100 mM potassium phosphate, 1 mM EDTA, 50 mM β-mercaptoethanol, pH 7.4). The samples were centrifuged twice at 15 000 × g for 10 min and the supernatant was recentrifuged at 30 000 × g for 40 min in the same buffer. The supernatants were stored at −80°C to assess lipogenic enzyme activities in the SF. The tissue samples for assessing the metabolic properties of the LM were homogenized in an ice-cooled buffer (300 mM phosphate buffer, 10% bovine serum albumin, pH 7.7) and then stored at −80°C until analysis. In addition, SF samples were immediately frozen in liquid nitrogen and stored at −80°C to assess the activity of the stearoyl-CoA desaturase activity (SCD).
The day after slaughter, 100 g samples from the SF (8th dorsal vertebra), LM (8 to 10th dorsal vertebras), m. semimembranosus (SM) and m. biceps femoris (BF) were taken from the left side of the carcass, lyophilized, homogenized, vacuumed and stored at −20°C until determination of dry matter content and fatty acid profile in the muscle and adipose tissues and the CP and intramuscular lipid content in the muscle tissues. In addition, two LM cross sections were removed between the 10th and 13th rib and two slices of 100 g each of the SM and BF were cut longitudinal to the myofibers for the color, percentage drip and cooking loss and shear force. Additionally, on the right side of the carcass at the 10th to 12th rib location, four 1.5-cm-thick LM chops were cut for the determination of lipid oxidation. The thiobarbituric acid-reactive substances (TBARS) were evaluated in two LM chops either just after collection or 4 days after refrigerated storage (4°C). Aiming to induce lipid oxidation, two LM chops were cooked on a grill plate (Beer Grill AG, Zurich, Switzerland) at 190°C to 195°C to an internal temperature of 69°C. Following cooking, TBARS were evaluated either immediately or 4 days after refrigerated storage (4°C).
Sample analysis
Dry matter, ash, CP, crude fat and crude fiber analyses of feed were carried out according to the AOAC methods (AOAC, 1995). Dry matter and crude fat content of muscle and adipose tissues and the CP of muscle tissues were quantified according to the AOAC methods (1995). Fatty acid profiles of the adipose tissues and muscles were determined by gas chromatography of the methyl esters as previously described (Bee, Reference Bee2001).
The day after collection, the SF samples were analyzed in duplicate for glucose-6-phosphate dehydrogenase (G6PDH, EC 1.1.1.49), malic enzyme (ME, EC 1.1.1.40) and fatty acid synthase (FAS, EC 2.3.1.85) using the methods of Löhr and Waller (Reference Löhr and Waller1974), Hsu and Lardy (Reference Hsu and Lardy1969) and Roncari (Reference Roncari1981), respectively. The NADPH formation (G6PDH and ME) or oxidation (FAS) was measured at 37°C by absorbance at 340 nm. A commercial protein dye-binding assay kit, using bovine gamma globulin as a standard, was used to measure the soluble protein concentration in the supernatant fraction (Bio-Rad Protein Assay, Bio-Rad, Glattbrugg, Switzerland). The enzyme activities were expressed as μmol NADPH produced or oxidized/min per mg protein.
Weighed frozen SF samples (1.5 g) collected on the day of slaughter were homogenized in 4.5 ml ice-cooled buffer (250 mM sucrose, 1 mM EDTA, 1 mM dithiothreitol, 10 mM potassium phosphate, pH 7.4) for 45 s using a Polytron homogeniser (Kinematica, Luzern, Switzerland). The fat cake was removed after centrifugation at 5000 × g for 15 min and the infranatant fraction was recentrifuged at 17 300 × g for 30 min. The microsomes, which were obtained by ultracentrifugation of the remaining fraction at 104 000 × g for 60 min, were resuspended in 0.3 ml of 100 mM potassium phosphate buffer (pH 7.4) and frozen at −80°C until utilization. The centrifugations as well as the handling and preparation steps of the samples were carried out at 4°C. The activity of the SCD was assayed in the incubation mixture containing 100 mM potassium phosphate (pH 7.4), 6 mM MgCl2, 8 mM ATP, 1 mM NADH, 6 mM coenzyme A and 200 nM stearic acid (C18:0) in ethanol solution (optimal concentration with our enzyme preparation). The reaction was started with the addition of 4 mg microsomal protein. The solution was incubated in a 37°C water bath with continuous shaking. After 15 min, the reaction was stopped by adding 3 ml of 10% KOH in methanol and subsequent heating at 70°C for 30 min in the water bath. Acidification was achieved by the addition of 9 ml of 3N HCl. Fatty acids were extracted with three washes of 3 ml of n-pentane each and then washed with 9 ml of acid water (pH 3). The pentane phase was removed, tridecoanoate acid ester (C13:0) was added and the solution was evaporated to dryness under nitrogen. The purified fatty acids including the internal C13:0 standard was methylated and subsequently treated as previously described (Bee, Reference Bee2001). The SCD activity was expressed as nmol oleic acid (C18:1n-9) formed/min per mg microsomal protein.
The activities of citrate synthase (CS, EC 1.1.3.7), β-hydroxy-acyl-coenzyme A-dehydrogenase (HAD, EC 1.1.1.35) and lactate dehydrogenase (LDH, EC 1.1.1.2.7) were used as markers of overall oxidative capacity (tricarboxylic cycle), lipid β-oxidation and glycolytic potential, respectively. Enzyme activities were measured on LM samples as described previously (Lebret et al., Reference Lebret, Le Roy, Monin, Lefaucheur, Caritez, Talmant, Elsen and Sellier1999) and expressed as μmol of substrate degraded/min per g of fresh tissue.
Objective meat quality measures
The pH of the LM at 30 min and the pH of the LM, SM and BF at 24 h post mortem were measured using a WTW pH meter (WTW pH196-S; Wintion, Weilheim, Germany) equipped with a WTW electrode (WTW Eb4, Wintion) and a temperature probe. Prior to measurement, the instrument was calibrated with two calibration buffers (solution A: pH 7.080 ± 0.002; solution D: pH 4.667 ± 0.006; Wintion). In the LM, sets of measurements were obtained at the 10th rib of the right side of the carcass at 30 min and of the left side of the carcass at 24 h post mortem by insertion of the pH and temperature probe between the ribs from the inside of the left side of the carcass. In the SM and BF, pH was determined just after muscle excision at 24 h post mortem in the center of the muscles. Light reflectance coordinates (L*: brightness, a*: redness and b*: yellowness) of the muscle surfaces were measured following a 10 min bloom, using a Minolta Chroma Meter CR-300 with a D65 light source (Minolta, Dietikon, Switzerland). Drip loss was measured as the amount of purge resulting during the storage of the chops for 24, 48 and 72 h at 2°C (Honikel, Reference Honikel1998). After drip loss measurements were made, the samples were vacuum-packed and stored at −20°C until Warner–Bratzler shear force was determined. Frozen samples were thawed for 24 h at 2°C, subsequently kept at room temperature for 1 h and then cooked on a grill plate (Beer Grill AG, Zurich, Switzerland) at 190°C to 195°C to an internal temperature of 69°C, and cooking losses were measured. Shear force was determined as previously described (Bee et al., Reference Bee, Calderini, Biolley, Guex, Herzog and Lindemann2007).
Statistical analysis
Data were analyzed with the MIXED procedure of SAS (v. 8.02; SAS Institute, Cary, NC, USA). The model used for the analyses of growth performance, carcass characteristics, meat quality traits, nutrient content, fatty acid profile and the enzyme activities of the tissues included dietary treatment as fixed effect and litter as the random effect. The individual pig was the experimental unit for analysis of all data. Using the aforementioned statistical model, the residuals of the TBARS values were not normally distributed and therefore the analysis was carried out on the log-transformed data. The reported data for the TBARS values were back-transformed least square means. Least square means were considered statistically significant at P ⩽ 0.05.
Results
Fatty acid composition of the diets
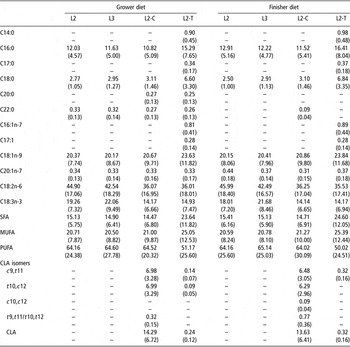
The extruded linseed added to the basal diets had a lipid content of 41.86 g/100 g dry matter and the main fatty acids (expressed as g/100 g total fatty acids) were, in decreasing order, linolenic (55.73 g), oleic (C18:1n-9: 18.83 g) and linoleic acid (C18:2n-6: 15.44 g). The 1% higher linseed content in the L3 diets increased the linolenic and decreased the linoleic acid content by 3% units compared with the L2 diet (Table 2). The CLA-enriched oil contained (expressed as g/100 g total fatty acids) mainly the two isomers c9,t11- (31.65 g) and t10,c12-CLA (31.81 g) as well as oleic acid (21.78 g), palmitic (C16:0: 5.67 g), stearic (C18:0: 4.34 g) and linoleic acid (2.40 g). Thus, compared with the L2 and L3 diets the CLA supplementation (L2-C diets) resulted in lower linoleic and linolenic acid concentrations and the appearance of the two CLA isomers. The main fatty acids (expressed as g/100 g total fatty acids) of the tallow were in decreasing order oleic (37.04 g), palmitic (27.07 g), stearic (20.50 g) and palmitoleic acid (C16:1n-7: 3.35 g) and explains that these fatty acids were more abundant in the L2-T than the other diets. Furthermore, small traces of the c9,t11-CLA isomer were detected in the tallow and then in the diets.
Fatty acid composition of the experimental dietsFootnote †

† Abbreviations are: L2 = grower–finisher diet supplemented with 2% extruded linseed; L3 = grower–finisher diet supplemented with 3% extruded linseed; L2-C = grower–finisher diet supplemented with 2% extruded linseed and 1% CLA-oil; L2-T = grower–finisher diet supplemented with 2% extruded linseed and 1% tallow; SFA = saturated fatty acids; MUFA = monounsaturated fatty acids; PUFA = polyunsaturated fatty acids; c = cis; t = trans; CLA = sum of total conjugated linoleic acid isomers. Fatty acids are expressed as g/100 g total fatty acids and in brackets as g/100 g dry matter of diet.
Fatty acids were designated by the number of carbon atoms followed by the number of double bonds. The position of the first double bond relative to the methyl (n) end of the molecule was also included.
Growth and carcass characteristics
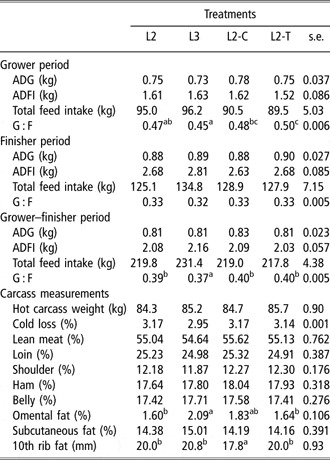
Diets had no effect (P > 0.05) on ADG, ADFI and total feed intake in the grower, finisher and overall experimental period (Table 3). However, because of the numerically higher ADFI and total feed intake, L3 barrows were less efficient (P < 0.05) than L2, L2-C and L2-T barrows. Omental fat percentage was higher (P < 0.05) in L3 barrows compared with L2 and L2-T barrows, with intermediate values for L2-C barrows, whereas neither lean meat percentage nor SF percentage was affected by the diet (Table 3).
Growth performance and carcass characteristics from barrows fed two linseed levels and supplemented with either CLA or tallowFootnote †

a–c Significant effect of the diet (P < 0.05).
† Abbreviations are: L2 = grower–finisher diet supplemented with 2% extruded linseed; L3 = grower–finisher diet supplemented with 3% extruded linseed; L2-C = grower–finisher diet supplemented with 2% extruded linseed and 1% CLA-oil; L2-T = grower–finisher diet supplemented with 2% extruded linseed and 1% tallow; lean meat percentage = sum of denuded shoulder, back and ham weights as percentage of cold carcass weight; omental fat percentage = weight of omental fat expressed as percentage of cold carcass weight; subcutaneous fat percentage = sum of external fat from the shoulder, back and ham expressed as percentage of cold carcass weight.
Nutrient and fatty acid composition of the muscles
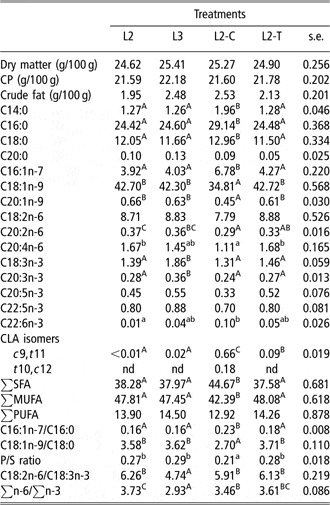
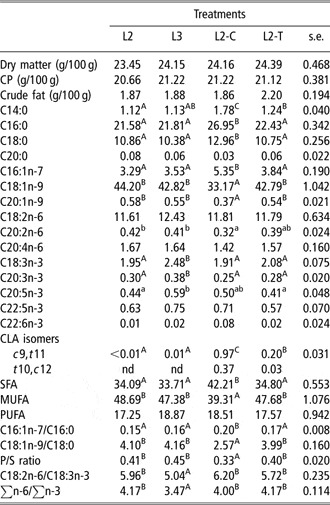
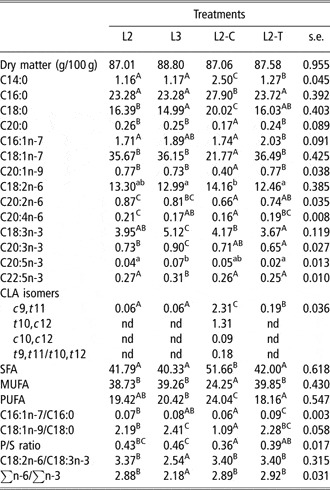
The dietary fat source had no effect (P > 0.05) on the dry matter, CP and crude fat content but markedly altered (P < 0.05) the fatty acid profile of the intramuscular fat of the LM (Table 4), SM (Table 5) and BF (Table 6). Generally, the dietary impact on the fatty acid composition was similar in the three muscles. Between the L2, L3 and L2-T treatments there were only small differences in the fatty acid composition of the muscles except for the higher (P < 0.01) linolenic and eicosatrienoic acid (C20:3n-3) concentrations and the concomitant lower linoleic/linolenic acid and ∑n-6/∑n-3 ratio in the intramuscular lipids of L3 compared with L2 and L2-T barrows. Compared with the other three diets, feeding the L2-C diets increased (P < 0.01) the myristic (C14:0), palmitic, stearic and palmitoleic acid content at the expense of oleic and eicosenoic acid (C20:1n-9) in the intramuscular lipids. Except for the lower (P < 0.05) eicosadienoic acid (C20:2n-6) concentration, feeding the L2-C treatment resulted in similar PUFA concentrations than feeding L2 or L2-T diets. Both main CLA isomers found in the diet were also detected in the muscle tissues. However, in the diet the c9,t11/t10,c12-isomer ratio was 1 : 1, whereas in the intramuscular lipids the c9,t11-isomer was 3.6, 2.5 and 2.6 times more abundant than the t10,c12-isomer in the LM, SM and BF, respectively.
Nutrient content and fatty acid profile of the longissimus muscle from barrows fed two linseed levels and supplemented with either CLA or tallowFootnote †

A–C Significant effect of the diet (P < 0.01).
a,b Significant effect of the diet (P < 0.05).
† Abbreviations are: nd = not detected; L2 = grower–finisher diet supplemented with 2% extruded linseed; L3 = grower–finisher diet supplemented with 3% extruded linseed; L2-C = grower–finisher diet supplemented with 2% extruded linseed and 1% CLA-oil; L2-T = grower–finisher diet supplemented with 2% extruded linseed and 1% tallow; c = cis; t = trans; SFA = saturated fatty acids; MUFA = monounsaturated fatty acids; PUFA = polyunsaturated fatty acids. P/S ratio defined as  . Fatty acids are expressed as g/100 g total fatty acids. Fatty acids were designated by the number of carbon atoms followed by the number of double bonds. The position of the first double bond relative to the methyl (n) end of the molecule was also included.
Nutrient content and fatty acid profile of the biceps femoris from barrows fed two linseed levels and supplemented with either CLA or tallowFootnote †

A−C Significant effect of the diet (P < 0.01).
a,b Significant effect of the diet (P < 0.05).
† Abbreviations are: nd = not detected; L2 = grower–finisher diet supplemented with 2% extruded linseed; L3 = grower–finisher diet supplemented with 3% extruded linseed; L2-C = grower–finisher diet supplemented with 2% extruded linseed and 1% CLA-oil; L2-T = grower–finisher diet supplemented with 2% extruded linseed and 1% tallow; c = cis; t = trans; SFA = saturated fatty acids; MUFA = monounsaturated fatty acids; PUFA = polyunsaturated fatty acids. P/S ratio defined as  . Fatty acids are expressed as g/100 g total fatty acids. Fatty acids were designated by the number of carbon atoms followed by the number of double bonds. The position of the first double bond relative to the methyl (n) end of the molecule was also included.
Nutrient content and fatty acid profile of the semimembranosus muscle from barrows fed two linseed levels and supplemented with either CLA or tallowFootnote †

A–C Significant effect of the diet (P < 0.01).
a–c significant effect of the diet (P < 0.05).
† Abbreviations are: nd = not detected; L2 = grower–finisher diet supplemented with 2% extruded linseed; L3 = grower–finisher diet supplemented with 3% extruded linseed; L2-C = grower–finisher diet supplemented with 2% extruded linseed and 1% CLA-oil; L2-T = grower–finisher diet supplemented with 2% extruded linseed and 1% tallow; c = cis; t = trans; SFA = saturated fatty acids; MUFA = monounsaturated fatty acids; PUFA = polyunsaturated fatty acids. P/S ratio defined as  . Fatty acids are expressed as g/100 g total fatty acids. Fatty acids were designated by the number of carbon atoms followed by the number of double bonds. The position of the first double bond relative to the methyl (n) end of the molecule was also included.
Fatty acid composition of the SF
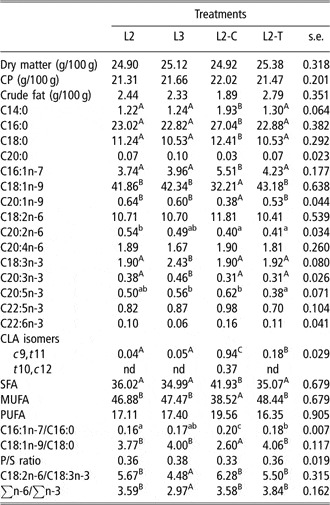
Contrary to the intramuscular fat, the SF of barrows fed the L3 diets had not only higher (P < 0.01) linolenic and eicosatrienoic acid but also EPA and DPA levels were higher (P < 0.05) than in the SF of L2 barrows (Table 7). The increased levels of n-3 fatty acids were compensated by lower (P < 0.01) stearic and arachidonic acid (C20:4n-6) levels. Addition of 1% tallow to the diets (L2-T v. L2) increased (P < 0.01) the myristic and palmitoleic acid concentrations and lowered the eicosadienoic and eicosatrienoic acid concentrations in the SF. Replacing 1% of linseed by 1% of tallow (L3 v. L2-T) in the diet increased (P < 0.01) the myristic acid content and lowered (P < 0.05) the concentrations of the n-3 fatty acids. However, the reported changes were too small to have an impact on the total SFA, MUFA and PUFA tissue levels of L2, L3 and L2-T barrows. As for the fatty acids of the muscle lipids, the adipose tissue of barrows fed the L2-C diets was more saturated than the SF of the barrows in the other three treatment groups mainly because of the higher (P < 0.01) myristic, palmitic and stearic acid and lower (P < 0.01) oleic and eicosenoic acid concentrations. The higher (P < 0.01) PUFA concentration in the SF of L2-C barrows compared with the L2 and L2-T barrows resulted not only from the incorporation of the CLA isomers but also from the higher linoleic acid and the similar content of n-3 fatty acid levels. Furthermore, it is worthwhile mentioning that in contrast to the muscle lipids, the SF contained not only the c9,t11- and t10,c12- but also small traces of the t9,t11/t10,t12- and c10,c12-isomers. The c9,t11/t10,c12-isomer ratio was 1.8 in the SF lipids and thus lower than that in the intramuscular fat, indicating a higher incorporation rate of the t10,c12-CLA isomer.
Dry matter content and fatty acid profile of the subcutaneous fat from barrows fed two linseed levels and supplemented with either CLA or tallowFootnote †

A–C Significant effect of the diet (P < 0.01).
a,b significant effect of the diet (P < 0.05).
† Abbreviations are: nd = not detected; L2 = grower–finisher diet supplemented with 2% extruded linseed; L3 = grower–finisher diet supplemented with 3% extruded linseed; L2-C = grower–finisher diet supplemented with 2% extruded linseed and 1% CLA-oil; L2-T = grower–finisher diet supplemented with 2% extruded linseed and 1% tallow; c = cis; t = trans; SFA = saturated fatty acids; MUFA = monounsaturated fatty acids; PUFA = polyunsaturated fatty acids. P/S ratio defined as  . Fatty acids are expressed as g/100 g total fatty acids. Fatty acids were designated by the number of carbon atoms followed by the number of double bonds. The position of the first double bond relative to the methyl (n) end of the molecule was also included.
Meat quality
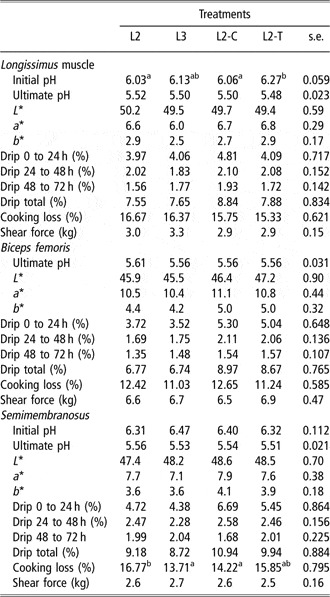
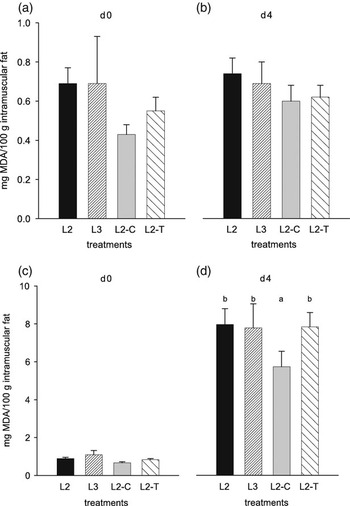
The effects of the supplemented dietary fat sources on meat quality traits were minor (Table 8). Initial pH was lower (P < 0.05) in the LM of L2 and L2-C than in L2-T barrows, with intermediate values in L3 barrows. Compared with the SM of L2 barrows, cooking losses were lower (P < 0.05) in the SM of L3 and L2-C barrows. By contrast, initial pH in the BF and SM and ultimate pH, color, drip loss percentages at all time points and shear force values in all three muscles did not differ between treatments. The extent of lipid oxidation determined in fresh LM samples collected on the day of carcass dissection (Figure 1a; day 0) or LM samples refrigerated for 4 days at 4°C (Figure 1b; day 4) did not differ (P > 0.05) between treatments. When lipid oxidation was determined in cooked LM samples refrigerated for 4 days at 4°C, malonaldehyde values were lower (P < 0.05) in barrows fed the L2-C diet compared with the L2, L3 and L2-T diets.
Meat quality traits determined in three muscles from barrows fed two linseed levels and supplemented with either CLA or tallowFootnote †

a,b Significant effect of the diet (P < 0.05).
† Abbreviations are: L2 = grower–finisher diet supplemented with 2% extruded linseed; L3 = grower–finisher diet supplemented with 3% extruded linseed; L2-C = grower–finisher diet supplemented with 2% extruded linseed and 1% CLA-oil; L2-T = grower–finisher diet supplemented with 2% extruded linseed and 1% tallow.
Lipid oxidation (mg malonaldehyde/100 g intramuscular fat) in the longissimus muscle of barrows fed a grower–finisher diet supplemented with either 2% extruded linseed (L2), 3% extruded linseed (L3), 2% extruded linseed and 1% CLA (L2-C) or 2% extruded linseed and 1% tallow (L2-T). Extent of lipid oxidation was assessed in fresh (a and b) or cooked chops (c and d) the day after slaughter (day 0) or after storage of the samples for 4 days at 4°C in the dark (day 4).

SCD, lipogenic and metabolic enzyme activities
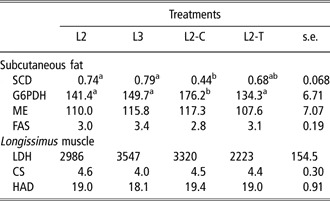
The SCD activity in the SF of barrows fed the CLA-supplemented diets (L2-C) was decreased by almost 50% compared with the barrows fed diets containing two levels of linseed (Table 9). Intermediate activity levels were found in the SF of barrows fed the L2-T diets. In the SF, the G6PDH was higher (P < 0.05) in L2-C than in L2, L3 and L2-T barrows. By contrast, the diets had no effect on the ME and FAS activities in the SF. Aiming to characterize the glycolytic capacity, Krebs cycle activity and lipid β-oxidation, the LDH, CS and HAD activities of the LM were measured. Muscle metabolism was not (P > 0.05) affected by the different dietary treatments.
Activity of steaoryl-CoA desaturase (SCD), glucose-6-phosphate dehydrogenase (G6PDH), malic enzyme (ME) and fatty acid synthase (FAS) in the subcutaneous fat and lactate dehydrogenase (LDH), citrate synthase (CS) and β-hydroxy-acyl-coenzyme A-dehydrogenase (HAD) in the longissimus muscle of barrows fed two linseed levels and supplemented with either CLA or tallowFootnote †

a,b Significant effect of the diet (P < 0.05).
† Abbreviations are: L2 = grower–finisher diet supplemented with 2% extruded linseed; L3 = grower–finisher diet supplemented with 3% extruded linseed; L2-C = grower–finisher diet supplemented with 2% extruded linseed and 1% CLA-oil; L2-T = grower–finisher diet supplemented with 2% extruded linseed and 1% tallow. SCD activity was expressed as nmol oleic acid (C18:1n-9) formed/min per mg microsomal protein; G6PDH and ME activities were expressed as μmol NADPH formed/min per mg protein; FAS activity was expressed as μmol NADPH oxidized/min per mg protein; LDH, CS and HAD activities were expressed as μmol of substrate degraded/min per g fresh tissue.
Discussion
In line with results of previous studies (Bee and Wenk, Reference Bee and Wenk1994; Riley et al., Reference Riley, Enser, Nute and Wood2000; Vorin et al., Reference Vorin, Mourot, Weill, Robin, Mounier and Peiniau2003; Nuernberg et al., Reference Nuernberg, Fischer, Nuernberg, Kuechenmeister, Klosowska, Eliminowska-Wenda, Fiedler and Ender2005), neither increasing the linseed content by 10 g/kg diet (L3 v. L2) nor altering the dietary fatty acid composition by using fat sources differing in their fatty acid composition (L3 v. L2C v. L2T) affected daily growth rate, feed intake, lean meat and SF percentage. Nevertheless, due to numerically higher daily feed intake, L3 barrows were less efficient, primarily in the grower period, than barrows in the other treatment groups. The impact of the lower feed efficiency on carcass characteristics was restricted to the higher omental fat percentage. The backfat thickness at the 10th rib level but not the overall SF deposition was reduced in carcasses of barrows fed the CLA-fortified diet, which is in line with our earlier work using pigs of the same genetic background (Bee, Reference Bee2001). Our findings contradict with results of other studies reporting lower fat deposition due to CLA feeding (Dugan et al., Reference Dugan, Aalhus, Schaefer and Kramer1997; Ostrowska et al., Reference Ostrowska, Suster, Muralitharan, Cross, Leury, Bauman and Dunshea2003). The discrepancy among these results might be explained by the differences in the overall fatness of the carcasses (Eggert et al., Reference Eggert, Belury, Kempa-Steczko, Mills and Schinckel2001), the impact of CLA being greater in fatter pigs than in leaner pigs.
Compared with previous studies using similar basal grower–finisher diets (Bee, Reference Bee2001; Bee et al., Reference Bee, Guex and Herzog2004), linseed supplementation of such diets resulted in a markedly higher linolenic acid, EPA and DPA content in the intramuscular and SF lipids, which confirms the results of other studies (Riley et al., Reference Riley, Enser, Nute and Wood2000; Kouba et al., Reference Kouba, Enser, Whittington, Nute and Wood2003). In accordance with the aforementioned studies, n-3 fatty acid accumulation rate differed among tissues as dietary linseed caused a greater increase in linolenic acid level and its elongated product eicosatrienoic acid in the SF than in the muscles. However, the levels of the desaturated products EPA and DPA were greater in muscles than in the SF. Furthermore, we report differences in the n-3 fatty acid concentrations between muscles; the overall linolenic acid levels (BF: 2.10, SM: 2.04, LM: 1.50 g/100 g total fatty acids) were highest in the BF and the DHA (BF: 0.66, SM: 0.83, LM: 0.80 g/100 g total fatty acids) levels were highest in the SM and LM. Riley et al. (Reference Riley, Enser, Nute and Wood2000) and Kouba et al. (Reference Kouba, Enser, Whittington, Nute and Wood2003) showed that linolenic acid was preferentially incorporated into the neutral lipid fraction, whereas EPA, DPA and DHA were more prevalent in the phospholipid fraction. The intramuscular fat content was on average 0.4% higher in the SM compared with the BF. This difference can be explained by an increased level of neutral lipid rather than phospholipid, the latter being very constant and independent of the total intramuscular fat content (Cameron et al., Reference Cameron, Enser, Nute, Whittington, Penman, Fisken, Perry and Wood2000). Thus, the higher DHA concentrations in the SM than in the BF might result from its higher accumulation rate. In agreement, the ratio of the (EPA + DPA + DHA)/linolenic acid, an estimate of the extent to which fatty acids are synthesized from linolenic acid (Riley et al., Reference Riley, Enser, Nute and Wood2000), was higher in the SM (0.73) than in the BF (0.56). This ratio was even higher in the LM (0.87), suggesting a greater desaturation rate in this muscle. The latter might explain the lower linolenic acid concentration in the LM compared with the BF and SM.
Similar to results of previous studies (Riley et al., Reference Riley, Enser, Nute and Wood2000; Matthews et al., Reference Matthews, Homer, Thies and Calder2000), increasing the dietary amount of linseed increased the tissue concentration of linolenic acid. In the present study, the additional increase of the supplied linseed (L3 v. L2) raised the amount of deposited linolenic acid on average by 30% in muscle (ranging from 26% in the SM to 34% in the LM) and SF lipids. Assuming a linear increase in the tissue as the dietary linolenic acid intake increases, the observed tissue concentrations were lower as expected, suggesting a lower tissue incorporation rate at higher dietary supply (Kloareg et al., Reference Kloareg, Noblet and van Milgen2007). However, it appeared that an additional part of the dietary linolenic acid was elongated, as the eicosatrienoic acid concentration was consistently higher (on average 25%, ranging from 21% (SM) to 29% (LM)) in the muscles and in the SF. By contrast, higher EPA and DPA levels were observed only in the BF and SF and in the SF, respectively. This leads to the conclusion that the activities of the Δ6- and Δ5-desaturase and elongase were only partly increased in the L3 treatment. Matthews et al. (Reference Matthews, Homer, Thies and Calder2000) showed that the n-3 fatty acid concentrations could be markedly elevated (linolenic acid: 3.3 to 3.9 g/100 g fatty acids) in the LM and adipose tissues (linolenic acid: 7.7 to 9.0 g/100 g fatty acids) when higher (5% or 10% in the diet) amounts of linseed are offered. However, in line with our observation, no treatment-related differences were observed for the EPA and DHA concentrations, suggesting that desaturation and elongase activity are limited. In accordance with previously reported results (Matthews et al., Reference Matthews, Homer, Thies and Calder2000; Riley et al., Reference Riley, Enser, Nute and Wood2000; D’Arrigo et al., Reference D’Arrigo, Hoz, Lopez-Bote, Cambero, Pin, Rey and Ordóñez2002b; Kouba et al., Reference Kouba, Enser, Whittington, Nute and Wood2003), feeding linseed even at higher levels had no beneficial impact on the DHA concentration.
The higher degree of saturation of muscle and adipose tissue lipids of L2-C barrows resulted primarily from the higher palmitic and stearic acid levels. Their concentrations are, on the one hand, dictated by the de novo fatty acid synthesis and, on the other hand, by their desaturation to palmitoleic and oleic acid via SCD. By contrast, the dietary SFA supply has only a minimal impact (Morgan et al., Reference Morgan, Noble, Cocchi and McCartney1992) as evidenced by the similar palmitic and stearic acid tissue levels in L2-T, L2 and L3 barrows despite their higher concentrations in the L2-T compared with the other diets. In accordance with previous results (Bee, Reference Bee2001; Kouba et al., Reference Kouba, Enser, Whittington, Nute and Wood2003) in the SF, neither the activity of FAS, the enzyme regulating the final step of the de novo fatty acid synthesis, nor the activity of ME, the main producer of NADPH for the reductive biosynthesis of fatty acids, was altered by the higher linseed supply (L3) or the inclusion of CLA (L2-C) or tallow (L2-T). We recently reported that the impact of dietary fat on lipogenic enzyme activity was similar for various tissues (Bee et al., Reference Bee, Gebert and Messikommer2002). Therefore, one can assume that what was observed in the SF is also true for the other evaluated tissues in this study. The lacking dietary effect on the de novo lipogenesis allows concluding that in the tissues of L2-C barrows desaturation of SFA occurred at a slower rate. Indirectly, the lower desaturation indexes (expressed as C16:1n-7/1C16:0; C18:1n-9/C18:0) in the adipose and muscle tissues confirms the lower conversion rate of palmitic/stearic to palmitoleic/oleic acid. The direct determination of the SCD activity in the SF clearly evidenced that the enzyme activity was depressed by CLA, which concurs with the findings of Smith et al. (Reference Smith, Hively, Cortese, Han, Chung, Castenada, Gilbert, Adams and Mersmann2002). In contrast to the present results where no effect on SCD activity of linseed was observed, Kouba et al. (Reference Kouba, Enser, Whittington, Nute and Wood2003) reported lower SCD activity in the adipose tissue of pigs fed crushed linseed compared with pigs fed a control diet for 60 days. The effect on SCD activity vanished when the pigs were offered the same diets for 100 days. Interestingly, the extent of SCD activity concurred with the linolenic acid tissue concentration being markedly higher after 60 days than after 100 days.
Unsaturated tissue lipids affect the storage stability of the carcass through oxidative breakdown, resulting in the development of peroxides and rancidity. Lipid peroxidation is a major cause of deterioration in the quality of muscle foods and can directly affect many meat characteristics such as flavor, color, texture, nutritive value and food safety (Nuernberg et al., Reference Nuernberg, Fischer, Nuernberg, Kuechenmeister, Klosowska, Eliminowska-Wenda, Fiedler and Ender2005). The balance between antioxidants and pro-oxidants and the composition of skeletal muscle influences the susceptibility of muscle lipids to oxidation (Lauridsen et al., Reference Lauridsen, Nielsen, Henckel and Sorensen1999). In the present study, all diets were supplemented with the same amount of vitamin E and, thus, the susceptibility for oxidation differed primarily on the amount of pro-oxidants in the form of unsaturated lipids. Apparently, the amount of supplied vitamin E was sufficient to avoid involuntary oxidation at day 0 and day 4 of storage as well as after cooking because TBARS values determined in the LM chops were unaffected by the fatty acid profile. However, when oxidative stress was increased by cooking and subsequent storage for 4 days at 4°C, oxidation was lowest in the L2-C group as evidenced by the lower TBARS values. A possible reason for the lower susceptibility for oxidation might be the lower MUFA concentration as shown before.
In conclusion, this study confirmed that with moderate dietary inclusion of linseed the amount of linolenic acid and, except for DPA in the SF, the content of its long-chain (C20-22) derivates can be efficiently elevated. Furthermore, the ∑n-6/∑n-3 ratio of tissue lipids reached values of ⩽4, values that fulfill the requirements of a healthy fat. Although the dietary CLA supply resulted in the incorporation of the c9,t11- and t10,c12-isomers, these isomers did not inhibit desaturation of linolenic acid. The EPA, DHA and DPA contents were as high or even higher in the intramuscular tissues of L2-C barrows and consequently the ∑n-6/∑n-3 ratio was as low as when only linseed was fed. Furthermore, CLA inclusion also had a protective effect on lipid oxidation when oxidative stress was elevated. These positive effects could not be obtained with tallow.