1 Introduction
1.1 Motivation
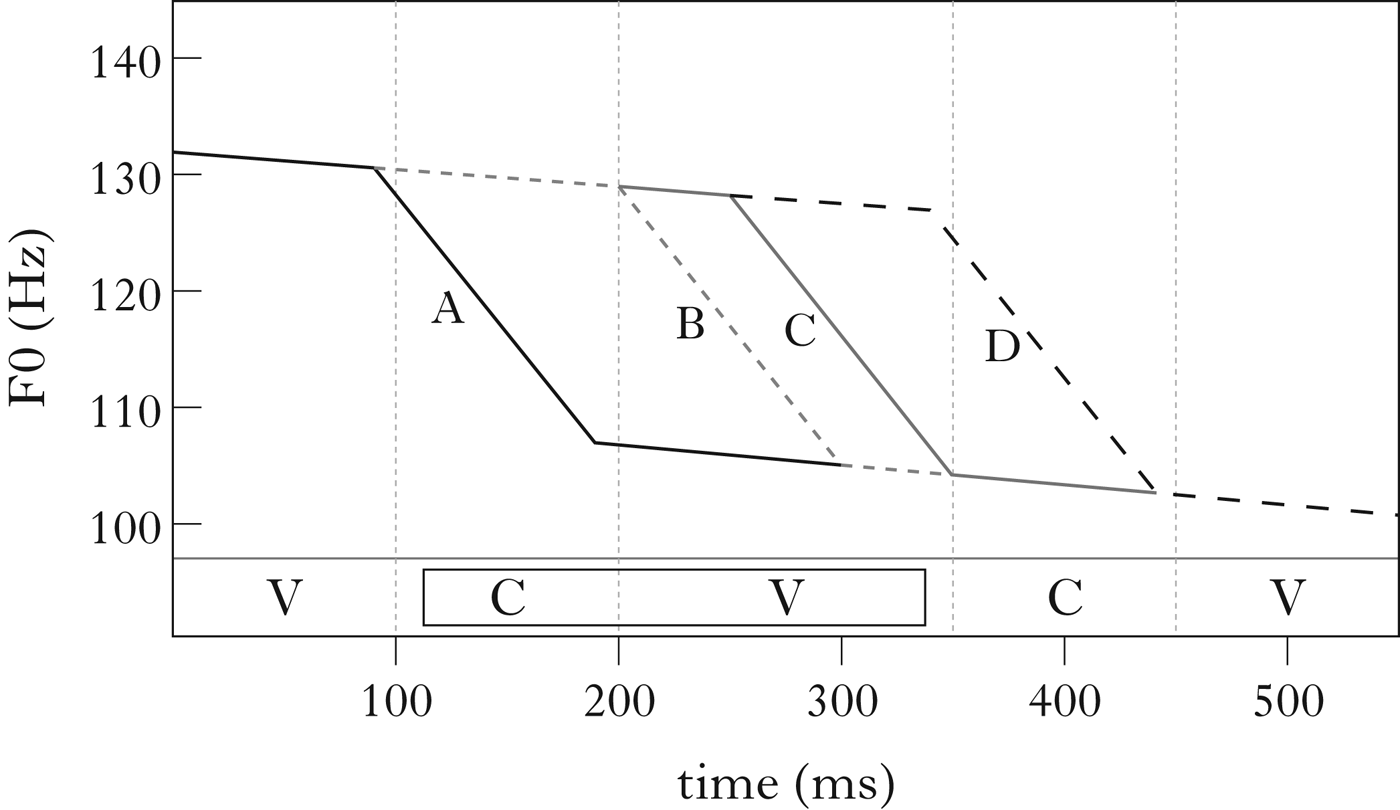
Tonal alignment involves the timing of fundamental frequency (F0) patterns relative to the sequence of speech segments. This timing relation determines how a tone pattern is perceived. For example, starting out from a high F0, a F0 fall that takes place before or during the onset consonant of a syllable, represented schematically in the trace labelled A in Fig. 1, yields a low pitch impression on that syllable. If the same F0 drop sets in near the end of the syllable, as in trace D in Fig. 1, this results in the syllable being perceived with high pitch. In this way, the timing of changes in F0 determines the perceived pitch. The controversy at issue in this paper relates to F0 changes where a fall takes place within the syllable rhyme. This configuration is illustrated in traces B and C. Because the vowel is the most salient part of the syllable in perceptual terms, F0 changes from high to low in this domain are liable to be perceived as falling pitch. Such patterns are known as falling contour tones. They can be represented phonologically by associating the two tone targets – high and low – within the same syllable constituent (Yip Reference Yip1989).
Schematic representations of four alignment (timing) patterns, labelled A–D, of a drop in F0 relative to a CV syllable (boxed).

The question at the centre of the current study is whether a language can have two falling contour tones that diverge primarily in tonal alignment – the contrast represented by traces B vs. C in Fig. 1. It is widely hypothesised that this is not possible. In fact, it is assumed that tonal alignment is not contrastive in contour tones in general, i.e. both in falling and in rising configurations (Hyman Reference Hyman1988, Odden Reference Odden and Goldsmith1995, Silverman Reference Silverman1997, Yip Reference Yip2002, Xu Reference Xu2005, Xu & Liu Reference Xu and Liu2006). This hypothesis is stated in (1), for reference throughout this paper.
-
(1)


This hypothesis does not stem from a theoretical prediction, but instead from the lack of evidence for such contrasts in the world's languages. Hyman (Reference Hyman1988) observes that two theoretical assumptions of autosegmental theory have a bearing on this issue: (a) the mora, i.e. the weight unit below the syllable level, can serve as a tone-bearing unit, and (b) two tonal nodes can be associated with the same tone-bearing unit. On this basis, it is predicted that a contrast between the two configurations in (2) can occur (from Hyman Reference Hyman1988: 50).
-
(2)
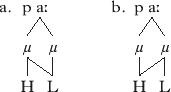
If such contrasts are in fact unattested, then the theory is not sufficiently restrictive, Hyman argues, and he proceeds to postulate a rule to ensure that ‘there is no possible opposition between two HL or two LH contours where the two tones are synchronized differently within the syllable’ (Hyman Reference Hyman1988: 51). Similarly, Odden (Reference Odden and Goldsmith1995: 474) writes: ‘it might be that in some languages pitch changes are timed relatively early in the syllable, and in other languages they are timed relatively late. Such control would only be phonetic, never phonological’. Hypothesis (1) is not specific to autosegmental theory. In the PENTA theory (Xu Reference Xu2005, Xu & Liu Reference Xu and Liu2006), F0 targets are always specified at the syllable endpoints, and the alignment of tone targets is not a parameter that can be specified. Instead, alignment falls out indirectly, through the interaction of the syllable-final targets with other parameters.
It should be noted that the scope of (1) is restricted to configurations where the same two targets are aligned differently within the same syllable. It does not rule out a contrast like that of the Fall vs. High tones in Thai (Morén & Zsiga Reference Morén and Zsiga2006). Here tonal alignment conditions a difference in tonal shape over the syllable domain, as in C vs. D in Fig. 1. The same goes for configurations in which one of the tone targets is a leading or trailing tone which associates in a different syllable, such as the contrast of H+L* vs. H*+L postulated for European Portuguese (Frota Reference Frota, Gussenhoven and Warner2002), or the contrast of L*+H vs. L+H* postulated for American English (Pierrehumbert & Steele Reference Pierrehumbert and Steele1989).
Hypothesis (1) is plausible both in the context of the typology of tone and given the evidence from F0 production and perception. In an extensive cross-linguistic survey, Zhang (Reference Zhang2001, Reference Zhang, Hayes, Kirchner and Steriade2004) finds that the distribution of contour tones in languages that have them is in most cases limited to environments that offer greater sonorous duration (i.e. a longer F0-conducting domain), as a result of syllable weight, stress or prosodic domain structure. Given that contour tones are apparently difficult to implement across syllable shapes, the scenario of two contour tones of the same shape, diverging primarily in alignment, is unlikely. The available phonetic evidence is in line with this interpretation. With respect to speech production, Xu & Sun (Reference Xu and Sun2002) conclude that implementing an F0 change takes considerable time, because F0 changes slowly at the turning points. On the perception side, the minimum excursion size for an F0 change to be perceived as a pitch contour increases as the domain over which the F0 change takes place decreases (Rossi Reference Rossi1978, Greenberg & Zee Reference Greenberg and Zee1979, 't Hart Reference Hart, René and Cohen1990et al.). This phenomenon, known as the glissando threshold, constrains against contour tones on constituents with less sonorous duration.
Nonetheless, there is some evidence of contrastive alignment in contour tones. Dinka, a Western Nilotic language of South Sudan, has a contrast between early- and late-aligned falling contours (Andersen Reference Andersen1987, Remijsen Reference Remijsen2013). (3) presents relevant minimal sets. In these examples, the early-aligned falling contour is transcribed with a low-tone diacritic (`), because it is a context-conditioned allophone of the Low-tone category. The late-aligned falling contour is transcribed with the falling-tone diacritic (∘).Footnote 1
-
(3)

Quantitative analyses of these and similar sets indicate that tonal alignment is distinctive in Dinka, both when time pressure is smaller (CVVC) and when it is greater (CVC). The peak defining the beginning of the fall in early-aligned falls in utterance-final position is about 40 ms earlier than that for late-aligned falls. The difference in F0 height is not significant. Moreover, DiCanio et al. (Reference DiCanio, Amith, García, Gussenhoven, Chen and Dediu2014) present evidence of contrastive alignment in rising contours in Yoloxóchitl Mixtec.
If a language can have two contour tones of the same shape, distinct in terms of their alignment, then it should be possible for these contours to be in contrast not only relative to one another, but also relative to phonetically similar level tone categories within the same inventory. To invoke a segmental parallel, the phonological representation of two vowels that sound like [e] and [ɛ] depends on the categories they are in contrast with. If they are in contrast with two other vowels that sound like [i] and [a], then postulating the phonological categories /i/, /e/, /ɛ/ and /a/ is plausible. If, however, there is no evidence of, say, [i], then one could consider [e] as the phonetic realisation of /i/. Coming back to the topic of tone, this can be illustrated on the basis of the schematic representations in Fig. 1. If the early-aligned configuration (B) is indeed phonologically a contour, it should be potentially distinct from the low level configuration (A), where there is a high target on the preceding syllable. Evidence of this sort, that the contours contrast with phonetically similar level tones, is all the more important because what is a contour in acoustic terms (F0) may sound like a level pitch pattern, and be interpreted as such in the phonological representation (e.g. Hyman Reference Hyman2010: 203). Moreover, just as in the front-vowel example above, if a language has a phonetic early-aligned falling-tone pattern, and this pattern does not contrast with a phonetic low-tone pattern, considerations of analytic economy may compel the researcher to represent this early-aligned fall as a Low-tone category, attributing the falling realisation to phonetic implementation. In this context, evidence of a contrast between a tone category involving low F0 on the target syllable and one involving an early falling F0 configuration strengthens the case that the latter is a falling contour not just in phonetic terms, but also phonologically. The same applies to the contrast between a late falling configuration and a high one: if the late-aligned fall (C) is a two-target phonological category, it should be potentially contrastive in relation to a configuration in which only a high target is associated with the syllable (D).
On this issue, the late-aligned fall of Dinka is indeed in contrast with a level high tone (e.g. /ā-lêel/ ‘decl.sg-provoke.pass’ vs. /ā-léel/ ‘decl.sg-provoke.2sg’). However, the difference between the early-aligned fall and the low level configuration is of a different status. These two tonal shapes are allophonic variants of the same tone category. The variation between these two allophones shows no overlap, either in distribution or in phonetic realisation (one involves a high initial target; the other one does not). Importantly, there has as yet been no report of a language in which all four of the alignment patterns represented schematically in Fig. 1 distinguish lexical/morphological forms. This paper presents evidence for such a configuration, from Shilluk.
The paper is structured as follows. §1.2 provides background information regarding the Shilluk tone system. In §1.3, the alternative hypothesis, that tonal alignment is contrastive in falling contour tones, is spelled out in relation to the Shilluk phenomena. §2 and §3 present the methodology and results of a production study in which the null hypothesis in (1) and this alternative hypothesis are put to the test. In §4, we summarise the results and reflect on their implications.
1.2 Relevant characteristics of Shilluk
The Shilluk language is part of the Western Nilotic group of languages, which is itself a unit within the wider Nilo-Saharan language family (Lewis et al. Reference Lewis, Simons and Fennig2014). It is spoken primarily in South Sudan, in an area along the White Nile, near the town of Malakal. This section provides background information on the Shilluk tone system. We pay special attention to transitive verbs, because the target words in the acoustic study reported on in the following sections belong to that part of the grammar.
1.2.1 Suprasegmental distinctions of tone and vowel length
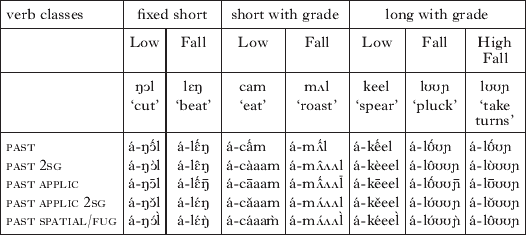
Content-word roots in Shilluk are primarily closed monosyllables (Remijsen et al. Reference Remijsen, Ayoker and Mills2011). This is illustrated by the transitive verb forms in Table I. To the best of our knowledge, all native transitive verb roots in Shilluk are closed monosyllables. Another important characteristic is that content words, and transitive verbs in particular, take a rich array of inflections, in which stem-internal marking predominates over affixation. This is again shown in Table I: while all forms carry a prefix marking past tense, other inflections – for 2nd person singular, applicative and spatial deixis – are marked through stem-internal exponence.Footnote 2 There are many more examples (see Remijsen et al. in press).
Illustrations of the lexical and morphological specification of vowel length and tone in a subset of the paradigms of verbs representing each of the seven classes of transitive verbs. From Remijsen et al. (in press).

The forms in Table I show that there is a ternary contrast in vowel length in Shilluk: the vowel of the stem syllable of content words is either short (V), long (VV) or overlong (VVV). For affixes and function morphemes, there is a binary contrast: short (V) vs. long (VV). Two minimal sets for the ternary contrast are presented in (4).
-
(4)
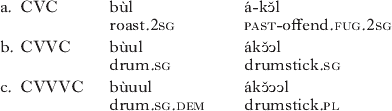
As can be seen from the glosses in (4), vowel length also plays an important role in the morphology of nouns. Specifically in transitive verbs, there are three patterns relating to vowel length, illustrated in Table I. First, some verbs retain a short vowel throughout their paradigm (fixed short), whereas others have a long grade, i.e. their stem vowel lengthens morphologically. In the latter, the stem vowel alternates either between short and overlong (short with grade) or between long and overlong (long with grade). This system is laid out in detail in Remijsen et al. (in press).
A total of eight distinctive tone categories are found on the monosyllabic
stem syllable of transitive verbs. There are three level patterns, Low
(C C), Mid (C
 C), and High
(C
 C), as well as the Rise
(C
 C) and four falls. Three of
the falls have as their initial target the same level as the High tone: the
Early High Fall (C
 C), the Late High Fall
(C
 ) and the High Fall to Mid
(C
 ).Footnote
3
For the Early Low Fall (C
 C), the
initial target corresponds to the level of the Mid tone. In transitive
verbs, the specification for tone is partly lexical, i.e. based on verb
class, and partly morphological. The difference in tone between verb classes
can be seen in Table I by
comparing the 2nd singular forms of Low and Fall verb classes, or by
comparing the spatial deixis form of the High Fall class with other classes.
Tone also plays an important role in the morphology. Note that each of the
verbs in Table I appears with five
different tone patterns on the stem syllable. These specifications for tone
are regular within the seven verb classes. An example of a minimal set
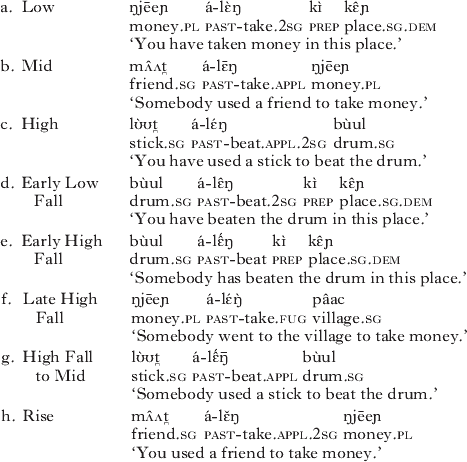
involving the eight tone categories is presented in (5), on the basis of the inflections introduced in
Table I. Each category is
illustrated by an inflection taken from the paradigm of one of two
transitive verbs, /lɛŋ/ (fixed short, Low)
‘take (gradually)’ and /lɛŋ/
(fixed short, Fall) ‘beat (a drum)’. The eight tone
categories are equally distinctive in other lexical classes. The tonal
specification of function morphemes is limited to the level tones (Low, Mid,
High).
-
(5)
1.2.2 Underlying vs. surface phonological specifications
We interpret the eight categories distinguished above as underlying
specifications, in the sense that they cannot be predictably derived from a
combination of more basic tonal elements. In fact, there are additional tone
patterns that are contrastive in the surface phonology, but these can be
derived predictably, and are therefore not to be considered to be
underlying. One of these is found only in the demonstrative inflection of
singular nouns that have the Mid tone as their underlying specification,
where it adds a low end target: e.g. /kw ʌʌ
 /
‘porridge.dem’ from /kwn/
‘porridge’, and /
 āaa
 /
‘cooking.dem’ from /āal/
‘cooking’. Comparison with demonstrative forms such as
/m
 in-/
‘heart.sg.dem’ and /l
 m-/
‘soil.sg.dem’ (from /m
i
in-
 /
‘heart.sg’ and /lʌʌp-/
‘soil.sg’ respectively) shows that the
low specification in these contours can be attributed to a Low tone, which
appears on a separate syllable elsewhere in the synchronic morphology.
Other surface phonological tone patterns result from the interaction between lexical-morphological tone and intonation. A Low boundary tone appears in utterance-final position in yes/no-questions. Two examples of this appear in (6). (Yes/no questions also involve an increase in the F0 range over the last content word of the utterance. This is what sets them apart when the word-level tonal specification ends in a Low target.)
-
(6)

Crucially, for the eight tone patterns displayed in Table I and (5), there is no evidence for such a decomposition in the synchronic phonology, even though many of these tonal inflections on the stem syllable undoubtedly have their diachronic origin in lost suffixes (cf. Andersen Reference Andersen1990). These eight underlying specifications are all found on syllables with short (CVC) and overlong (CVVVC) vowels, and most of them are also found on syllables with long vowels (CVVC). This state of affairs suggests that the tone-bearing unit is the syllable rather than the mora, an issue we will come back to in §4.2.5.
1.2.3 The stability of tonal specifications
The underlying lexical and morphological specifications for tone are stable across utterance contexts. Here we discuss this issue of stability specifically in relation to the Early High Fall and the Late High Fall, the falling contours at the centre of this study. The main potential contextual factor to consider in relation to the Early High Fall is the preceding tonal context. (7) shows that the Early High Fall can be found without a High-toned prefix. More generally, the high initial target of this contour is present whatever the preceding context may be. In this respect the status of the early-aligned fall in Shilluk differs from the situation in Dinka, where it is an allophone of Low (Remijsen Reference Remijsen2013).
-
(7)
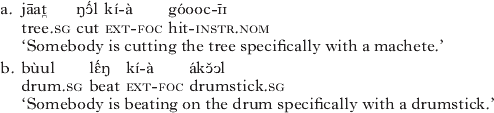
In relation to the Late High Fall, we need to look to the right for potential sources of contextual influence. In the Bor South dialect of Dinka, for example, an underlying specification for Fall (HL) turns into a High tone whenever the syllable with which the underlying Fall is associated is not in utterance-final position. There is no evidence of such a contextual process in Shilluk. As seen from (8a), the Late High Fall is found in both utterance-final and utterance-medial contexts. Comparable evidence relating to the Early Low Fall is presented in (8b).
-
(8)

Also of interest in relation to the Late High Fall is the environment with a following High tone, i.e. the maximally dissimilar juncture in terms of underlying specification. (9) shows two examples of this configuration, which reveal that the Late High Fall is unaffected by a following High target. For the sake of comparison, examples with the Late High Fall followed by a Early Low Fall or Low tone can be found in (5f) and (8a).
-
(9)

This phonological stability of underlying specifications is a general characteristic of the Shilluk tone system. This is particularly clear in (7b), which consists of a sequence of dissimilar targets in terms underlying specification, which are all rendered in the surface phonology. We know of no phonological tone-sandhi processes above the word level.Footnote 4 Specifically in relation to the Early High Fall and the Late High Fall, the evidence in this section makes clear that these are not the surface phonological outcome of contextual processes involving more basic tonal shapes. Instead, these are underlying specifications, and, phonologically, they withstand assimilatory pressures.
1.3 The competing hypotheses
Our descriptive analysis of the Shilluk tone system includes two high-to-low falling contours: the Early High Fall and the Late High Fall. We postulate that these two contours involve the same sequence of tone targets, High and Low, and that the contours differ from one another in terms of tonal alignment. We further postulate that these contours are also in contrast with level tone categories Low and High. If this interpretation of the Shilluk tone system is correct, then Shilluk displays a configuration similar to the one represented schematically for an open syllable in Fig. 1. Our hypothesis is that tonal alignment distinguishes Early High Fall from Late High Fall and also from Low. And likewise, we hypothesise that tonal alignment distinguishes Late High Fall not only from Early High Fall but also from High. Concretely, this hypothesis predicts that, in a preceding context specified for High tone, and a following context specified for Low tone, the categories Low, Early High Fall, Late High Fall and High are realised through four different patterns of tonal alignment, as in Fig. 1. This hypothesis contradicts the null hypothesis in (1), i.e. that tonal alignment is not contrastive in contour tones. If, on the contrary, (1) is true, then a parameter other than tonal alignment must distinguish Early High Fall and Late High Fall from one another. The tone height of the initial and final targets are of particular interest here, because, if contour tones cannot differ in terms of timing, they may instead differ in the height of the constituent tone targets, as noted by Yip (Reference Yip2002: 29).
2 Methods
2.1 Materials
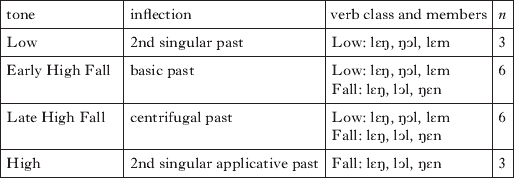
The production study described in this section is designed to evaluate the two competing hypotheses considered above.Footnote 5 In the design of this study, the factor Tone is critical to the evaluation of the competing hypotheses spelled out in §1.3. The factor Tone has the factor levels Low, Early High Fall, Late High Fall and High. These tonal specifications were investigated on syllables that have a short vowel. The intended specifications for tone and vowel length were selected from the morphology of transitive verbs, as shown in Table II.
Specifications for the factor levels of Tone, in terms of inflection, verb class, segmental shape and number of items. The notion of verb class is illustrated in Table I.

As can be seen from Table II, both the onset and the coda of the target syllable are either a nasal or /l/. These consonants present two characteristics that are useful in the study of F0: they involve minimal perturbation of F0, and their boundaries can be segmented easily on the basis of their spectrogram and waveform. The vowel is either /ɛ/ or /ɔ/, which are both low-mid vowels, thereby minimising variability in vowel duration. A complete set in context is shown in (10).
-
(10)

As seen from (10), the
preceding context is constant with respect to tone specification. This is
achieved through the use of a pronoun as the preverbal argument:
/gìk-án / or
/gìn-án/. Because of this preceding
context, and because all of the verb forms are prefixed with the High-toned past
tense marker, the target syllable is invariably preceded by a high plateau. The
preceding tonal context is kept constant, to ensure that declination and
downstep do not confound the interpretation of the results for F0 height. The
context following the target word consists of one or two syllables, and the
tonal specification of the syllable that immediately follows the target verb
stem is Low or Low Fall, i.e. a non-high tonal specification.
2.2 Speakers
The dataset consists of recordings from nine native speakers of Shilluk (8 male and 1 female).Footnote 6 They are all from Tonga, the cluster of villages at the western tip of the Shilluk-speaking area. Little is known about dialect variation in Shilluk, so we deemed it prudent to keep the dialect constant. Most speakers were recorded in Tonga; others were recorded in Juba, the capital of South Sudan, and one in Malakal, the regional centre nearest to Tonga.
2.3 Elicitation procedure
All forms of the same lexical verb were elicited together in one block. Within each of these lexical verb blocks, the elicitation was built up from the basic past tense with a semantically fitting argument towards the various target inflections with a pronominal preceding context. Filler blocks in which the verb form has a long or overlong vowel were interspersed between the blocks relevant for this study. On average, we recorded two realisations for each item on the elicitation list. The blocks for the various lexical verbs were elicited in two orders, to balance out order-of-presentation effects.
The data were collected through spoken interaction. Most speakers also spoke English, enabling the first author to elicit the utterances. The Shilluk sentences to be recorded are succinct relative to their English equivalents (see e.g. (5) and (10)). In order to avoid periphrastic Shilluk translations, we found it helpful to use gestures to convey some dimensions of meaning that are marked morphologically on the verb. For example, an arm movement away from the body was used to convey centrifugal deixis. The second author monitored the utterances produced, signalled when an unintended inflection had been used, and explained the target inflections to the speakers in Shilluk whenever confusion arose. One speaker did not speak English. In this case the second author led the elicitation in Shilluk.
2.4 Data processing
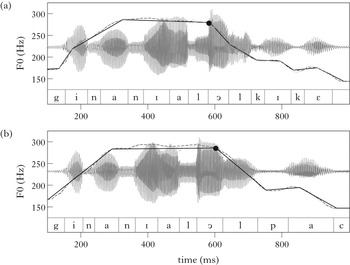
Praat (Boersma & Weenink Reference Boersma and Weenink2013) was used both for data processing and for scripted measurements. In the first step of processing, utterance-sized sound files were extracted from the raw recording files. Within these sound files, we segmented the constituent speech sounds of the target syllable, the hiatus sequence that precedes this syllable ([ia]) and the vowel that follows it. In the process, several tokens were excluded, either because of a disfluency or because of the presence of an intonational break before the target word. Following this phase, there were 293 segmented tokens. Then the F0 traces were created; each trace was visually checked for tracking errors due to non-modal phonation. A handful of tokens were corrected at this point, by selecting the correct candidate in the Pitch object in Praat. The checked traces were then automatically trimmed for spikes, using the algorithm in Xu (Reference Xu1999). The effect of trimming can be observed in Fig. 2, where the raw F0 is represented as a light grey dotted line, and the trimmed F0 trace as a dark grey dashed line. The trimmed trace mostly follows the raw trace, to the extent that it is largely invisible. However, the trimmed trace does smooth out the local spikes at the boundaries between vowels and adjacent sonorants – see e.g. the boundaries of the /l/'s in Fig. 2b.
Utterance tokens of (a) the Early High Fall and (b) the Late High Fall, uttered by a male speaker. Each panel shows the segmented waveform, the raw F0 trace (dotted line, light grey), the trimmed F0 trace (dashed line, dark grey) and the stylised F0 trace (solid line, black). The circle indicates the automatically determined high turning point.

An important challenge was how to measure tonal alignment. The goal here is to determine the location of a substantial F0 change in the region of the target word. The beginning of this F0 drop is the high turning point. Due to declination, and because it is preceded by a high plateau, the high turning point cannot be determined on the basis of an F0 maximum. In the utterance tokens in Fig. 2, for example, the maxima in the high plateau are not at its right edge. Nonetheless, it is clear roughly where the high turning point is: where the high level F0 starts falling steeply. We did not want to determine the high turning point ‘by hand’, that is, on the basis of our own subjective interpretation of the traces, because this measurement is at the centre of the evaluation of the competing hypotheses. Instead, we used the following fully automatic procedure, implemented as a Praat script. The trimmed trace was stylised, using Praat's stylisation feature. This algorithm removes points from the source F0 trace, until further removal would result in a discrepancy (relative to the source trace) exceeding a threshold value. We set this threshold at 1 semitone.Footnote 7 The outcome of this stylisation is illustrated by the solid black traces in Fig. 2. We then determined the largest F0 drop within the domain from one-third into the hiatus sequence [ia] up to the end of the vowel following the target word. The turning point at the start of the greatest drop is the high turning point, marked by a circle in Fig. 2.
The measurements were aggregated over repetitions, ahead of the statistical analyses, yielding 154 types from the original 293 tokens. With 18 lexical/morphological forms and nine speakers, the possible total was 162, meaning that eight values were missing.Footnote 8
3 Results
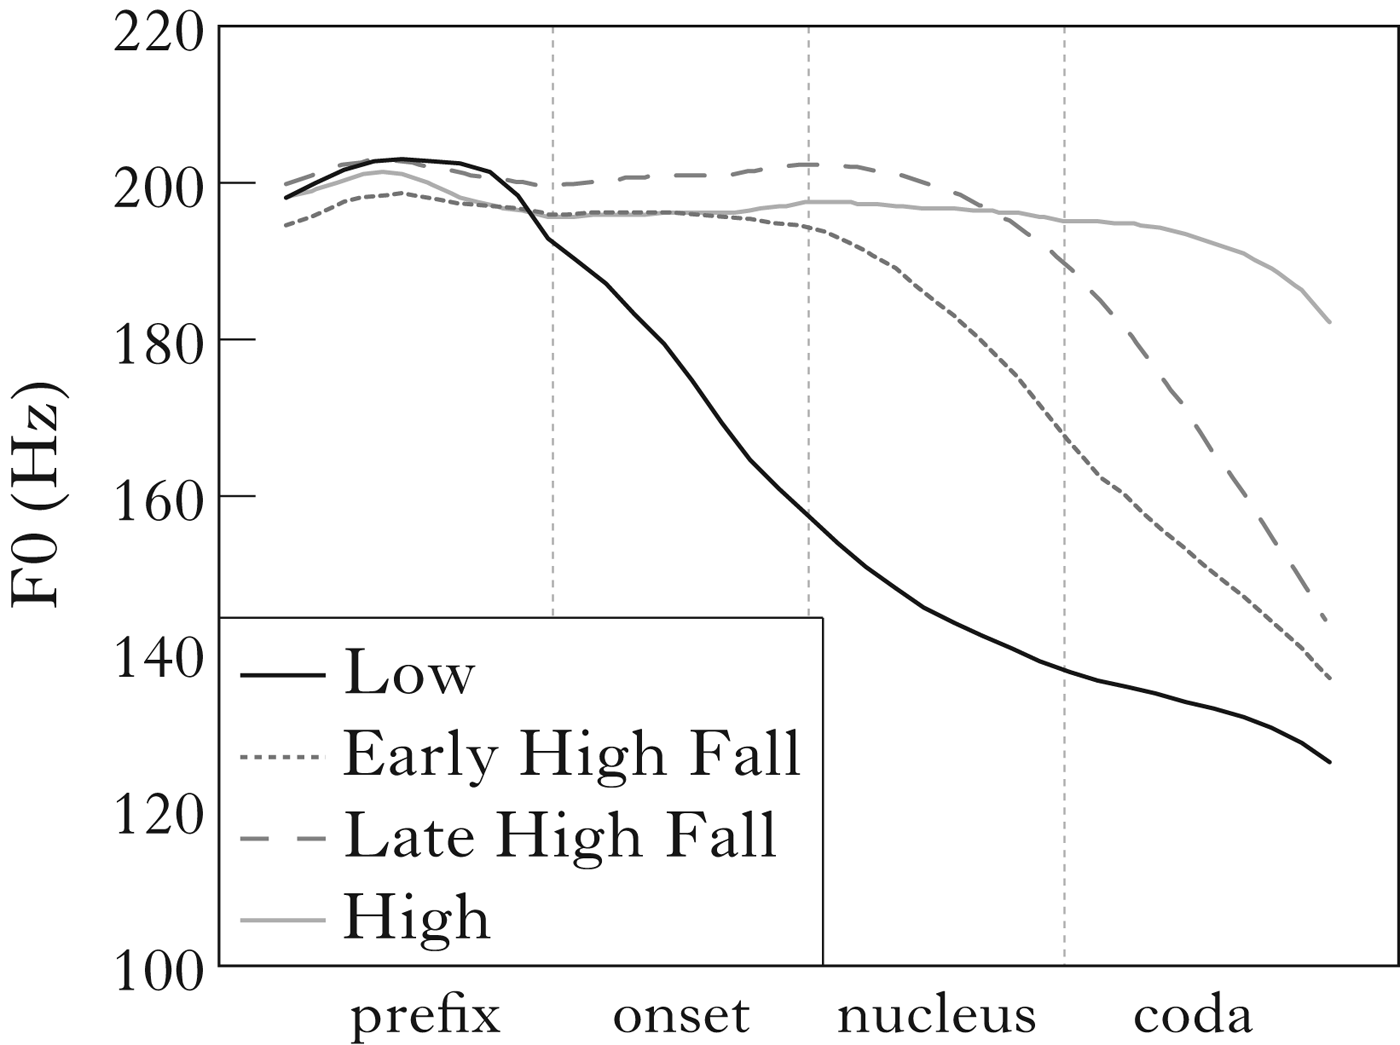
The averaged F0 traces for the four levels of Tone, across speakers and items, are summarised in Fig. 3. The trace for the Low tone shows a steep F0 drop during the onset consonant before levelling out during the rhyme. The trace for the High tone remains high throughout most of the target syllable, and only starts falling near the end of the coda consonant. In between these patterns, we find that F0 starts falling steeply near the beginning of the vowel in the case of the Early High Fall, and in the second half of the vowel in the case of the Late High Fall.
Averaged F0 traces on a normalised time axis for the data set as a whole, showing the realisations of the levels of Tone across items and speakers: Low, Early High Fall, Late High Fall, High. This graph is based on the traces after trimming but before stylisation.

In the following subsections, these F0 patterns will be explored in detail with respect to the alignment of the high turning point (§3.1), the F0 height of the high turning point (§3.2) and the size of the F0 fall (§3.3). We will also consider the durations within the rhyme (§3.4). Our alternative hypothesis in §1.3 is supported if the results yield evidence that tonal alignment plays a primary role in distinguishing the levels of Tone, and particularly the two contour tones. The null hypothesis in (1) is supported if the levels of Tone, and the two contour tones in particular, diverge primarily in terms of a different parameter.
3.1 Tonal alignment of the high turning point
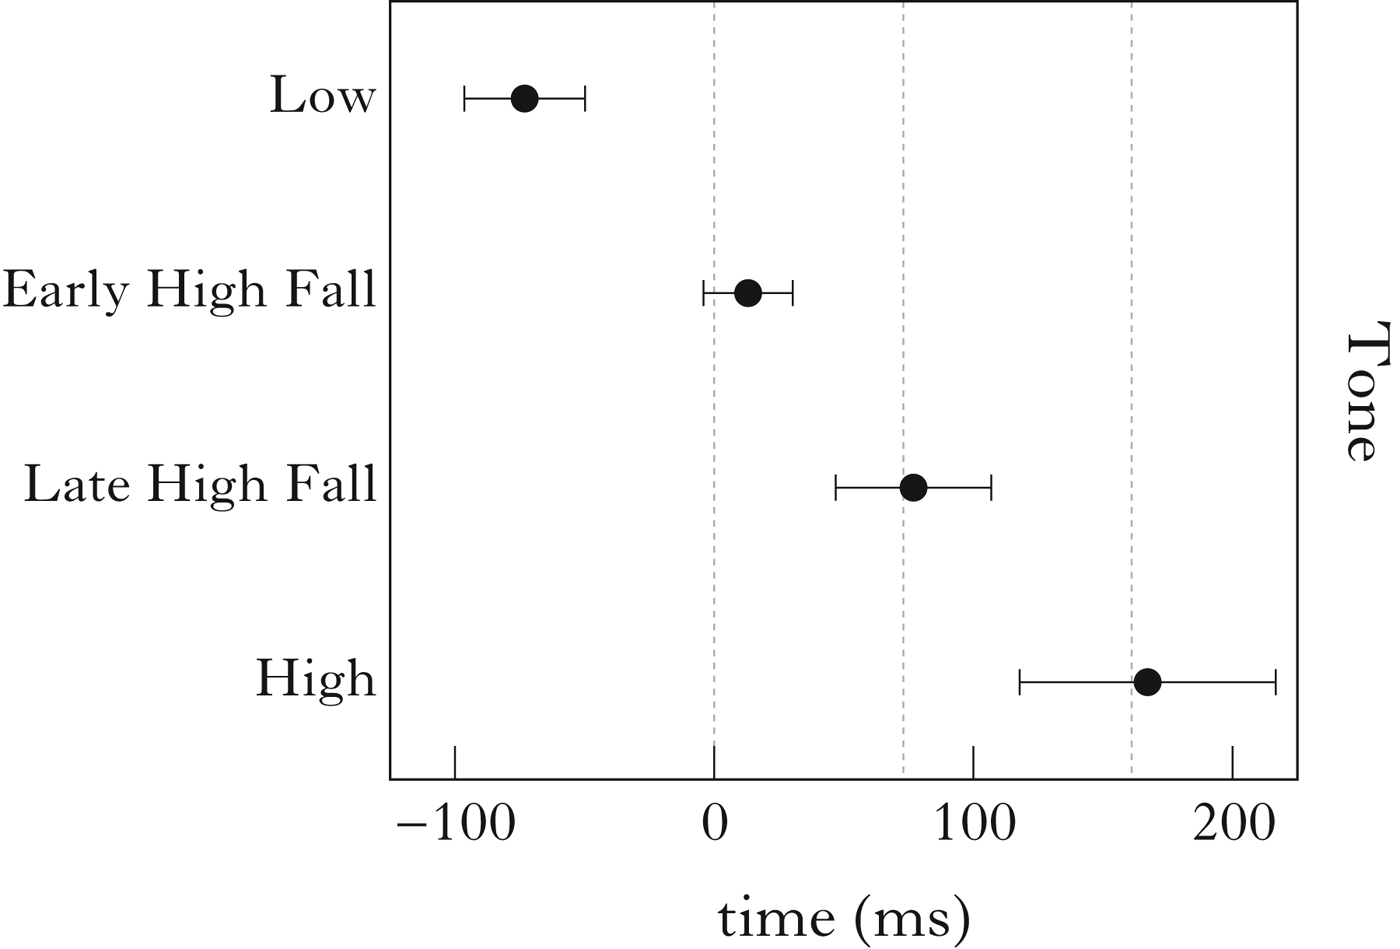
As explained in §2.4, the time value of the high turning point was extracted automatically. The tonal alignment of the high turning point was subsequently calculated by subtracting the time value of the beginning of the vowel of the target syllable from the time value of the high turning point. The descriptive statistics for this measure, in terms of both central tendency and variability, are presented in Fig. 4. The vertical lines reflect the average durations for nucleus and coda (73 and 88 ms respectively).
Means and standard deviations for tonal alignment, for each of the four levels of Tone. The first dashed line indicates the beginning of the vowel. The second and third lines indicate average values for the end of the vowel and for the end of the coda consonant respectively.

The mean values for tonal alignment of the high turning point are −73 ms (Low), 13 ms (Early High Fall), 77 ms (Late High Fall) and 167 ms (High). Considered in relation to the syllable domain, these points correspond roughly with the beginning of the onset consonant, the beginning of the vowel, the end of the vowel and the end of the coda consonant respectively. The whiskers in Fig. 4 encompass one standard deviation above and below the mean, i.e. 68·4% of the distribution of each tone category. Importantly, they do not overlap between levels of Tone. This state of affairs indicates that the four tone patterns are well separated in terms of tonal alignment, especially as the values are not corrected for between-speaker variation in rate of speech.
We examined the role of tonal alignment through a within-subjects ANOVA. This inferential test requires the design to be balanced in terms of factor levels. To this end, the number of items taken into account for Early High Fall and for Late High Fall was reduced from six to three, bringing these factor levels in line with Low and High, for which three items were available to begin with.Footnote 9 By doing this, the variance in the values for Early High Fall and Late High Fall is increased, and the assumption of homogeneity-of-variance is confirmed, as assessed through Levene's Test.
A one-way within-subjects ANOVA was run on this dataset, with fixed factor Tone (4 levels), random factor Speaker and dependent tonal alignment. The effect of tonal alignment is substantial in size and highly significant (F(3,8)=36·37, p<0·001). In the light of the hypothesis under investigation, we carried out planned pairwise comparisons between adjacent levels of Tone. These were carried out as t-tests with Bonferroni correction. All of the pairwise comparisons between levels of Tone are significant at p<0·001, including the comparisons between adjacent levels (Low vs. Early High Fall; Early High Fall vs. Late High Fall; Late High Fall vs. High).
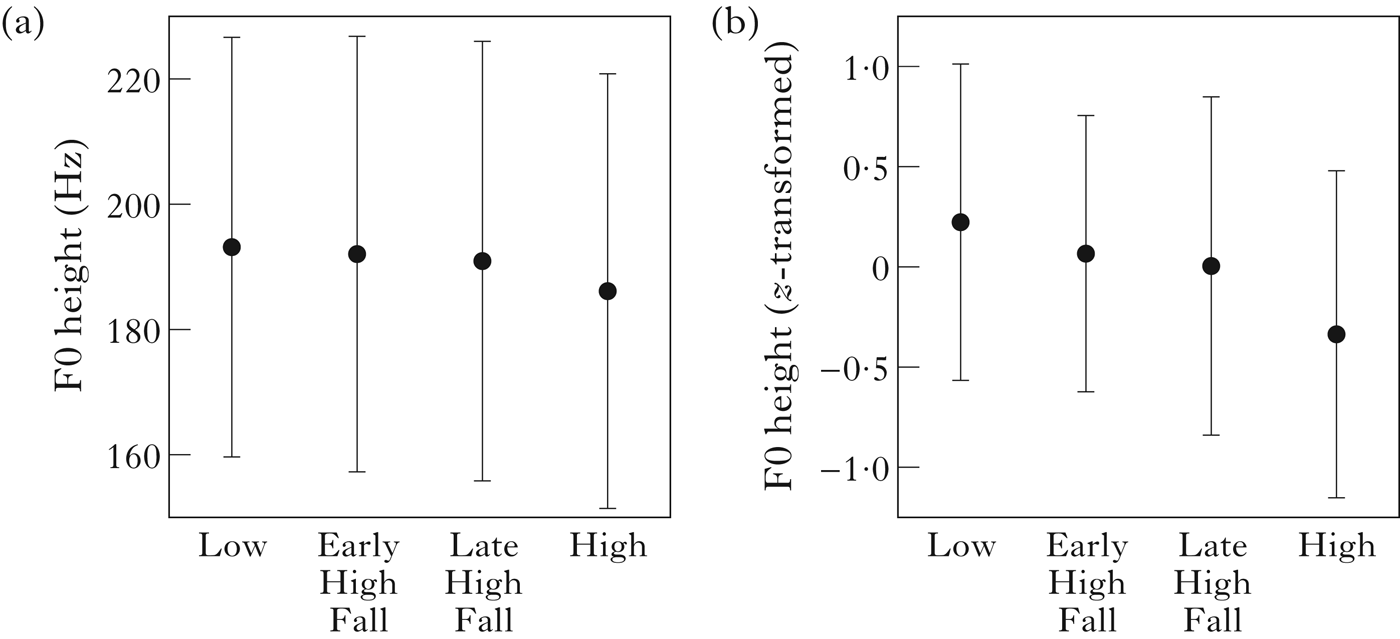
3.2 F0 height of the high turning point
This measurement sheds light as to whether the levels of Tone might differ in the phonological tone height of the initial target of the tone sequence that conditions the drop in F0. According to our hypothesis, this target is the same, i.e. High, through specification on the stem syllable or on the prefix. Figure 5 displays the descriptive statistics for F0 height graphically. Fig. 5a presents the raw values; in Fig. 5b, the raw Hertz measurements have been converted to the psychoacoustic ERB scale (Hermes & van Gestel Reference Hermes and van Gestel1991, Nolan Reference Nolan, Solé, Recasens and Romero2003), and then z-transformed per speaker, to normalise for between-speaker variation in the F0 register.
Means and standard deviations for F0 height of the high turning point, (a) as raw values (Hz) and (b) z-transformed per speaker, by level of Tone.

The means for the F0 height of the high turning point are close together. The mean values are 193 Hz (Low), 192 Hz (Early High Fall), 191 Hz (Late High Fall) and 186 Hz (High). Overall, the F0 of the high turning point is progressively lower as it is aligned further along the time axis. Some F0 lowering is to be expected even when the phonological specification of the initial target is the same. This is because, from Low through Early High Fall and Late High Fall to High, the high turning point is found progressively further along the declination slope. The key question, then, is whether any of the pairwise differences between adjacent levels of Tone are too great to be plausibly attributed to declination. The differences turn out to be small: the greatest difference between adjacent levels is the one between Late High Fall and High, which amounts to 0·5 semitones, and is therefore unlikely to be perceptible. Moreover, the distributions around the mean largely overlap, not only in the raw values, but also after correction for between-speaker variation. This is particularly relevant in relation to the comparison of Early High Fall and Late High Fall.
We examined this measurement further through a within-subjects ANOVA, with fixed factor Tone (4 levels), random factor Speaker and as dependent the value for F0 height of the high turning point (expressed as a z-transformed ERB value). This test was run on the balanced reduced dataset described in §3.1. Levene's Test does not yield a significant effect, indicating that the variances are homogeneous. The ANOVA shows that the influence of Tone on F0 height is not significant (F(3,8)=0·69, p=0·56). For the planned comparisons (pairwise t-tests with Bonferroni correction), there is a small significant effect for Low vs. High (p=0·045), the two levels furthest apart on the declination slope. None of the pairwise comparisons between adjacent levels are significant.
3.3 Size of the F0 drop
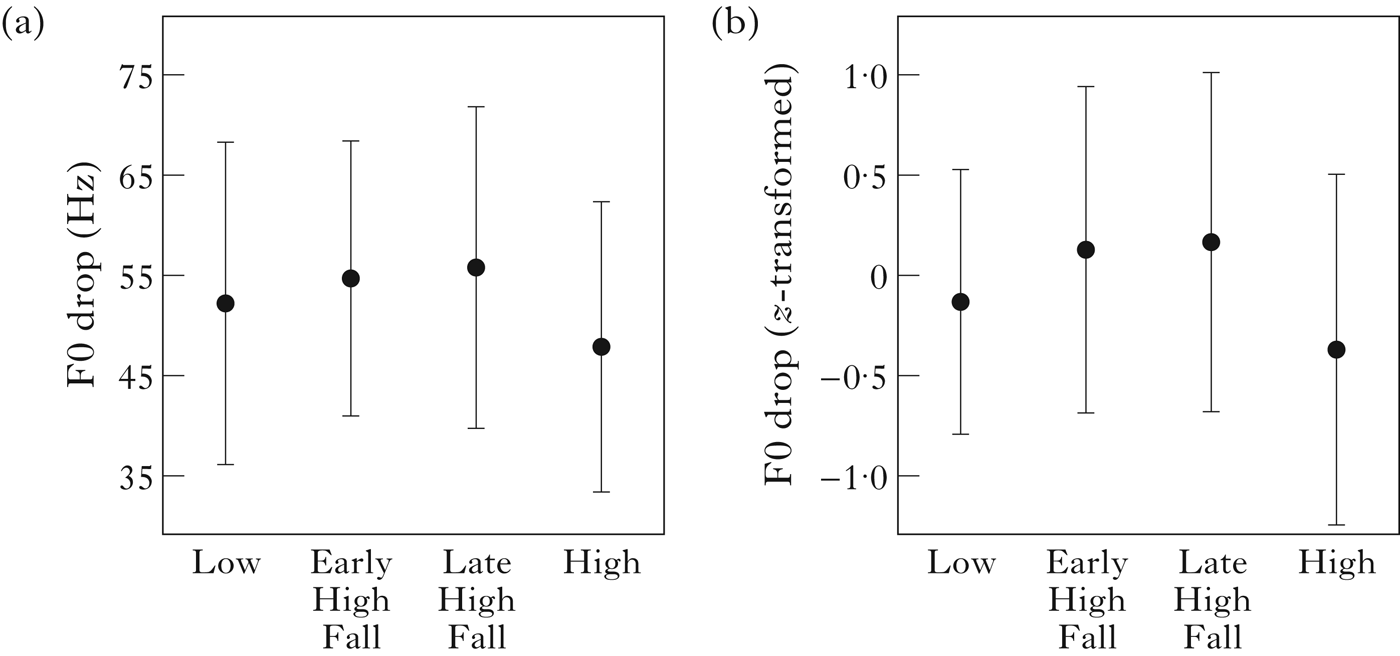
The size of the F0 drop that follows the high turning point can be taken to reflect the phonological distance between the two consecutive tone targets, in particular given the lack of divergence between factor levels of Tone in terms of the F0 height of the high turning point (cf. §3.2). Figure 6 shows the descriptive statistics, both as raw values (a) and after conversion to the ERB scale and z-transformation per speaker (b).
Means and standard deviations for the size of the F0 drop, (a) as raw values (Hz), and (b) z-transformed per speaker, by level of Tone.

All four of the levels of Tone involve substantial F0 changes. The mean value is highest for Late High Fall (56 Hz), and lowest for High (48 Hz). The means for Early High Fall and Late High Fall are only 1 Hz apart, at 55 Hz and 56 Hz respectively. The distributions around the mean for the four levels of Tone largely overlap, in particular for Early High Fall and Late High Fall.
We carried out a one-way within-subjects ANOVA, with fixed factor Tone and random factor Speaker, and as the dependent the size of the F0 drop following the high turning point, expressed in ERB and then z-transformed per speaker. As in §3.1 and §3.2, the ANOVA was carried out on the reduced dataset, because of the need for the design to be balanced. Levene's Test confirmed that the variances are homogeneous. The ANOVA revealed that Tone does not condition a significant main effect (F(3,8)=0·38, p=0·765). The planned comparisons, pairwise t-tests with Bonferroni correction, did not yield any significant effect.
3.4 Duration measurements
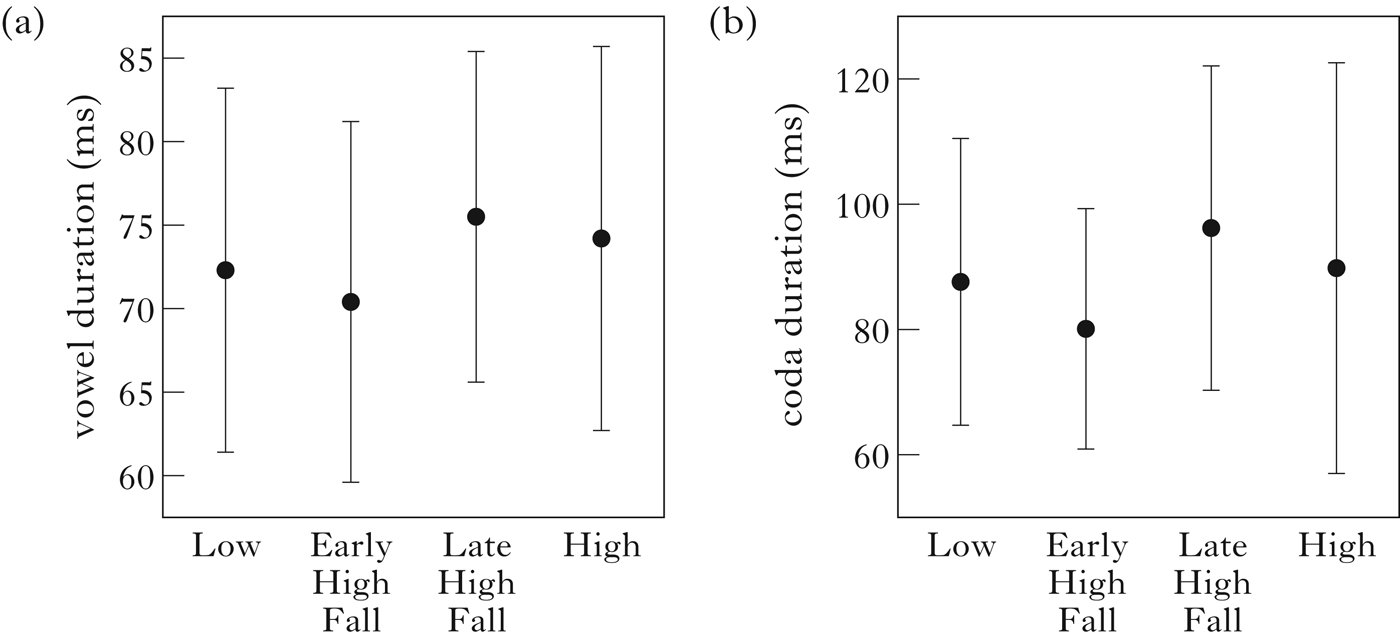
The descriptive statistics for the duration of the vowel and the coda are presented in Fig. 7.Footnote 10 While neither vowel duration nor coda duration conditions a salient separation between the distributions of levels of Tone, both graphs show greater duration for Late High Fall than for Early High Fall.
Means and standard deviations for (a) the duration of the vowel, and (b) the duration of the coda, by level of Tone.

This made us wonder whether these differences would add up to a substantial difference in the duration of the rhyme as a whole. It could be that the phonetic duration of vowel and coda is increased to make the Late High Fall more salient, in particular given that the F0 drop takes place primarily during the coda consonant. Using the same balanced dataset as in §3.1–§3.3, we calculated rhyme duration (the sum of vowel duration and coda duration). We then examined this measurement in a within-subjects ANOVA (fixed factor Tone, random factor Speaker). Levene's Test was used to ascertain that the variances were homogeneous. Tone did not condition a significant effect on rhyme duration (F(3,8)=0·52, p=0·666). None of the pairwise comparisons was significant, including the one between Early High Fall and Late High Fall (p=0·19). It can be concluded that the difference in segmental durations was not sufficiently great or consistent for this measurement to be considered as a correlate of the tonal contrast under investigation.
4 Conclusion
4.1 Summary of the findings
The hypothesis that was tested in this study is that tonal alignment distinguishes early vs. late-aligned falling contour tones in Shilluk, and that the same phonetic parameter also distinguishes these two contour tones from phonetically similar level tone patterns. We found that Early High Fall and Late High Fall diverge substantially and significantly in terms of tonal alignment, both relative to one another and in relation to phonetically similar level tone patterns, Low and High respectively. The mean values for tonal alignment of the high turning point were −73 ms (Low), 13 ms (Early High Fall), 77 ms (Late High Fall) and 167 ms (High). With respect to statistical dispersion, these four categories did not overlap in terms of the distributions of the raw values for tonal alignment, at one standard deviation around the mean (i.e. 68·4% of the distribution). Moreover, all of the pairwise comparisons were significant at p<0·001, including, crucially, those between adjacent levels of Tone. In contrast, neither F0 height nor the size of the F0 drop registered a significant effect overall, and the pairwise comparisons on these measures between Early High Fall and Late High Fall were not significant. The lack of difference is evident from the descriptive statistics for these two measures. In summary, tonal alignment was critical in distinguishing Low vs. Early High Fall vs. Late High Fall vs. High, as predicted by our alternative hypothesis, i.e. that tonal alignment can be contrastive in falling contour tones. The results offer no support for the interpretation that these falling contour tones are distinguished in terms of the F0 height of the beginning and end targets.
We also considered whether the duration of the syllable rhyme could be considered as a correlate, in particular in distinguishing Early High Fall vs. Late High Fall. This possibility is motivated by Zhang's (Reference Zhang2001) observation that, when a contour tone is realised on a syllable with limited ability to bear such pattern, one scenario is for the phonetic duration to be increased. The descriptive statistics show a difference in rhyme duration suggestive of such an effect, but it is not sufficiently consistent to reach significance in the inferential tests.
These conclusions are based on evidence from Shilluk closed monosyllables with a short vowel (CVC). Given the importance of sonorous space to the realisation of F0 changes, realising such a contrast represents a greater challenge in this environment than in syllables with a vowel that is long (CVVC) or overlong (CVVVC). Considering that the hypothesis is supported in the most challenging quantity context (i.e. with greatest time pressure), it is likely that it can also be supported for Shilluk when time pressure is smaller.
4.2 Discussion
4.2.1 Relevance to descriptive analysis and modelling of tone and intonation
In the absence of evidence to the contrary, the timing of tone targets within the syllable has long been interpreted as a phonetic matter rather than a phonological one (Hyman Reference Hyman1988, Odden Reference Odden and Goldsmith1995, Silverman Reference Silverman1997, Yip Reference Yip2002, Xu Reference Xu2005, Xu & Liu Reference Xu and Liu2006). By implication, if an inventory includes more than one falling contour tone, it is predicted that these will diverge in the height of the tone targets (Yip Reference Yip2002: 29). The results of the current study indicate that, on the contrary, tonal timing is potentially contrastive in contour tones. This conclusion is in line with the findings reported in Remijsen (Reference Remijsen2013) for Dinka and in DiCanio et al. (Reference DiCanio, Amith, García, Gussenhoven, Chen and Dediu2014) for Yoloxóchitl Mixtec. On this new understanding, the alignment of contour tones is a dimension of the speech system that can be exploited in the phonological systems of the world's languages, and should be considered as part of the range of possible analyses.
4.2.2 Contrastive alignment and sonorous duration
As noted in §1.1, Zhang (Reference Zhang2001, Reference Zhang, Hayes, Kirchner and Steriade2004) found that the distribution of contour tones in most languages is restricted to environments that offer greater sonorous space, as a result of vowel length, stress, syllable structure or position in the utterance. Vowel length does not play a role in this context in Shilluk, just as in the Bor North dialect of Dinka (Remijsen Reference Remijsen2013): in both cases, the phonology allows for both early- and late-aligned falling contours on syllables with short vowels. However, the composition of the syllable does offer substantial sonorous space to contour tones in these languages. Content-word roots in both Dinka and Shilluk are primarily closed monosyllables (Andersen Reference Andersen1987, Remijsen Reference Remijsen2013). The syllable rhyme is most often fully voiced in a phonetic sense. This is also the case when the coda is a plosive, because voicing in stops is not distinctive in coda position in Dinka and Shilluk, and coda plosives are often realised phonetically as voiced segments. As a result, the rhyme of content-word stems tends to have a sonorous duration of over 150 ms in non-final position.Footnote 11 Crucially, contour tones are only found on these stem syllables; on affixes, the inventory is limited to level-tone categories. In summary, the phonological distribution of tones in Shilluk and Dinka presents structural characteristics that help to understand why contrastive alignment is possible here. The same observation can be made regarding contrastive alignment for rising contours in Yoloxóchitl Mixtec (DiCanio et al. Reference DiCanio, Amith, García, Gussenhoven, Chen and Dediu2014). DiCanio et al. report that contrastive alignment within a syllable is found in content words that have a long (i.e. bimoraic) vowel. In Dinka, Shilluk and Yoloxóchitl Mixtec alike, then, the common characteristic of the environments in which alignment is contrastive in contour tones is greater sonorous space, in line with Zhang (Reference Zhang2001, Reference Zhang, Hayes, Kirchner and Steriade2004).
4.2.3 Consistency in tonal alignment
It is worthwhile to compare the results of this study with earlier findings on contrastive alignment in falling contours in Dinka (Remijsen Reference Remijsen2013). In the word form that was investigated in both studies (a closed monosyllabic stem with a short vowel and a short-vowel prefix), the mean values for tonal alignment in Shilluk are 13 ms for the early-aligned fall and 77 ms for the late-aligned fall, both relative to the beginning of the vowel. The corresponding values for the Bor North dialect of Dinka are −7 ms and 33 ms. One might interpret this as an indication that the variability in tonal alignment between the two languages is substantial, in particular in relation to the late-aligned fall, but there are two considerations suggesting that caution is warranted on this issue. First, there is the way the high turning point is determined. In the study on Dinka, the preceding syllable was not specified for High tone, so that the start of the F0 fall was detected on the basis of the F0 maximum within the word domain. In the current study, we examined falling contours in the context of a preceding high plateau. With this preceding context, it is not possible to determine the start of the F0 fall in the same way, i.e. on the basis of a local maximum. Instead, we used a stylisation procedure that ignores discrepancies below a threshold value (1 semitone). In this approach, the very beginning of the F0 drop, where the F0 change is slowest (Xu & Sun Reference Xu and Sun2002), may not impact on the determination of the turning point. In summary, it may be that the high turning points of the two falling contours are aligned later in the syllable in this study on Shilluk than in the earlier study on Dinka because of the difference between the way in which the high turning point is calculated in the two studies.
A second fact that helps to explain the difference between the timing patterns in Dinka and Shilluk has to do with the utterance context. The Dinka words were embedded in utterance-final position, whereas the Shilluk words are embedded utterance-medially. This matters, because position-in-utterance may exert considerable influence on the alignment of tone targets. For example, Myers (Reference Myers2003) reports that F0 peaks in Kinyarwanda are aligned earlier in utterance-final position than in utterance-medial position. For the LH-tone category, the difference amounts to a quarter of the syllable duration (Myers Reference Myers2003: 79). If position-in-utterance conditions a similar effect in Dinka and Shilluk, this would explain the divergence between the values for tonal alignment, particularly with respect to the late-aligned falls.
4.2.4 A quantal threshold for tonal alignment
Based on evidence from perception experiments, House (Reference House1990, Reference House1996) postulates that F0 changes are perceived differently at the very beginning of the vowel, where the F0 change coincides with spectral changes due to consonant-induced transitions, than they are well into the vowel. According to this hypothesis, there is a threshold that plays an important role in the perception of F0 changes, located not at the very beginning of the vowel, but instead in the initial section of it. An F0 change that sets in at least 30 ms into the vowel would be perceived in a different manner from the same F0 change aligned at the beginning of the vowel (House Reference House1990: 133–134). This suggests that the threshold lies at about 20 to 25 ms into the vowel. This notion of a point where perception shifts in a non-linear manner can be interpreted as a quantal threshold in the sense of Stevens (Reference Stevens1989). In this context, it is noteworthy that, while the alignment of early- and late-aligned contours differs between Shilluk and Dinka, the means are on either side of this hypothesised threshold in both languages. It will be worthwhile to find out whether further evidence of contrastive alignment corroborates this hypothesis, particularly given the general lack of a quantal threshold in relation to tone (Stevens Reference Stevens1989: 41, Stevens & Keyser Reference Stevens and Keyser2010: 13).
4.2.5 Phonological representation
We have concluded that tonal alignment is contrastive in contour tones in Shilluk. A key consideration here is that both early- and late-aligned falling contours are part of the underlying specification of morphemes. There is an important difference here, in comparison with Dinka: in Shilluk the early-aligned high fall is a phonological category which is in contrast with a Low-tone category.
We now address the question as to how such a contrast can be represented. Pierrehumbert & Beckman (Reference Pierrehumbert and Beckman1988: 159), who also assume that such a contrast is unattested, lay out the options available in autosegmental theory: ‘if further research uncovers cases where the alignment is contrastive within a language, these might be handled by the use of an alignment feature on the prosodic nodes or on the substantive elements’. In other words, the phonological representation of tone can be enriched through specification of the prosodic units with which the substantive elements (tones) are associated or through specification on tonal tier, where these substantive elements are themselves represented. In this section, we will outline several proposals, and consider their strengths and weaknesses, without committing ourselves to a particular one.
The latter option, the enriched specification of the tonal elements, is adopted for Dinka in Remijsen (Reference Remijsen2013). The same feature, i.e. [±late-aligned], is equally conceivable for Shilluk, as shown in (11). Because alignment cannot be contrastive in level tones, [±late-aligned] is not underlyingly specified in the phonological representation of level tones. If we conceive of this feature as limited in scope to the association of contour tones at the syllable level, then the contrastive alignment of contour tones is predicted to be maximally binary. In terms of phonetic content, [±late-aligned] refers to the timing of the first target within a bitonal configuration associated with a single syllable. As noted in §4.2.4, the hypothesis of a threshold between early and late-aligned F0 changes is independently motivated (House Reference House1990).
-
(11)

An alternative is to represent contrastive alignment in contour tones through the specification of the prosodic nodes. Hyman (Reference Hyman1988) presents a representation that achieves this, and argues that this should be ruled out (cf. §1.1). In (12), Hyman's representation is adapted to Shilluk.Footnote 12 This representation is applicable to Shilluk, because the content-word syllables on which the alignment contrast is found are closed. If we postulate weight by position (Hayes Reference Hayes1989), the two prosodic nodes (i.e. moras) are indeed available.
-
(12)

A relevant consideration in this context is that Shilluk has three-level vowel length – cf. (5) and Table I. If three-level vowel length is represented by the use of moras (cf. Flack Reference Flack2007 and Remijsen & Gilley Reference Remijsen and Gilley2008 on Dinka), and the coda is hypothesised to project a mora, then closed syllables with an overlong stem vowel involve four moras.
A third option is to exploit the notion of association with mora edges, as put forward independently by Prieto et al. (Reference Prieto, D'Imperio and Fivela2005) and Morén & Zsiga (Reference Morén and Zsiga2006), and illustrated for Shilluk in (13). This approach hinges on an interpretation of the mora as a concrete timing unit (Morén & Zsiga Reference Morén and Zsiga2006: 126). Morén & Zsiga present acoustic evidence from Thai which corroborates such an interpretation.
-
(13)

These proposals for the phonological representation of contrastive alignment can be evaluated on the basis of the predictions they make. A first consideration is generative power. At present, there is no evidence that tonal alignment can mark a three-level contrast in the alignment of contour tones. Such a configuration seems unlikely, given what is known about the typology of contour tones and the production and perception of F0 changes. This is problematic for the association-with-mora-edges approach, as it allows for a three-way contrast to be represented in a language that has a contrast between short and long vowels. For example, if the Low final target of the HL contour is hypothesised to be associated with the right edge of the syllable, the High initial target can be hypothesised to be associated with the left edge of the first mora, the left edge of the second mora or the right edge of the second mora.
A second consideration is explanatory adequacy. In the languages for which it has been reported so far, contrastive alignment is found in heavy syllables: closed syllables in Dinka and Shilluk, and syllables with a long vowel in Yoloxóchitl Mixtec (DiCanio et al. Reference DiCanio, Amith, García, Gussenhoven, Chen and Dediu2014). This is in line with the representation proposed in Hyman (Reference Hyman1988), which requires a bimoraic syllable for contrastive alignment to be represented. The other two representations are less attractive, in the sense that they can represent contrastive alignment even on a monomoraic syllable.
A third criterion relates to the phonetic realisation of alignment contrasts. The proposal based on the feature [±late-aligned] predicts that contour-tone categories involved in alignment contrasts will invariably be found at opposite sides of the perceptual threshold postulated in House (Reference House1990). So far, this prediction is borne out in the phonetic evidence, limited though it is. The association-with-mora-edges proposal hinges on the hypothesis that the edge of a mora can be identified in speech, i.e. that the mora is a phonetic timing unit. The difficulty here is that the alignment of tone targets often varies greatly across contexts (e.g. Myers Reference Myers2003 on Kinyarwanda; Schepman et al. Reference Schepman, Lickley and Ladd2006 on Dutch).
The question concerning phonological representation invites further investigation, and the goal of our coverage of the topic here has been to spell out some issues and considerations, rather than to offer an exhaustive treatment. However the question of phonological representation is answered, our findings on Shilluk add support to the hypothesis that tonal alignment is phonologically distinctive in syllable-level contour tones. Topics for further investigation in relation to the Shilluk phenomena include the perception of this tonal contrast, and its acoustic realisation under manipulation of syllable structure (CVC vs. CVVVC) and utterance context (utterance-final vs. utterance-medial).
 ʌʌ
 ʌ