INTRODUCTION
Edible rock oyster, Saccostrea cucullata (Born, 1778) is a primary consumer that provides significant biomass and abundance to the marine ecosystem. This oyster is widely distributed in the Indo-Pacific and subtropics. Studies on a variety of Saccostrea species have illustrated that many aspects of shell morphology, most notably external shell sculpture and shell dimension, vary with environment (Thomson, Reference Thomson1954; Stenzel, Reference Stenzel and Moore1971; Tack et al., Reference Tack, Berghe and Polk1992). Saccostrea cucullata is an edible rock oyster that inhabits brackish and marine environments where it cements onto rocks, other hard substrates (beacons, jetties, ship hulls etc.) and mangroves. Lewis (Reference Lewis1964) and Hartnoll (Reference Hartnoll1976) stated that this species is abundant in the upper eulittoral zone where they grow to a maximum size up to 65 mm in shell length (van Someren & Whitehead, Reference Van Someren and Whitehead1961), but experience stunting in crowded conditions.
This oyster is widely distributed around the coast of India, occurring in both near-shore brackish and offshore environments on substrates that vary from rocks to mangroves (Maran & Ayyakkannu, Reference Maran, Ayyakkannu and Quadros2002; Stanley, Reference Stanley and Quadros2002). Morris (Reference Morris1985) stated that in the mangrove area of Hong Kong this species is thin shelled and stunted, but develops other morphological features when placed in an exposed area. In spite of the diverse habitats, the genus Saccostrea shows highly variable shell morphology. Most species have been focused to be a single species. However, some researchers have disagreed on whether to call this species S. cucullata (Amornjaruchit, Reference Amornjaruchit1988; Nateewathana, Reference Nateewathana1995; Sanpanich, Reference Sanpanich1998) or S. commercialis (Brohmanonda et al., Reference Brohmanonda, Mutarasint, Chongpeepien, Amornjaruchit, McCoy and Chongpeepien1988; Tookwina, Reference Tookwina1991). Two other species, S. mordax (Gould, 1850) and S. echinata (Quoy & Gaimard, 1835) have also been included in species lists for the Gulf of Thailand (Nielsen, Reference Nielsen1976) and offshore islands in the Andaman Sea (Bussarawit, Reference Bussarawit1995), respectively. The identification of S. cucullata is problematic as a number of authors considered S. mordax and S. echinata to be synonyms (Thomson, Reference Thomson1954; Morton & Morton, Reference Morton and Morton1983).
Amin et al. (Reference Amin, Zafar and Halim2008) studied the allometry and growth rate of the oyster, Crassostrea madrasensis, in the Moheskhali Channel (south-eastern coast of Bangladesh). The allometric relationships for the combination of shell weight, total weight, dry meat weight, wet meat weight, height and length were computed in the oyster, Crassostrea virginica, from subtidal and intertidal waters of South Carolina (Dame, Reference Dame1972). Joseph (Reference Joseph1979) carried out biometric studies of C. madrasensis inhabiting Mulki estuary (Karnataka). Nagi et al. (Reference Nagi, Shenai-Tirodkar and Jagtap2011) analysed the multi-dimensional relationship in Crassostrea madrasensis and C. gryphoides in the mangrove ecosystem of the Mandovi estuary. Kripa & Salih (Reference Kripa, Salih, Joseph, Menon and Nair1999) studied the shell dimension and length-weight relationships of Saccostrea cucullata from Ashtamudi lake along the south-west coast of India. Biometric relationships of the black winged pearl oyster, Pteria penguin, were reported by Libini et al. (Reference Libini, Abraham, Shanmugam, Rao, Kripa, Velayudhan and Mohamed2011) from the Andaman and Nicobar Islands. Seasonal variation in biochemical composition of S. cucullata from the Indian Sundarbans was studied by Mitra et al. (Reference Mitra, Basu and Banerjee2008). Evaluation of the biometric characteristics and relationships in oyster provides better understanding of the relative growth of their various body parts (Chatterji et al., Reference Chatterji, Ansari, Ingole and Parulekar1985). Studies on morphometrics, condition index and meat yield of rock oyster are scarce in India. Therefore, the present study aimed to study the biometric relationships, relative growth, condition index and meat yield of S. cucullata from Karnataka coast, south-west coast of India.
MATERIALS AND METHODS
Characteristics of study area
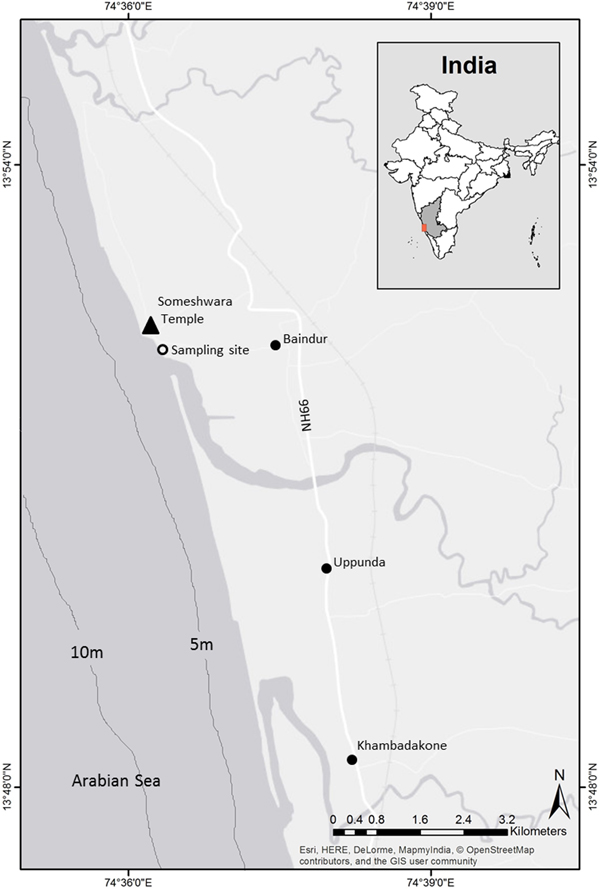
Karnataka is a state located in the southern part of India. It consists of three coastal districts, namely Dakshina Kannada, Udupi and Uttara Kannada. It is increasingly subjected to urban development (Tenjing, Reference Tenjing2013). The south-west coast of India is characterized by three seasons, pre-monsoon (February–May), south-west monsoon (June–September) and post-monsoon (October–January). The present sampling site is located in an unpolluted area in the rocky beach of Baindur, near to the Someshwara Temple (Figure 1).
Location of sampling site in the coastal area of Karnataka.

Sample collection and analysis
Saccostrea cucullata oysters were collected from rocky intertidal zones of Baindur (13°52′N 74°36′E) from June 2010 to May 2011. The colonies of this oyster grow on hard rock and are very difficult to remove. Therefore, oysters were collected with the help of a chisel and hammer, then cleaned with tap water and blotted. A total of 2328 oysters ranging in size from 4.7 to 55.2 mm were analysed for shell morphometrics, weight-length relationships, condition index and percentage of edibility. Total weight of the oyster was determined to the nearest 0.001 g using electronic scales. Shell dimensions were measured using a Vernier calliper. The meat was removed from the shells with the help of a scalpel, blotted to remove excess moisture, weighed and subsequently dried to a constant temperature in an oven at 60 °C for 48 h. The weight (total weight, shell weight, wet meat weight and dry meat weight) was examined to establish relationship with length.
Condition index (CI)
After the dry weights were measured to the nearest 0.001 g, the CI was calculated following Helen (Reference Helen1997):
 $${\rm CI} = \displaystyle{{{\rm Meat}\,{\rm dry}\,{\rm weight\;} ({\rm g})} \over {{\rm Shell}\,{\rm dry}\,{\rm weight\;} ({\rm g}){\rm \;}}} \times 100$$
Edible portion or meat yield
The edible portion or percentage of edible biomass or meat yield in S. cucullata was determined by calculating the percentage ratio of the wet meat weight to the individual whole weight (Hickman & Illingworth, Reference Hickman and Illingworth1980):
 $${\rm PE} = \displaystyle{{{\rm Meat}\,{\rm wet}\,{\rm weight}} \over {{\rm Oyster}\,{\rm total}\,{\rm weight}}} \times 100$$
Statistical analysis
Estimation of the morphometric relationships between the shell dimensions (length, breadth and width) was performed using the linear equation Y = a + bX, where a, intercept and b, slope are constants (Pauly, Reference Pauly1983). The relationships between length and weight were established by the equation: W = aLb. This equation can be expressed in its linearized form: Log W = Log a + b Log L, where W is the weight (g), L is the length (mm), a the intercept (initial growth coefficient) and b the slope (relative growth rates of the variables). The degree of association between variables was calculated by the correlation coefficient (r).
When the slope b is equal to 1, relationships between linear variables (measurements) are isometric. In case of relationships between linear (measurements) and ponderal (weightings) variables, the slope (b) being equal to 3 indicates isometry. For weight-length relationships, a t-test (H o, b = 3) was performed with a confidence level of 95% to confirm if the values of b obtained in the linear regressions were significantly different from the isometric value (b = 3), expressed by the equation (Sokal & Rohlf, Reference Sokal and Rohlf1987): t s = (b–3)/S b, where t s is t-test value, b is slope and Sb is the standard error of the slope (b). Similarly, for length-breadth/width relationship, a t-test (H o, b = 1) was performed with a confidence level of 95%. Statistical significance of b values and their inclusion in the isometric range indicates when b is equal to 3 ( = 1 for length-breadth/width), negative allometric when the b is lower than 3 and positive allometric when the b is greater than 3. The condition indices recorded from three seasons (pre-monsoon, monsoon and post-monsoon) were compared using ANOVA, and a pairwise multiple comparison test, i.e. Student-Newman-Keuls (S-N-K), was conducted after a significant (P < 0.05) ANOVA result was obtained. Spearman's rank correlation coefficients were calculated to examine relationships between the measured parameters using a significance level of P < 0.05.
RESULTS
Specimen size and weight
Data specimen size and weight were pooled and expressed on an average basis (Table 1). The length of specimens ranged between 4.7–55.2 (28.1 ± 8.6) mm, while breadth and width were in the ranges of 3.6–48.8 (19.5 ± 6.5) mm and 2.2–34.2 (12.4 ± 5.1) mm, respectively. The total weight of the individuals ranged between 0.075–25.350 (4.4 ± 3.5) g, and the wet meat weight ranged between 0.003–2.237 (0.4 ± 0.7) g. The shell weight and dry meat weight varied from 0.045–17.361 (3.3 ± 2.5) mm and 0.001–0.487 (0.1 ± 0.1) mm respectively.
Size and weight ranges of Saccostrea cucullata analysed during the study period.

Shell morphometric relationships
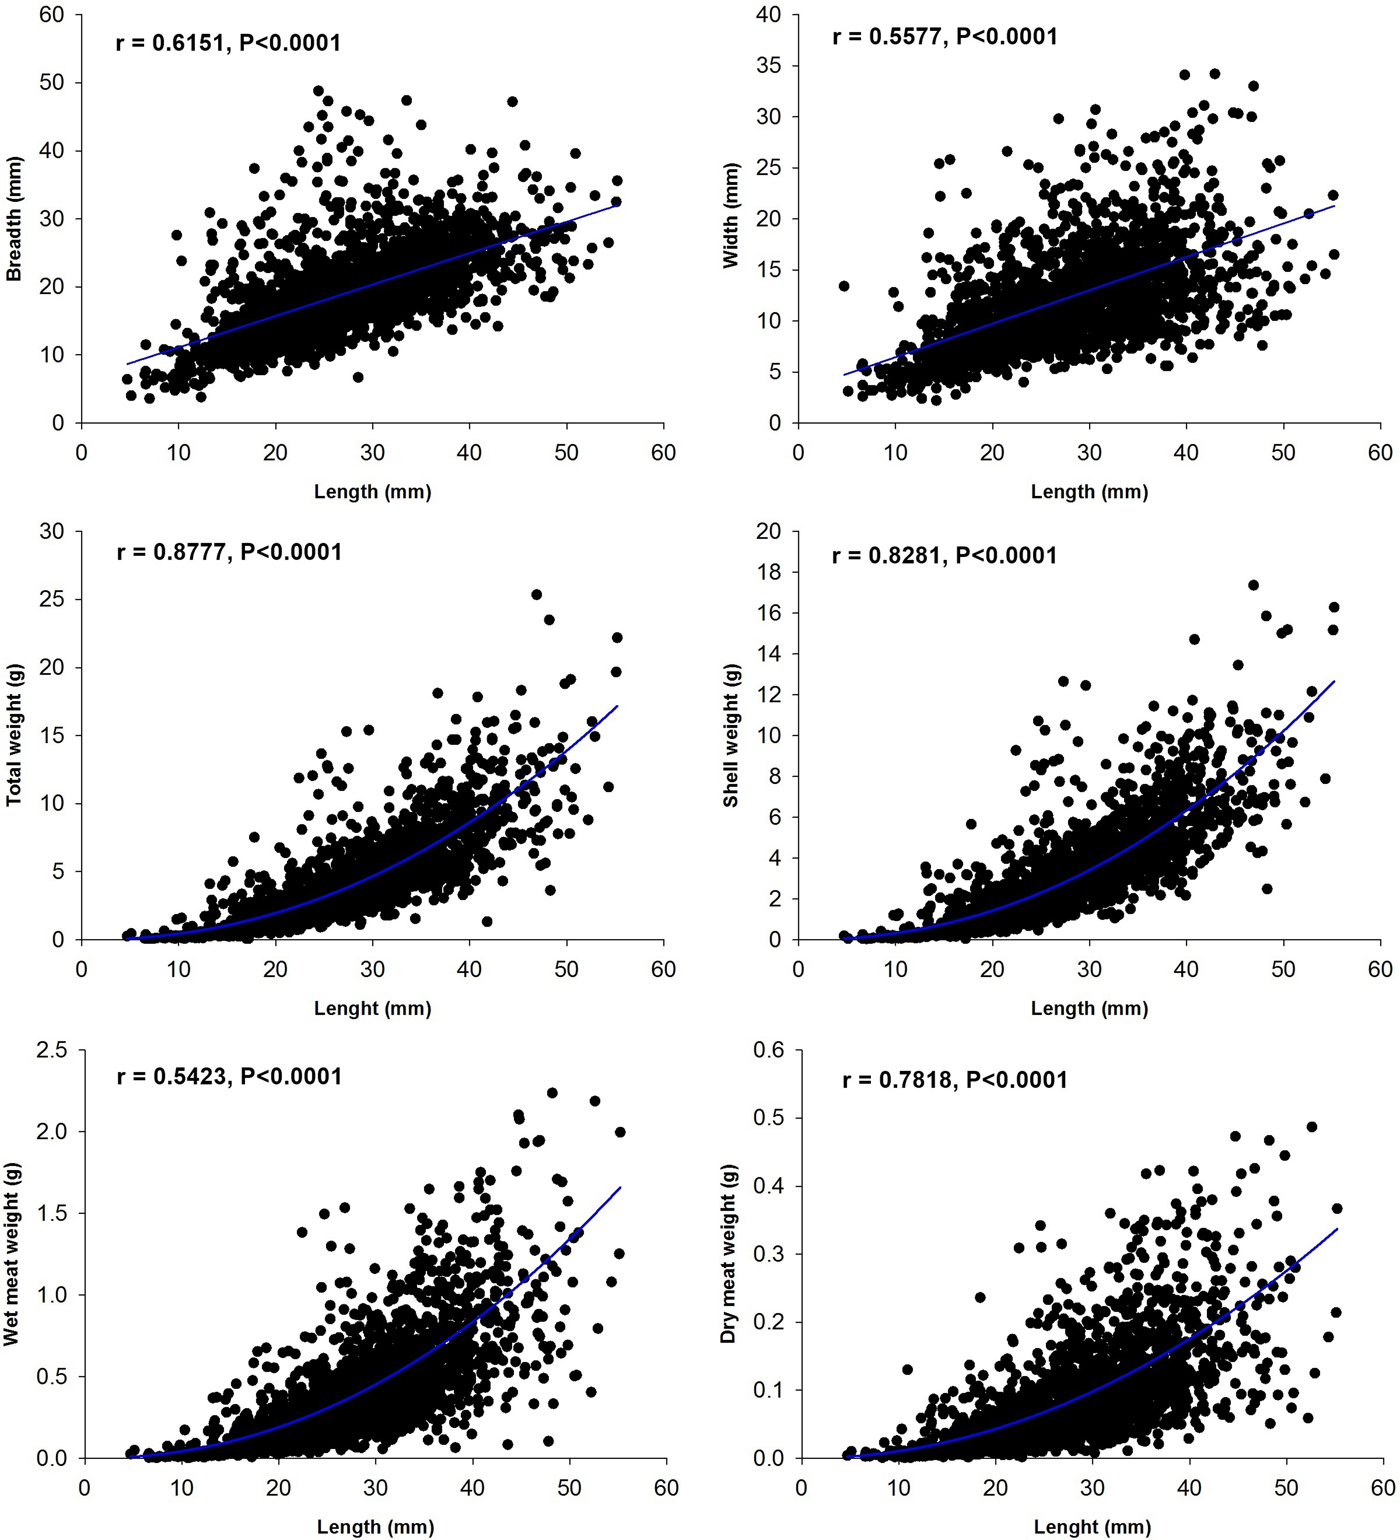
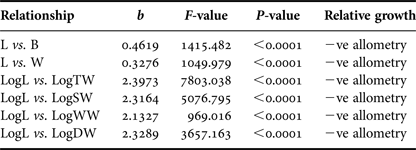
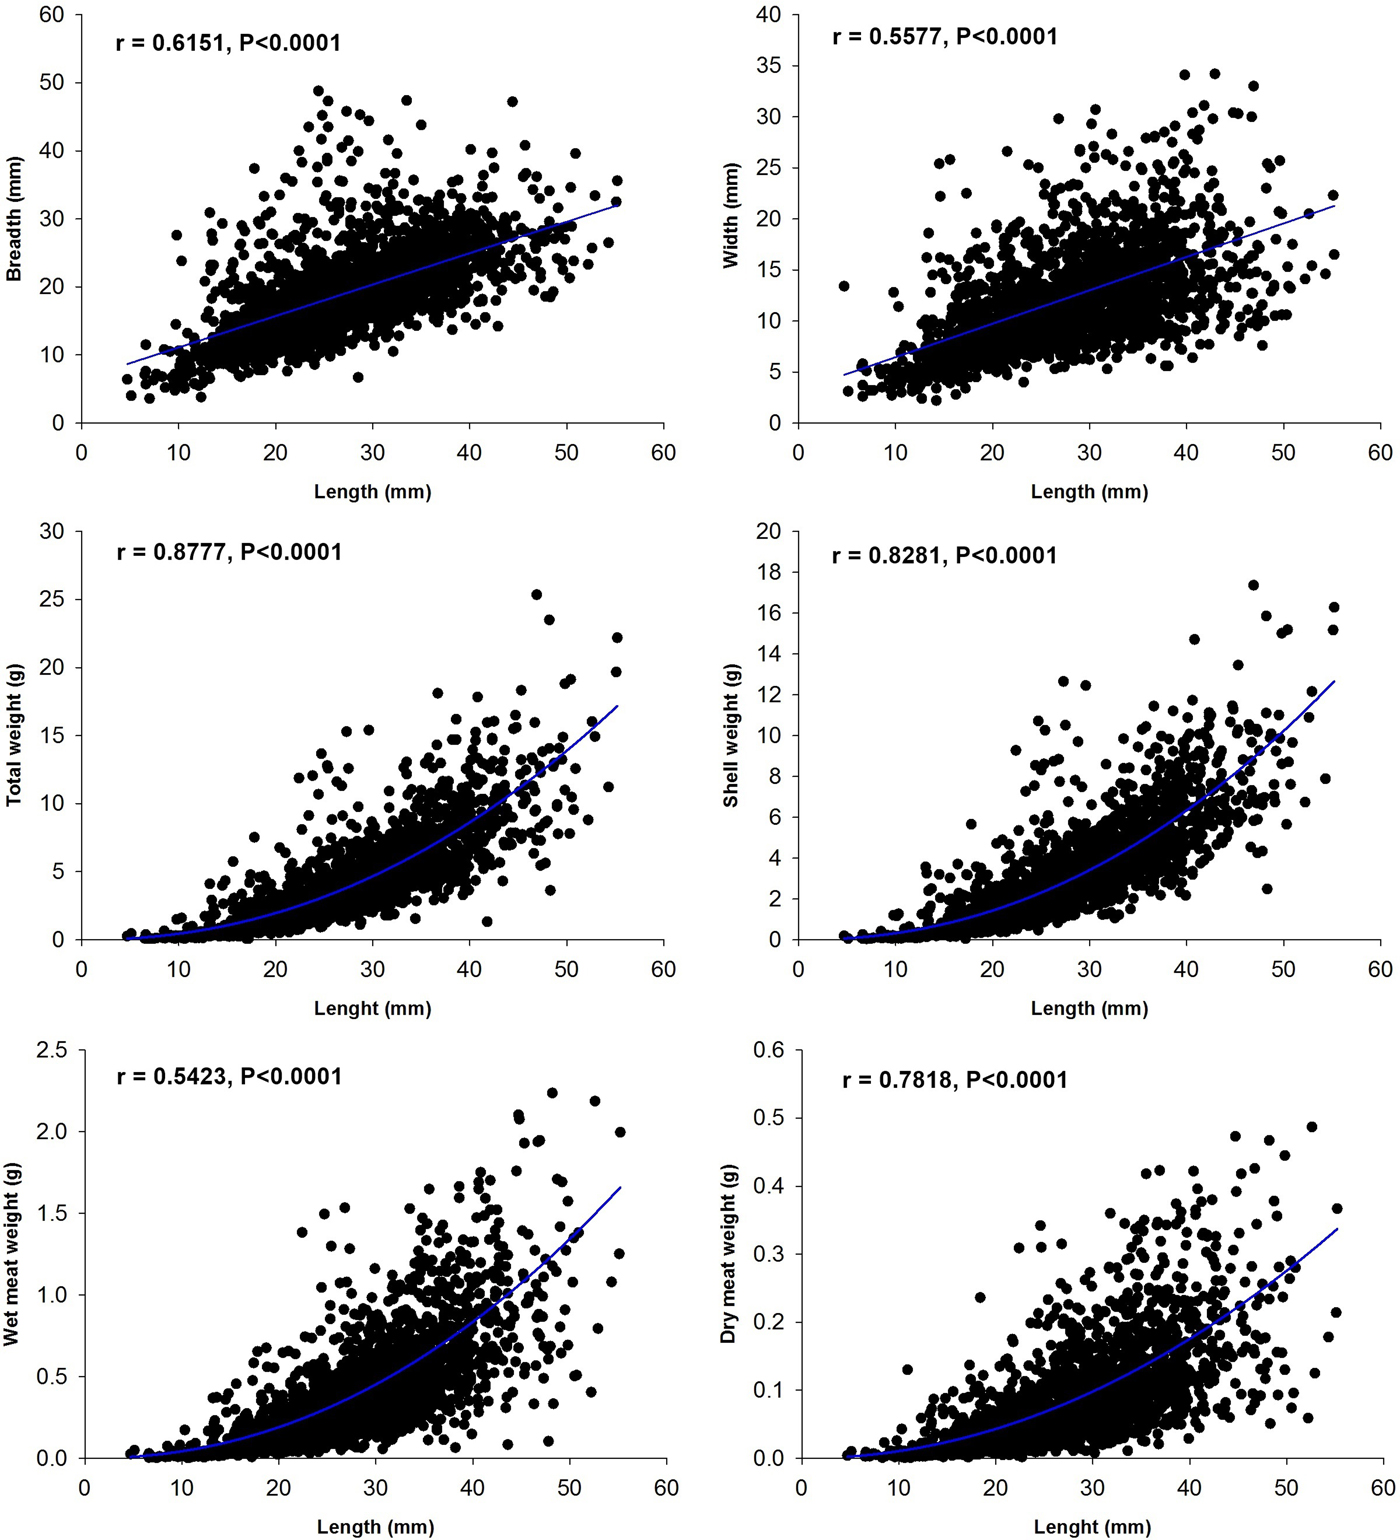
The relationships between length (L)-breadth (B) and length (L)-width (W) were B = 6.4952 + 0.4619 L and W = 3.1806 + 0.3276 L respectively (Figure 2). The correlation coefficients (r) of L–B and L–W were 0.6151 and 0.5577, respectively. Length-breadth and length-width displayed negative allometries as shown by the b values which were significantly less than unity (P < 0.001; Student's t-test) (Table 2), i.e. shell length increased relatively faster than both breadth and width as reflected by the significant b < 1 values.
Bivariate scatter diagram of length-breadth, length-width, length-total weight, length-shell weight, length-meat wet weight and length-meat dry weight relationships.
Morphometric relationships and relative growth in Saccostrea cucullata from Baindur (India).

Weight-length relationships
The relationships between the length (L)-total weight (TW), length (L)-shell weight (SW), length (L)-meat wet weight (WW) and length (L)-meat dry weight (DW) were TW = 0.001227L 2.3973, SW = 0.001165L 2.3164, WW = 0.000037L 2.1327 and DW = 0.000030L 2.3289, respectively (Figure 2).
Condition index (CI)
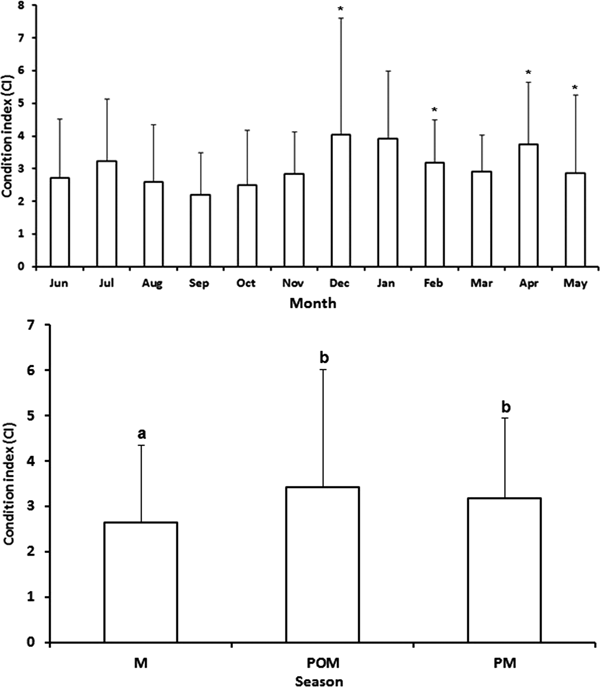
Variations in the CI of S. cucullata during the study period are shown in Figure 3. In general, the CI showed evidence of seasonality with relatively higher values in December (post monsoon) and April (pre-monsoon). The lowest mean CI (2.2) occurred in September and the highest mean CI (4.1) in December followed by January (3.9). The ranges of mean CI values were 2.9 (September)–3.2 (July) in monsoon, 2.5 (October)–4.1 (December) in post-monsoon and 2.9 (March)–3.8 (April) in pre-monsoon. The mean CI values of rock oyster were 2.5 in monsoon, 3.4 in post-monsoon and 3.2 in pre-monsoon (Figure 3).
Monthly variation (upper figure) and seasonal variation (lower figure) in mean condition index of Saccostrea cucullata (M = monsoon, POM = post-monsoon, PM = pre-monsoon). Vertical bars represent the standard deviation. Means with different superscript letters are significantly different (P < 0.05).

Edible proportion or meat yield
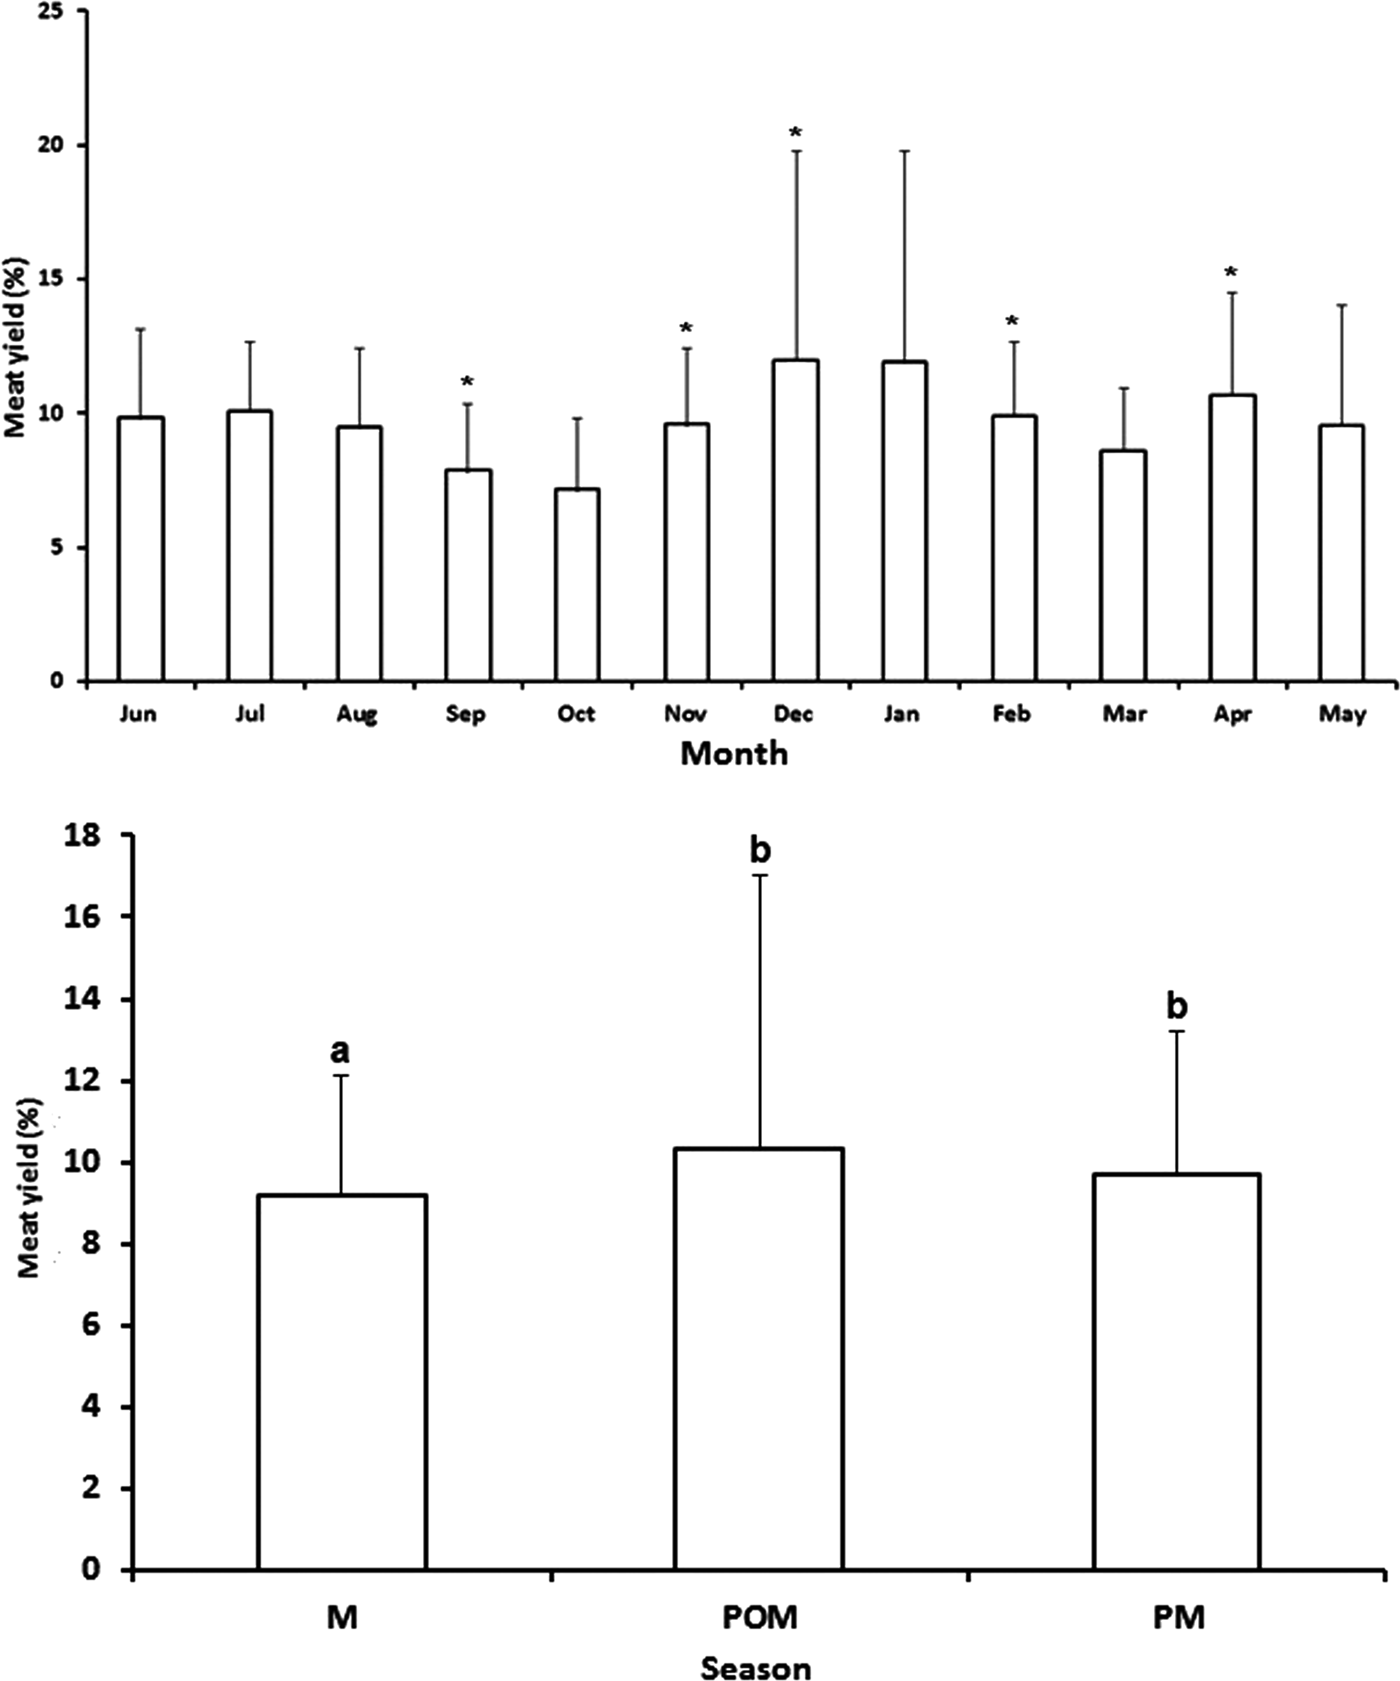
Variation in the meat yield of oysters is shown in Figure 4. Meat yield displayed similar patterns as CI (Figure 3), with distinct peaks in December and April. Generally, meat yield of rock oysters was low in September (7.9%: monsoon) and October (7.2%: post-monsoon) and March (8.6%: monsoon). Highest values were recorded in July (10.1%: monsoon), December (12.0%: post-monsoon) and January (10.7%: pre-monsoon).
Monthly variation (upper figure) and seasonal variation (lower figure) in mean meat yield (edible proportion) of Saccostrea cucullata (M = monsoon, POM = post-monsoon, PM = pre-monsoon). Vertical bars represent the standard deviation. Means with different superscript letters are significantly different (P < 0.05).

DISCUSSION
Oysters are known to show large variations in their meat quality depending on their physiological conditions and associated environmental factors (Durve, Reference Durve1964). Allometric relationships in a number of bivalve species have been reported by earlier workers. Hamai (Reference Hamai1934, Reference Hamai1935a, Reference Hamaib) showed that physical nature of the substratum, salinity, temperature and other chemical characteristics of the water influence the dimensional relationships. Variation in deformed/proper size of shell reported during the study period conforms with the findings of Hamai (Reference Hamai1934, Reference Hamai1935a, Reference Hamaib).
Dame (Reference Dame1972) and Ansari et al. (Reference Ansari, Nair, Harkantra and Parulekar1978) stated that height of shell is considered to be effective in predicting biomass parameters. Oysters were irregular in shape and they lived in an overcrowded colonial pattern attached to the hard substratum (rock) in the present study. They are subjected to a process called xenomorphism in which their shape is determined by contours of the substrate on which they grow (Quayle & Newkirk, Reference Quayle and Newkirk1989). The infestation by other specimens on oyster along the colony compels an alteration of its growing pattern to accommodate itself within the colony. Dimensional relationships are changed by the environmental conditions under which the oyster grows (Seed, Reference Seed1968, Reference Seed1973; Hickman, Reference Hickman1979; Jones et al., Reference Jones, Jones, Baxter, Naylor and Hartnoll1979). Overcrowding results in the assumption of a variety of crooked forms in India (Rao & Nayar, Reference Rao and Nayar1956). This was observed in S. cucullata collected from Baindur during the present study.
Regional differences in oyster allometry have been reported by Dame (Reference Dame1972) and Soong et al. (Reference Soong, Liu, Chen and Chen1992). Significant inter-site variability in the allometric relationships was reported in S. cucullata by Helen (Reference Helen1997). The general pattern of growth at the study site is not for individuals to become proportionately longer and flatter and such changes in shell form do not have important adaptive significance. Increases in shell length and width relative to shell height could effectively enhance the physical stability of animals on the rocks (Helen, Reference Helen1997).
Helen (Reference Helen1997) found that population density, growth rate and degree of exposure to wave action influenced differential growth of oysters, producing a considerable array of shell forms. The oyster colonies from the study area were generally overcrowded, covered with sediments, with individuals having irregular shapes with different sizes. However, shell cavities in S. cucullata were generally found to be deep, except in some organisms, which were shallow.
Environmental stresses such as food deficiency, high copper concentrations, elevated suspended sediment loadings and limited water exchange are possible agents causing shell thickening in oysters (Brown & Hartwick, Reference Brown and Hartwick1988). The concept of ‘condition’ is defined as a measure of the meat content of a shellfish (Hickman & Illingworth, Reference Hickman and Illingworth1980). Measurement of condition is a well-established technique for assessing the ‘health’, or fatness, of bivalves and the index, relating the amount of shell to the quantity of living tissue, has been used for many decades, both in commercial practice and scientific research (Davenport & Chen, Reference Davenport and Chen1987). The use of condition measurement in environmental monitoring was suggested because a reduction in condition is associated with physiological stresses (Goldberg, Reference Goldberg1980). Pridmore et al. (Reference Pridmore, Roper and Hewitt1990) studied marine pollution effects in the condition of Crassostrea gigas from Manukau Harbour (New Zealand), suggesting that CI values agreed well with known pollution gradients. In India, a variety of different methods, based on meat and weight, have been used for assessing bivalve condition indices involving shell cavity volumes, ash-free dry meat weights, biochemical contents (e.g. glycogen and protein) and physiological measurements, which are tedious and time-consuming for routine estimates.
The index relating meat dry weight and shell dry weight was employed in the present study for assessing the condition of S. cucullata. Based on the seasons, the general pattern of CI was low condition during monsoon and high condition during post-monsoon and pre-monsoon. CI increased during post-monsoon and pre-monsoon generally when there was a considerable increase in water temperature and decreased during monsoon when falling temperatures were recorded in India (Hemachandra, Reference Hemachandra2009; Tenjing, Reference Tenjing2017). Perhaps this is due to food availability and a variety of crooked forms due to overcrowding (Rao & Nayar, Reference Rao and Nayar1956). Helen (Reference Helen1997) suggested that low condition of S. cucullata in winter when water temperature was low might be attributed to low feeding rate leading to a reduced build-up of food reserves in the body, an increase in the shell weight by production of new material and utilization of stored food products for growth and maintenance. This is in accordance with the present findings. The PE followed similar trends to CI, with highest meat percentage in July, December and April. In monsoon, PI might decline sharply subsequent to spawning. The present range of CI values is comparable to the observations of Kumari et al. (Reference Kumari, Rajagopal and Sumitra-Vijayaraghavan1977) who worked on Meretrix casta (2.8–3.56) from natural beds of the Indian coast.
It is found that biometric relationships (between length-breadth, length-width, length-total weight, length-shell weight, length-meat wet weight and length-dry meat weight) tended to be stable in a linear/curvilinear pattern. However, the variation difference occurred in the condition index which could be attributed to ecological variations. Seasonal fluctuations in the condition index were probably related to cycles of gonadal maturation and spawning.
ACKNOWLEDGEMENTS
The author gratefully acknowledges the authorities of Mangalore University, Mangalagangothi (Karnataka state, India).
FINANCIAL SUPPORT
The author is thankful to the University Grant Commission, New Delhi for providing a fellowship [BSR-UGC Meritorious Fellowship, UGC No.4-1/2008(BSR)] during the course of work.