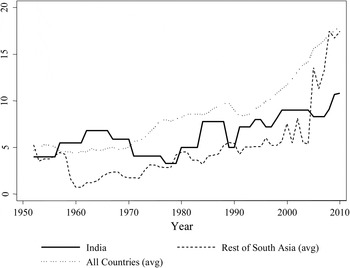


Does the gender of legislators affect their legislative activities? The vast majority of studies suggest that gender does make a difference. Women may engage in greater legislative activity (Anzia and Berry Reference Anzia and Berry2011) and focus on issues that are systematically different from the issues that men focus on (Bratton and Haynie Reference Bratton and Haynie1999; Catalano Reference Catalano2009; Childs Reference Childs2004; Schwindt-Bayer Reference Schwindt-Bayer2006; Thomas Reference Thomas1994). Much of the literature relates to the United States and Western Europe and, to a smaller extent, Latin America. Similar studies are lacking for the Indian legislature, although it represents the world's largest democracy. This is particularly important given the persistently low levels of women's political representation in India. Figure 1 shows time trends in women's legislative representation in India in comparative perspective. While the numbers were very low in the early 1950s, they were no different from the South Asian or world average at the time. However, the world average increased dramatically in the 1990s, and the South Asian average increased dramatically in the 2000s while levels of representation in India have stagnated.
Indian legislature in comparative perspective.

Not only is women's representation very low in India, but the historical lack of agency of women in the home and community is often projected into the idea that women politicians are simply placeholders for men. Sometimes dismissed as biwi-beti-bahus (wives, daughters, daughters-in-law), female legislators “tend to become mere figureheads with no real bargaining power” (Haq Reference Haq2000, 138). In interviews with legislators, Kaushik (Reference Kaushik and Kamala1992, 40) notes a general complaint that “[w]omen legislators are not taken seriously or given responsible tasks like introducing motions.” Such stereotypes have produced, for instance, resistance to women's legislative quotas from parts of the male political establishment.Footnote 1 However, the extant literature for India cannot substantiate or reject the claim that women legislators are systematically poorer performers.
For exploring gender and legislative performance in India, this study eschews a hypothesis-driven approach in favor of an empirical approach, for two reasons. First, there is a lack of systematic descriptive evidence regarding gender and legislative behavior in developing world parliamentary systems such as that of India. Second, extant theory regarding gender and legislator behavior, while developing different strands, does not generate a sufficiently clear-cut set of expectations. While the empirical focus limits the contribution of the article on the theoretical front, it expands its empirical scope. This allows it to establish that while gender is correlated with legislative activity, the relationship is not causal in the case of India, and that the correlation masks underlying causal factors that happen to be correlated with gender.
I use a unique dataset of all legislators in the lower house of the Indian parliament (the Lok Sabha) over a thirty-year period (1980–2009). The focus is on the Question Hour, the only open plenary that gives women—a historically marginalized group—the opportunity for expressing voice without party or other strictures. The results indicate that the volume of legislative activity of women in the Lok Sabha is substantially less than that of men—by about 24%—even after accounting for several covariates. Further, gender is correlated with question content: in the last two Lok Sabhas (1999–2004 and 2004–2009), female legislators asked fewer questions than men on issues related to the economy and defense and more questions on women's issues, a result that is congruent with several studies of western legislatures.
However, observed correlation between gender and legislative activity does not necessarily imply causation. The possibility of selection bias implies that female and male legislators may differ systematically on other attributes besides gender, and it could be these other attributes—often unobserved—and not gender that drive the observed correlation between gender and legislative activity. To explore causality, I use the quasi-experimental regression discontinuity (RD) design pioneered by Thistlethwaite and Campbell (Reference Thistlethwaite and Campbell1960). The design focuses on legislators who win in close elections against candidates from the opposite gender. It is plausible to think that the gender of winners of such close elections is quasi-randomly chosen (Brollo and Troiano Reference Brollo and Troiano2012; Ferreira and Gyourko Reference Ferreira and Gyourko2011; Jacob and Singhal Reference Jacob and Singhal2010) so that female and male legislators generated from close elections are likely to be more similar on average compared to the full set of women and men in the legislature. The results indicate that there is little difference in the performance of quasi-randomly chosen groups of female and male legislators. This suggests that the observed differences (that is, the correlational estimates) are caused largely by attributes other than gender per se. In addition, the observed correlation between gender and question content for the last two Lok Sabhas disappears in the RD results except for questions on the economy. Overall, the results contradict the prevailing sense in India's male political establishment that a woman's gender circumscribes her abilities as a legislator; in fact, gender by itself makes little difference. These empirical insights are consistent with Karpowitz, Mendelberg, and Shaker's (Reference Karpowitz, Mendelberg and Shaker2012) findings that specific aspects of the context can substantially affect the causal gender effect. The implication for theory building is that theories of gender and political behavior must devote greater attention to the mediating role of individual-specific and institution-specific attributes.
The remainder of the paper is organized as follows. The next section discusses related research and reasons for adopting a primarily empirical approach. Following that, the methodology (negative binomial regression and regression discontinuity) and data are introduced. The analysis section first presents correlational and then causal estimates for the volume and pattern of parliamentary questions. The conclusion discusses the implications of the findings.
RELATED RESEARCH AND BACKGROUND
While a large literature looks at trends in, and covariates of, women's legislative representation—for instance, see Paxton, Kunovich, and Hughes (Reference Paxton, Kunovich and Hughes2007) and Wängnerud (Reference Wängnerud2009)—another literature looks at whether (and how) gender affects legislative processes and outputs. Below is a brief survey of this literature and the case for an empirical approach for India.
Gender and Legislative Activity
The literature has examined gender effects on a variety of “legislative procedures” and “legislative products” (Thomas Reference Thomas1994), such as ideological values, policy priorities, parliamentary debates and questions, voting records, bill introduction, and committee assignments (Wängnerud Reference Wängnerud2009). The majority of country studies suggest that women legislators have systematically different preferences and act accordingly so that the “politics of presence” (Lovenduski and Norris Reference Lovenduski and Norris2003; Phillips Reference Phillips1995) makes a difference. Women may “feel a particular, gendered duty to represent women's perspectives on issues popularly construed as ‘women's issues’” (Catalano Reference Catalano2009, 47), which may lead them to focus on issues related to women, children, education, and family health. Several studies for the United States find that there are gender differences in policy priorities and behavior in the legislature (Bratton and Haynie Reference Bratton and Haynie1999; Dodson Reference Dodson2006; Little, Dunn, and Deen Reference Little, Dunn and Deen2001; Poggione Reference Poggione2004; Saint-Germain Reference Saint-Germain1989; Sanbonmatsu Reference Sanbonmatsu2003; Swers Reference Swers2002; Thomas Reference Thomas1994; Vega and Firestone Reference Vega and Firestone1995). The literature on England also supports this general finding (Bird Reference Bird2005; Catalano Reference Catalano2009; Childs Reference Childs2004; Norris and Lovenduski Reference Norris and Lovenduski1995). This is also true for several studies of other western democracies—for instance, McAllister and Studlar (Reference McAllister and Studlar1992, Australia), Tremblay (Reference Tremblay1998, Canada), and Wängnerud (Reference Wängnerud1998, Sweden). Outside of the advanced industrialized world, an emerging literature from Latin America also finds some similar results (Jones Reference Jones1997; Schwindt-Bayer Reference Schwindt-Bayer2006; Taylor-Robinson and Heath Reference Taylor-Robinson and Heath2003).Footnote 2 However, in the case of India, there have been no systematic studies of the correlation between gender and legislative activity.
The literature has long commented on the fact that historical, social, and structural factors influence the legislative activities of female and male legislators. The implication is that even if a correlation is established between gender and legislative activity, it does not necessarily imply a causal role for gender.Footnote 3 For instance, it may be the case that the historical marginalization of women and the construction of gender norms have long-lasting effects on the levels and patterns of activity of both female and male legislators. Legislative and other institutions project deeply embedded gender biases (Hawkesworth Reference Hawkesworth2003; Lovenduski Reference Lovenduski2005), and it is possible that such biases make it harder for women to be as active as men in the legislature, especially in highly gender-unequal societies (Taylor-Robinson and Heath Reference Taylor-Robinson and Heath2003). Further, gender perceptions may force female legislators to become sidelined from stereotypically masculine issues (Catalano Reference Catalano2009). The levels and patterns of activity of women legislators may also depend upon the attainment of critical mass in women's representation (Childs and Krook Reference Childs, Krook and Childs2008; Dahlerup Reference Dahlerup1988; Karpowitz, Mendelberg, and Shaker Reference Karpowitz, Mendelberg and Shaker2012).Footnote 4
Female and male legislators may also differ on other, more personal attributes that may influence their legislative activity. For instance, Anzia and Berry (Reference Anzia and Berry2011) argue that in the case of the United States Congress there is likely to be “sex-based selection” because voters might discriminate against women candidates, or potential women candidates are less likely to enter the electoral fray (Lawless and Fox Reference Lawless and Fox2005). Because of this, women legislators are of higher quality, implying that the legislative behavior of women will be superior to that of men. Female and male legislators may also differ along other observed attributes such as ideological values (Welch Reference Welch1985) as well as several unobserved attributes.Footnote 5 Thus, any observed correlation between gender and legislative activity may be driven by other, context-specific attributes and cannot be interpreted as essentialist in nature (Williams Reference Williams1998). From a methodological perspective, therefore, observed gender differences in legislative activity may well be driven by omitted variables. While such a conclusion is consistent with the extant literature, most studies do not address the problem explicitly.
Empirical Approach
Two aspects of the extant literature on gender and legislative behavior justify a primarily empirical study for India. First, extant theory does not sufficiently guide the formulation of hypotheses for the Indian case, particularly on the question of legislative effectiveness. On the one hand, if there is sex-based selection along the lines of Anzia and Berry's (Reference Anzia and Berry2011) argument, then we might expect women to be more effectual than men. On the other hand, if women legislators are disproportionately more likely to be placeholders for men (biwi-beti-bahus), then they may engage in less legislative activity. Further, if the legislature is a gendered institution and/or women do not attain critical mass, then we might expect them to be less effectual. However, it is possible that when the deck is stacked against them in this manner, women legislators react by becoming more engaged in legislative activity. The experimental study by Karpowitz, Mendelberg, and Shaker (Reference Karpowitz, Mendelberg and Shaker2012) suggests that the gender effect also depends upon decision-making rules. Extending this idea, it is possible that the gender effect may depend upon other institutional details besides the specific rules that they focus on (majority versus unanimity rule), as Grunenfelder and Baechtiger (Reference Grunenfelder and Baechtiger2007) have observed for the Swiss and German legislatures.Footnote 6 In short, extant theory, while developing different strands, does not yield a sufficiently clear-cut set of expectations.
Second, the empirical literature does not reveal a consistent answer regarding the relationship of gender and legislative behavior. Even for the same country, empirical work has uncovered varying results; for instance, for the United States, Anzia and Berry (Reference Anzia and Berry2011) find that female legislators perform better while Jeydel and Taylor (Reference Jeydel and Taylor2003) find that there is little difference between the genders. In the context of parliamentary questions specifically, some prior research suggests minimal gender differences—Murray (Reference Murray2010, France) and Rasch (Reference Rasch2011, Norway)—although Bird (Reference Bird2005, Britain) concludes that gender does make a difference. The differences in empirical findings suggest that context (even within the same country) and mediating factors are important, but a theory incorporating specifics of context and mediating factors is yet to be consolidated. Further, it is not clear to what degree the extant theory and empirics, developed for other contexts, can be applied to developing country parliamentary systems such as that of India. Given these features of the extant literature, which do not yield a sufficiently clear-cut set of expectations, I adopt a primarily empirical approach.Footnote 7
In addition, opting for an empirical study allows focus on disentangling correlation from causation in the relationship between gender and legislator behavior. While the literature has proposed causal hypotheses for the United States and Western Europe, much of the empirical work has not adopted methodological designs that can yield causal estimates. As Karpowitz, Mendelberg, and Shaker (Reference Karpowitz, Mendelberg and Shaker2012, 537) note, “[i]t is possible that gender differences are spuriously caused by preferences or attitudes correlated with individual gender.” The addition of such covariates as controls in an estimation equation is insufficient to get at the causal role of gender because omitted variable bias cannot be ruled out without a valid experimental or quasi-experimental design.Footnote 8
Gender, Politics, and Outcomes in India
The literature devoted to India explores several important facets of gender politics: women's suffrage (Pearson Reference Pearson, Edwards and Roces2004), the debate over affirmative action (“reservations”) for women (Krook Reference Krook2005; Nanivadekar Reference Nanivadekar2006), dynastic paths to power (Fleschenberg Reference Fleschenberg2004; Katzenstein Reference Katzenstein1978), women in local government (Kaushik Reference Kaushik1998; Kudva Reference Kudva2003), and women's movements (Deo Reference Deo2012a; Desai Reference Desai, Snow, Porta, Klandermans and McAdam2013).Footnote 9 The literature on women legislators in India is largely descriptive in nature—for instance, Lenneberg (Reference Lenneberg1994), Kumari and Dubey (Reference Kumari and Dubey1994), Mishra (Reference Mishra2000), Rai (Reference Rai2002), and Singh (Reference Singh2003).
Does gender make a difference to political processes or outcomes in India? Traditionally, this question has been addressed only informally and by focusing on the top echelons of power, and the informal understanding is that even if women “hold the top positions in major political parties of the region … these powerful positions have not translated into positive outcomes for the majority of … women” (Haq Reference Haq2000, 147). In a study of women legislators in Orissa state, Mishra (Reference Mishra2000) presents data that show that female legislators asked far fewer questions than male legislators (80% fewer questions in 1974–76 and 54% fewer questions in 1977–79).Footnote 10 However, a recent quantitative literature focusing on causal effects of women's representation suggests that greater women's representation in village councils increases the reporting of crimes against women (Iyer et al. Reference Iyer, Anandi Mani and Topalova2012) and tilts public expenditure outlays toward projects favored by women (Chattopadhyay and Duflo Reference Chattopadhyay and Duflo2004). The only other estimation of causal effects of women's legislative representation in India is by Clots-Figueras (Reference Clots-Figueras2012), who shows that greater women's representation in state legislatures improves educational outcomes.
Background: Question Hour in the Lok Sabha
India is a parliamentary democracy set up along the lines of Westminster. I study the Lower House of parliament (the Lok Sabha),Footnote 11 and in particular, the institution of the Question Hour. As is the case with several western legislatures (Rozenberg and Martin Reference Rozenberg and Martin2011), in Question Hour legislators are not restricted by whip, debate, vote, or motion that would require party regulation. During Question Hour, legislators pose questions to the government, and these are answered by ministers. The legislator submitting the question must provide the text of the question in a prescribed format specifying the name of the minister being addressed and whether the request is for an oral (“starred”) or written (“unstarred”) answer (Lok Sabha Secretariat 2004b). Each legislator can request to ask up to five questions (one oral) per session day, but the speaker will allow a maximum of only 250 questions (20 oral) from the pool. A ballot determines which of the questions will be on the roster.Footnote 12
METHODOLOGY AND DATA
In exploring the covariates of the volume of parliamentary questions, the standard practice in the literature is to use the negative binomial regression (NBR) model.Footnote 13 The model used in this article includes an exposure variable for the length of each Lok Sabha as well as several standard control variables (year and state dummies and legislative roles and personal characteristics of legislators) discussed later. The NBR model provides an estimate for the association of gender with the volume of parliamentary questions, but this correlational estimate cannot be interpreted as a causal estimate.
In order to address causality, I employ a regression discontinuity (RD) design. The design rests on a key variable, the margin of victory of a legislator against a candidate from the opposite gender, defined as positive for female legislators and negative for male legislators. By construction, there is an observable discontinuity in the gender of the winner (legislator) when the margin of victory is zero (the cutoff). In the neighborhood of the discontinuity—that is, for the subset of female and male legislators who win in close elections against candidates from the opposite gender—the gender of the winner (legislator) can be interpreted as being randomly assigned. Therefore, any difference in the volume of legislative activity between female and male legislators in that neighborhood can arguably be attributed to the gender effect alone.
The plausibility of the assumption that the gender of the winner (legislator) is randomly determined near the cutoff gives the estimator high internal validity and quasi-experimental status. Operationally, the standard practice is to construct polynomial regressions allowing for different structures of nonlinearity on either side of the cutoff (Imbens and Lemieux Reference Imbens and Lemieux2007) and then estimate the discontinuity gap in the outcome variable (volume of legislative activity) at the cutoff.Footnote 14 Other recent work that has used the RD design for close elections where women and men win include Brollo and Troiano (Reference Brollo and Troiano2012), Ferreira and Gyourko (Reference Ferreira and Gyourko2011), and Jacob and Singhal (Reference Jacob and Singhal2010), as well as Clots-Figueras (Reference Clots-Figueras2012) in a related context. For the discontinuous jump in the outcome variable to be attributed to the quasi-random “treatment,” there is a mild continuity requirement for the margin of victory (Lee Reference Lee2008). Further, to check that RD is properly operationalized, it is standard practice to establish that predetermined variables do not exhibit discontinuity at the cutoff (Caughey and Sekhon Reference Caughey and Sekhon2011). Appendix A presents evidence that these continuity assumptions hold.
In short, the notion of quasi-random “treatment” enables the RD design to reduce dissimilarities between groups that are being compared, increasing the plausibility that any estimate of outcome difference can be causally attributed to the “treatment effect.” However, when applied to female and male legislators, especially in a context such as India, the RD design does not eliminate all possible dissimilarities between the two groups. Consider the two (context-specific) sets of attributes of female and male legislators that were alluded to earlier—personal attributes that are correlated with gender, and historical/structural factors that produce gender discrimination. The RD design accounts for differences in personal attributes because it is plausible that female and male legislators have similar sets of personal attributes (on average) in the neighborhood of the cutoff. However, the RD design does not account for the second set of attributes. Even in the neighborhood of the cutoff, female and male legislators will differ systematically in their experience of historical/structural gender discrimination. Therefore, what the RD approach estimates is a “historically conditioned” gender effect, that is, the combination of a “pure” gender effect (which may or may not exist) and the effect of historical/structural gender discrimination. Throughout this study, it is this combination that is being estimated by the “gender effect.”
As with other (quasi-)experimental methods, the RD design has high internal validity but low external validity (McDermott Reference McDermott, Druckman, Green, Kuklinski and Lupia2011). The strength of the RD design lies in its estimation of a causal gender effect for legislators with small gender margins of victory. However, the gender margin of victory may not be randomly distributed among female and male legislators: legislators may have specific attributes that cause both the level of their gender margin of victory as well as their parliamentary behavior. This possibility makes it difficult to extend the causal estimate to legislators who are not in the neighborhood of the cutoff, producing low external validity.Footnote 15 Another aspect of the low external validity is that since the gender effect identified by the RD approach is conditional on a candidate being nominated for an election, it cannot be generalized to the larger population of women and men.
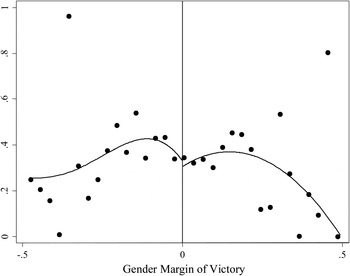
Figure 2 shows the RD design graphically. The left and right sides of the graph plot the average number of questions asked per day by male and female legislators, respectively, as a function of the margin of victory/defeat of female candidates who win/lose against male candidates. Male and female legislators are distinguished by the zero cutoff on the horizontal axis.Footnote 16 The graph suggests that there is little discontinuity in question activity at the zero cutoff, that is, the absence of a gender effect.Footnote 17
The regression discontinuity design.

Data on Parliamentary Questions
The dependent variable is the number of questions asked by each legislator in each separate Lok Sabha, constructed using end-of-term reports from the Lok Sabha secretariat. Two versions of this variable are used: (a) the total number of questions asked by a legislator during the life of a Lok Sabha, for the NBR model; and (b) the average number of questions asked per day, for the RD model. While the main variable aggregates questions calling for oral and written answers, the analysis also explores the two question types separately.Footnote 18 There were eight distinct Lok Sabhas in the three decades under study, with lengths varying between one and five years (1980–85, 1985–89, 1989–91, 1991–96, 1996–98, 1998–99, 1999–2004, and 2004–09).Footnote 19 Since opposition status of parties was unclear in 1989–91, a particularly turbulent period, that Lok Sabha is excluded from the analysis.Footnote 20 This yields a dataset with 3,771 legislators, of whom 289 (7.7%) are women. On average, female and male legislators asked 0.33 and 0.42 questions per day, respectively, making for a difference of 21%.Footnote 21 However, focusing on the subset of legislators in close elections against a candidate from the opposite gender, the corresponding figures for female and male legislators are much closer. For instance, in the case of elections with margins of victory under 5% of the vote share, there were 137 legislators, of whom 66 (48.2%) were women. On average, female and male legislators in this subset asked 0.33 and 0.35 questions per day, respectively, making for a difference of less than 5%.Footnote 22
For the last two Lok Sabhas (1999–2004 and 2004–2009), data are available for the content of each of the 148,008 questions asked during Question Hour. Seven question topics are coded from these data: issues concerning women, crime, crime against women, children, health, the economy, and national defense. Details of the coding procedure are provided in Appendix B. Strikingly, of the subset of questions coded into these seven categories, almost half were related to finance. The share of questions related to women's issues was only about 4% for women and even less for men.
Other Variables
The dataset also contains several control variables. Dummy variables for years account for influences that are common across legislators but differ across Lok Sabhas. Dummy variables for states account for state-specific influences on the number of questions asked by legislators. Dummy variables for opposition and backbencher status account for the incentive of opposition (compared to governing party) legislators and backbenchers (compared to ministers) to engage in greater oversight activity. There is also a variable for women's representation in the corresponding Lok Sabha to account for the possibility that the presence of more women in the legislature may affect the volume or content of an individual legislator's questions. The following control variables capture personal attributes: age; dummies for whether the legislator was elected from a constituency reserved for historically marginalized Scheduled Castes (SCs) or Scheduled Tribes (STs); dummies for highest educational degree (high school, bachelors degree, masters degree); dummies for previous state and national legislative experience; and dummies for previous ministerial experience coded by status (cabinet minister, minister of state, and deputy minister). Data for gender of legislators, minority categories, and legislators’ prior experience in winning Lok Sabha elections all come from the Statistical Reports compiled by the Election Commission of India (ECI), the constitutional body that conducts and monitors elections. Data related to the personal background of legislators, such as age, gender, education, and state legislative experience come from Who's Who volumes (Lok Sabha Secretariat 2003, 2004a).
GENDER AND PARLIAMENTARY QUESTIONS
Below, the analysis first explores the relationship between gender and the volume of parliamentary questions and establishes that there is correlation but not causation. Following that, it explores the relationship between gender and question content for the 1999–2004 and 2004–2009 Lok Sabhas for which question content information is available.
Volume of Parliamentary Questions
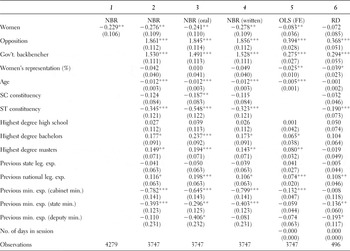
Columns 1–4 of Table 1 present NBR estimation results for the association of gender and other covariates with the volume of questions asked during Question Hour. Unsurprisingly, opposition legislators ask more questions than government legislators, and government backbenchers ask more questions than ministers. The results for the other control variables conform to patterns in journalistic accounts.Footnote 23 The estimated coefficient for women varies between –0.23 and –0.28 and is significant at the 95% level. Since NBR results are difficult to interpret, the incidence rate ratio (IRR) or exponentiated coefficient is useful. The IRRs for women are 0.76–0.80, implying that women ask 20–24% fewer questions compared to men, which makes for a substantial difference. Further, the estimated gender effect is robust to the inclusion of covariates (Column 2 compared with Column 1). Columns 3 and 4 disaggregate the result by question type (questions calling for oral as opposed to written answers). The results suggest that the correlational gender effect is not very different for the two types of questions.Footnote 24
Women legislators and Question Hour participation, 1980–2009

Notes: Columns 1–4 use the NBR model, 5 uses OLS with district fixed effects, and 6 uses RD design. See text for description of control variables. For education variables, the excluded category is legislators without high school degree. Variables for political experience are constructed as dummies. In all models except Column 1, year and state dummies are used but not reported. In all models except Column 1, the 1989−91 Lok Sabha is excluded because government/opposition status of legislators was unclear in that Lok Sabha. OLS and RD estimates use robust standard errors. *, **, and *** show statistical significance at the 10%, 5%, and 1% levels, respectively.
Column 5 of Table 1 presents OLS results for the volume of questions asked per day for the duration of a Lok Sabha after accounting for district fixed effects similar to the strategy of Anzia and Berry (Reference Anzia and Berry2011) for the United States Congress. The estimated gender effect in Column 5 is statistically significant at –0.083. Given that the average number of questions asked per day by men is 0.42, this works out to –0.083/0.42 = 20% fewer questions from women, making the figure comparable to the estimate of 24% from Column 2. Thus, the OLS estimates are consistent with the NBR estimate, showing that the results are robust to model specification.Footnote 25
However, the results change dramatically for observations where men's and women's other attributes are more likely to be similar on average. The RD estimate in Column 6 indicates that there is no gender effect for the volume of questions asked.Footnote 26 Additional results suggest that the absence of gender effect was true for individual decades as well. Figure 2, described in the previous section, shows the same result graphically.Footnote 27
Content of Parliamentary Questions
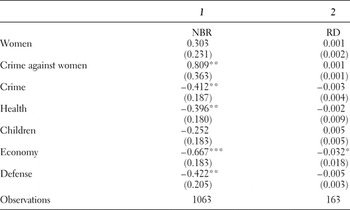
Table 2 presents results from NBR and RD models for gender effect on content of questions asked for the 1999–2004 and 2004–2009 Lok Sabhas. The NBR results in Column 1 suggest that, in line with the literature from the United States and Western Europe, female legislators ask more questions on women's issues—a third more (but without statistical significance) and more than double the questions on crime against women (with statistical significance).Footnote 28 By contrast, the NBR results show that female legislators ask significantly fewer questions in most other categories—by 34%, 33%, 49%, and 34%, respectively, for crime, health, the economy, and defense.Footnote 29 Column 2 shows RD results: the statistical significance for six of the seven categories is wiped out when the analysis focuses on the subset of observations where female and male legislators are more similar to each other. That is, in most question categories there appears to be little gender effect except in the case of questions regarding the economy, where women fare worse. The overall results are consistent with the findings of Kumari and Dubey (Reference Kumari and Dubey1994, 88) that women-specific issues are raised by both women and men in the legislature, so that female legislators are “not ‘ghettoized’ in terms of raising only women-specific issues.”Footnote 30
Women Legislators and Content of Parliamentary Questions, 1999–2009

Notes: Each row presents coefficients and standard errors for women for the corresponding dependent variable (volume of each type of parliamentary question) for the NBR model (Column 1) and the RD model (Column 2); see text for description of how dependent variables are constructed. The estimates for women are from models that also include all the control variables used in Table 1, although these coefficients are not reported. RD estimates use robust standard errors. *, **, and *** show statistical significance at the 10%, 5%, and 1% levels, respectively.
While the available results from RD suggest that there is little gender effect on most question content areas, they are based on a relatively small set of observations (163).Footnote 31 The collation of additional data from Lok Sabhas prior to 1999–2004/2004–2009 may throw light on this. Observers of Indian gender politics do not take a unanimous stand regarding the question of whether female legislators favor women's issues. On the one hand, Kishwar (Reference Kishwar1996, 19) notes that “[t]he more successful among women politicians do not like to be seen as representing women's interests.” On the other hand, Ranjana Kumari notes, “Earlier they [female legislators] would speak—and were expected to only speak—on women's issues. But they have moved beyond that, talking finance, foreign affairs and defense.”Footnote 32 Supriya Sule, a female legislator, offers a blend of these perspectives: “Of course, women will be more sensitive to gender issues, but to think that that is all they are interested in is to stereotype them. Look at Sushmaji [a leading female legislator]—she speaks on a range of issues. This is about power.”Footnote 33 The presence of differences in these observations suggests the need for more systematic data collection on the content of parliamentary questions and legislative activity more generally. It is also possible that if other question topics were coded—besides the seven categories presented in Table 2—additional patterns may emerge regarding gender effects on the content of parliamentary questions.
CONCLUSION
This study contributes to two aspects of the literature on gender and legislative activity. First, it extends the empirical side of this literature, focused on the Americas and Western Europe, to the case of India. Second, it distinguishes correlation from causation and shows that even though women engage in less legislative activity than men—as proxied by the number of parliamentary questions—this may not be due to gender differences per se. While the contribution of this study is primarily empirical, the results have some implications for policy and theory. The results repudiate the view held by parts of India's male political establishment that women are less able legislators than men, a view that seems to suggest that gender matters. To the extent that this result weakens one objection to reservation of quotas for women, it offers indirect evidence in support of the Women's Reservation Bill that is still languishing in the Indian parliament. The results for question content also appear to counter the view that gender matters in bringing greater legislative attention to women's issues. From a normative perspective this is not necessarily a negative finding—as feminist legislator Brinda Karat puts it, “Why should women be expected to have magic wands?”Footnote 34 —and there may be something to the argument that in a highly gender-unequal society such as that of India, such stereotyping of female legislators might produce considerable harm.
This study has focused on one specific aspect of legislative behavior, namely volume and content of parliamentary questions. In this sense the focus has been narrow, but political theorists note that this aspect is indeed an important element of the democratic process and that the democratic standard falls if participation is unequal. Further, unequal participation in parliamentary questions may translate into unequal influence and authority within the legislature, as has been noted in other contexts of deliberation (Burns, Schlozman, and Verba Reference Burns, Schlozman and Verba2001; Fiske Reference Fiske2010). More research is necessary to explore gender and participation in other legislative arenas besides parliamentary questions, not only in the Lok Sabha, but also in other developing country parliamentary systems.
It is important to emphasize the context specificity of the results uncovered in this study. While the RD design accounted for differences in personal attributes of female and male legislators, it could not account for differences in the experience of historical/structural gender discrimination. This implies that the estimated gender effect is actually a combination of some “pure” effect and a historically conditioned effect. As gender discrimination changes, it is likely that the estimated zero gender effect may change—for instance, once female legislators reach a critical mass. As noted in Figure 1, in matters of women's political representation, India lags considerably behind the rest of the world and even its gender-unequal South Asian neighbors. To the extent that the critical mass argument holds, it may well be the case that gender will matter once larger numbers of women enter the Lok Sabha—for instance if the Women's Reservation Bill is passed. In the case of neighboring Pakistan, there has been a large increase in female legislators in recent years (to 23%), and The Nation newspaper reports that in 2011 female legislators asked over three times the number of questions asked by male legislators.Footnote 35 Further, the results reported in this study are a function of the specific institutional rules of the Lok Sabha, and it is possible that the gender effect may change under a different set of institutional rules, as suggested by the experimental work of Karpowitz, Mendelberg, and Shaker (Reference Karpowitz, Mendelberg and Shaker2012) regarding deliberations. Similarly, the work of Grunenfelder and Baechtiger (Reference Grunenfelder and Baechtiger2007) suggests that specific institutional details can “drown out” gender effects.
Finally, the disjunction between the correlational and causal estimates for India suggests that female and male legislators tend to differ on attributes (other than gender) that matter for legislative activity. While female and male legislators may differ on observed attributes, such as the control variables used in Tables 1 and 2, they may also differ on unobserved attributes that affect legislative activity. The possibility of unobserved attributes is particularly important because the drivers of legislative activity in India—and outside of the Americas and Western Europe in general—have not been sufficiently explored in the literature.Footnote 36 While the identification of such attributes is an important empirical exercise, it is beyond the scope both of this study and the specific regression discontinuity design used here.Footnote 37 More research is necessary to identify and estimate the causal role of attributes that are masked by the correlational gender effect, and theory-building should incorporate these empirical insights.
APPENDIX A: ASSUMPTIONS UNDERLYING RD DESIGN
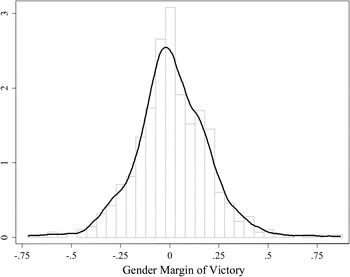
The key identifying assumption in the discontinuity-based approach is nonmanipulability. As long as female and male candidates do not have precise control over the gender margin of victory, outcomes will be distributed continuously at the zero cutoff. This increases confidence in the exchangeability of observations on either side of the cutoff. In the context of Indian electoral districts, it is very unlikely that voter coordination would produce a nonrandom pattern of results in close elections, so it is reasonable to expect that the gender margin of victory would be smooth around the cutoff. Appendix A, Figure A1 shows a histogram and kernel density function for the gender margin of victory, which suggests smoothness.
Smoothness of forcing variable.

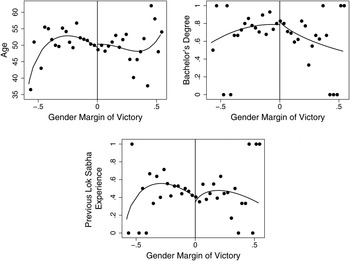
The discontinuity-based approach is valid when candidates around the cutoff are similar. One implication is that while gender of the victor changes discontinuously as a function of the gender margin of victory, predetermined characteristics should be smooth at the zero cutoff. It is standard practice to check for this, particularly after Caughey and Sekhon (Reference Caughey and Sekhon2011)’s critique of the influential work of Lee (Reference Lee2008) on this score. Appendix A, Figure A2 illustrates continuity for three predetermined variables: age, attainment of bachelor's degree (dummy), and previous Lok Sabha experience (dummy). The figure shows that there is little gender discontinuity in the incidence of these personal attributes on either side of the cutoff. Additional results for several other predetermined variables—whether legislators are from the big national parties (Congress and BJP), the meso-national families of parties (Janata and communist), or all remaining, subnational parties; and whether legislators are from the northern “bimaru” states (Bihar, Madhya Pradesh, Rajasthan, Uttar Pradesh), southern states (Karnataka, Kerala, Tamil Nadu, Andhra Pradesh), or eastern states (West Bengal, Orissa, and the northeastern states of Arunachal Pradesh, Assam, Manipur, Meghalaya, Mizoram, Nagaland, Sikkim, and Tripura)—also show absence of discontinuity.
Test of predetermined characteristics in RD design.

APPENDIX B: CODING PARLIAMENTARY QUESTIONS
In the 1999–2004 and 2004–2009 Lok Sabhas, as many as 148,008 questions were asked by legislators. The Lok Sabha Secretariat lists short one-line summaries of question content, and I used a key word search method to code these questions on seven topic issues concerning women, crime, crime against women, children, health, the economy, and national defense. To identify key words, I selected a random sample of over 3,000 questions and identified words that would suggest that the question content covered each of these seven topic areas. I also added additional key words for these topic areas. The following is the list of key words used:
-
(1) Questions concerning women's issues consisted of at least one of the following words or its grammatical forms: woman, mother, girl, balika, gender, mahila, nari, maternal, widow, NCW, maid, dowry, Swadhar, Swayamsidha, surrogacy, devadasi, rape, sati, eve teasing, prostitution.
-
(2) Questions concerning crime issues consisted of at least one of the following words or its grammatical forms: crime, atrocity, harassment, attack, abuse, trafficking, jail, torture, exploitation, violence, safety, eve teasing, terror, rape, police, murder, assault, helpline.
-
(3) All questions that had at least one of the key words for women's issues and one of the key words for crime issues were coded as questions on crime against women. In addition, the following key words or their grammatical forms were also included: rape, sati, eve teasing, women courts.
-
(4) Questions concerning health issues consisted of at least one of the following words or its grammatical forms: health, nutrition, hospital, dispensary, clinic, physician, doctor, nurse, medical, ayurveda, homoeopathy, malnutrition, anemia, HIV, AIDS, malaria, cancer, leprosy, encephalitis, disease, polio, jaundice, hepatitis, CGHS, measles, blindness, virus, bacteria, immunization, vaccination, dental.
-
(5) Questions concerning child issues consisted of at least one of the following words or its grammatical forms: child, youth, infant, teenager, crèche, anganwadi, nursery, school, ICDS, adoption, orphan, juvenile, shishu, adolescent, kishore, balika, UNICEF.
-
(6) Questions concerning the economy consisted of at least one of the following words or its grammatical forms: finance, economy, debt, RBI, SBI, bank, budget, revenue, privatization, investment, imports, exports, loan, company, PSU, credit.
-
(7) Questions concerning defense issues consisted of at least one of the following words or its grammatical forms: defense, military, army, navy, aircraft, combat, ammunition, arms.