

The early canon of the women in politics literature found that the public generally preferred men and stereotypically masculine traits over women and feminine traits (Alexander and Andersen Reference Alexander and Andersen1993; Conover and Feldman Reference Conover, Feldman, Lau and Sears1986; Huddy and Terkildsen Reference Huddy and Terkildsen1993b; Rosenwasser and Dean Reference Rosenwasser and Dean1989). Around 1992—the original “Year of the Woman”—women began to run more often than they had in the past and increased their overall numbers in elective office (Burrell Reference Burrell1994; Thompson and Steckenrider Reference Thompson and Steckenrider1997; Wasburn and Wasburn Reference Wasburn and Wasburn2011). Despite this, research continued to report preferences for men in politics (Dolan Reference Dolan2010; Eagly Reference Eagly2007; Sanbonmatsu Reference Sanbonmatsu2002) well into the twenty-first century.
Today, women still only hold approximately 25% of all federal elected offices in the United States (Herman and Sloman Reference Herman and Sloman2019). Yet recent research points to a change in public assessments of women in politics. Though differences persist in some realms, women are now much freer from many of the expectations and constraints of gendered behavior that characterized the politics of the past (Anastasopoulos Reference Anastasopoulos2016; Brooks Reference Brooks2013). This research aims to enhance our understanding of this important shift by examining which types of voters perceive women to be as capable as men, under which conditions, and on which attributes. We start by reviewing the evidence that women are now more welcome in the political arena in the eyes of voters, and sometimes they are even preferred in that arena to men. We then explain and analyze experimental survey data collected in the summer of 2018 that echoes other recent research findings that voters are increasingly willing to rate women on a par with men in politics, and sometimes award even greater assessments to women. We posit and evaluate theories explaining this result.
While partisanship was not signaled directly in the study, we asked respondents to guess the partisanship of the politicians; when respondents presume a politician's partisanship is the same as their own, a presumption of shared co-partisanship is related to large increases in favorability evaluations. This design choice was made to help tease out the impact of candidate gender in respondent evaluations. Moreover, in the United States, nearly 75% of municipal-level elections are conducted and balloted in a nonpartisan way (MacManus and Bullock Reference MacManus and Bullock2003); thus, for many people, electoral contests lack the explicit partisan cuing experienced on the national stage. While national general elections are undeniably characterized by partisanship, primary elections and races for many local political offices are either devoid of meaningful partisan cues or occur in such low-information environments that further investigation of individual voter party presumption processes is worthwhile.
We find that presumed partisanship unfolds in different ways for Democrats and Republicans. Democratic respondents more often project their own partisanship onto women rather than men politicians, which, in turn, boosts overall assessments of women. Republican respondents project co-partisanship equally onto men and women politicians—despite the fact that women politicians tend to be Democrats—and accordingly, we observe more positive assessments of women politicians overall.
GENDERED VOTER PREFERENCES AND POLITICIAN ASSESSMENTS
In the 1970s, women held fewer than 3% of all federally elected seats. At all levels, party elites in charge of recruitment efforts—who were mostly men—displayed marked preferences for men in efforts to field political candidates (Niven Reference Niven1998; Stuart and Vanes Reference Stuart and Vanes1978). Not only did party gatekeepers prefer men, but voters also preferred men and traditionally masculine stereotypes (Alexander and Andersen Reference Alexander and Andersen1993; Huddy and Terkildsen Reference Huddy and Terkildsen1993a; Rosenwasser and Dean Reference Rosenwasser and Dean1989). Stereotypically masculine traits such as toughness or assertive leadership were associated with “good” political candidates, while feminine traits such as compassion, warmth, and understanding were viewed as less desirable and more associated with women (Huddy and Terkildsen Reference Huddy and Terkildsen1993b). Gender was an easily visible cue used by voters to ascribe feminine traits to women and masculine traits to men, as well as to apply different standards, disadvantaging women in the process (Conover and Feldman Reference Conover, Feldman, Lau and Sears1986; Hedlund et al. Reference Hedlund, Freeman, Hamm and Stein1979; McDermott Reference McDermott1998; Sapiro Reference Sapiro1981; Sigelman et al. Reference Sigelman, Thomas, Sigelman and Ribich1986).
Despite research showing general preferences for men in politics, the 1990s saw women winning federal seats at higher rates than in the past.Footnote 1 Since then, research has come to note a double bind, whereby women are expected to meet two irreconcilable demands. For example, voters think women should be tough, but not too tough, lest they risk coming off as emasculating and unfavorable (Gay and Tate Reference Gay and Tate1998; Jamieson Reference Jamieson1995). Women are also held to higher qualification standards than men when running for office (Bauer Reference Bauer2020), and there are other assessment areas in which voters and politicians themselves unevenly apply standards to potential men and women candidates (Aalberg and Jenssen Reference Aalberg and Jenssen2007; Lawless Reference Lawless2004; Teele, Kalla and Rosenbluth Reference Teele, Kalla and Rosenbluth2018).
Gender remains an important and understandable cue for voters with very little other information (Mo Reference Mo2014). But more recently, researchers have argued that gender stereotypes held by voters no longer harm women candidates when seeking office (Anastasopoulos Reference Anastasopoulos2016; Brooks Reference Brooks2013). In the 2016 general election, only 13% of the population reported an explicit opposition to electing a woman as president (Burden, Ono and Yamada Reference Burden, Ono and Yamada2017), despite ongoing evidence that sexism and racism still influence candidate choice (Ditonto Reference Ditonto2019; Schaffner, MacWilliams and Nteta Reference Schaffner, MacWilliams and Nteta2018; Valentino, Wayne and Oceno Reference Valentino, Wayne and Oceno2018). Thus, gender remains an important feature of political assessment, yet both empirical and experimental evidence shows that partisanship often matters more to voters than gender when both partisanship and gender are known (Badas and Stauffer Reference Badas and Stauffer2019; Dolan Reference Dolan2014).
When voters are asked why they think there are fewer women in politics, opinions differ. Some still offer explanations that point to sexism in politics, but there is no longer overwhelming evidence of systemic biases favoring men over women in politics today (Dolan and Hansen Reference Dolan and Hansen2018). The point of our research is not so much to explain why we have seen changes over time, but rather to contextualize which sorts of people give higher assessments to women over men politicians and to offer an explanation of gendered partisan projection as to why we now observe these differential outcomes.
Since the 2016 election, a growing chorus of researchers have found that voters want more women in politics. Teele, Kalla, and Rosenbluth (Reference Teele, Kalla and Rosenbluth2018) report that women candidates still face discrimination in ways that men do not, but, all else being equal, respondents show a slight preference for women candidates. Additionally, in a recent meta-analysis of more than 40 experimental studies, Schwartz and Coppock (Reference Schwarz and Coppock2020) report a slight overall preference for women candidates.
In the summer of 2018, we fielded a survey experiment to examine assessments of men and women politicians. A set of experimental images of politicians were pretested, and we selected the two that were rated most similar on personality assessment measures.Footnote 2 Like others, our results indicated that respondents tended to give women politician higher marks on multiple trait assessments than they did for men after viewing a story about the politician. The first two years of Donald Trump's presidency coincided with the powerful uprising of women symbolized by the 2017 and 2018 Women's Marches and the #MeToo movement. Indeed, Trump's comments about women spurred massive backlash in online communities (Maas et al. Reference Maas, McCauley, Bonomi and Gisela Leija2018). We expect that this sort of consciousness raising contributed to a shifting landscape of preferences. The timing of our survey offers a window into the types of people who are more inclined to rate women more highly than men in the contemporaneous political environment and under what circumstances. In the following sections, we first describe the main effect of politician gender on respondent evaluations. Then, we lay out several theoretical explanations about who and what may drive the higher ratings for women before testing these hypotheses explicitly. We conclude by discussing the results with attention to the situational context of 2018.
EXPERIMENTAL METHOD
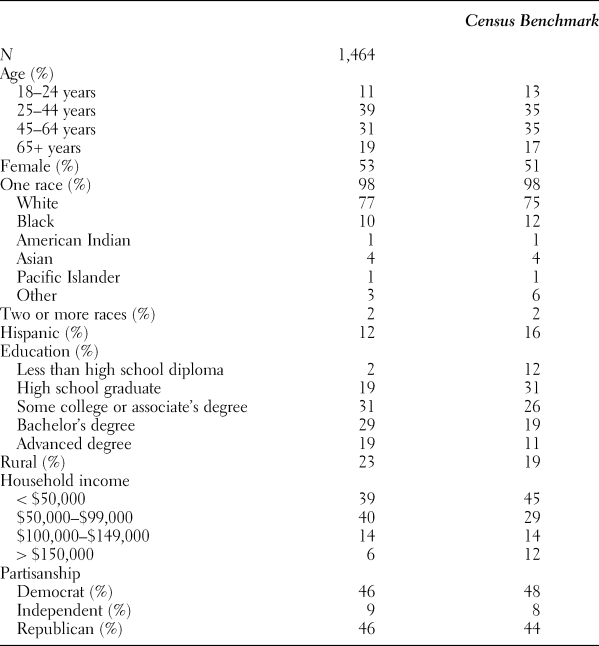
In June 2018, we fielded a randomized survey experiment on a diverse national sample of more than 1,400 U.S. citizens aged 18 and over through Survey Sampling International (SSI).Footnote 3 The SSI sample closely matches U.S. Census benchmarks: the sample has a median age of 45; 51% are women; 77% are white, 10% are Black, and 12% identify as Hispanic; and the modal education level is a bachelor's degree. Moreover, the sample included respondents from every state and Washington, D.C. Political party affiliation was well distributed, with 46% Democrats, 46% Republicans, and 9% independents (so-called leaners are categorized as partisans), resembling the national distributions found by the Pew Research Center (2018). Key demographic summaries are reported in Table 1.
SSI (national) sample descriptive statistics

Using images of comparable men and women politicians, we measured how voters reacted to a fictionalized short newspaper article delivered online about either a man or a woman politician. Each article included an image of the politician and referred to the politician with gendered language.Footnote 4 Treatments were randomized across politician gender, emotional reaction (anger or sadness), and policy domain (education or defense). Since the treatments were randomized and evenly distributed, the analyses here pool the treatments and include treatment controls when appropriate.Footnote 5 Following exposure to the newspaper article, respondents were asked to evaluate the politician's favorability, competence, perceived partisanship, and several qualities including strong leadership, intelligence, compassion, and sincerity, on a scale of 1–5, with 5 as the most positive assessment.Footnote 6
Despite no explicit mention of partisanship, we asked respondents which party they thought the politician belonged to. The decision to exclude explicit mentions of partisanship was deliberate; since researchers have established that partisanship typically trumps gender, we sought to evaluate and leverage the degree to which politician gender may alter perceptions of partisanship. In other words, research has shown that citizens will make inferences based on what they believe to be most relevant to or diagnostic of the task at hand. For example, a woman politician addressing defense policy might be perceived as more ideologically conservative than a woman politician addressing education, yet she might also be perceived as more liberal than a man politician addressing the same topic. Indeed, prior research has found that white citizens perceive Black candidates as more liberal than ideologically identical white candidates, and these misperceptions indirectly influence vote choice (Jacobsmeier Reference Jacobsmeier2015). We will return to this rationale later in the article. After finding consistently higher marks for women politicians across treatments, this article focuses on potential explanations for that observation.
UNDERSTANDING AND EXPLAINING THE PREFERENCE FOR WOMEN POLITICIANS
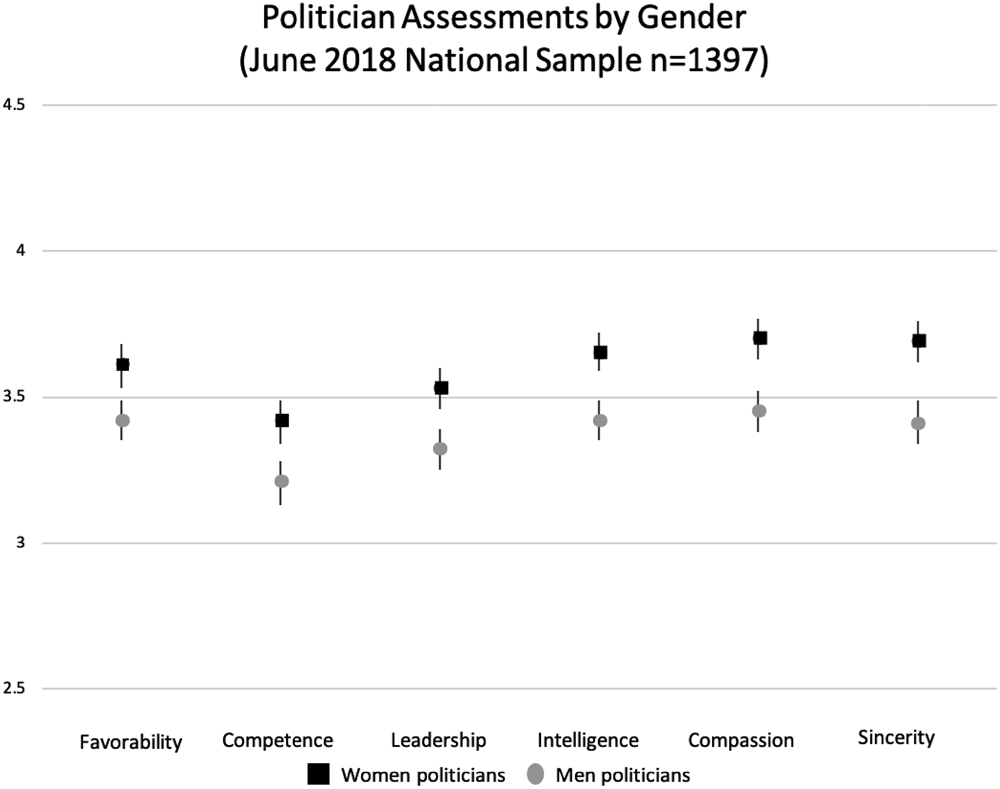
Like others, we find clear evidence that assessments of politicians’ general favorability, competence, leadership, intelligence, compassion, and sincerity are significantly higher for women than for men politicians in contemporary politics.Footnote 7 Figure 1 shows the overall assessments of men and women politicians across various types of evaluations, with 95% confidence intervals for each.
Politician assessments by gender (June 2018 national sample, n = 1,397)

Why are women repeatedly besting men in these political assessments? Indeed, we recognize that the timing of the survey undoubtedly plays a role, yet our result is not unique, as the discipline has increasingly noted positive results for women politicians. Importantly, for some of these traditionally feminine characteristics, such as compassion and sincerity, women have been rated higher than men for some time (see Alexander and Andersen Reference Alexander and Andersen1993). Yet on measures of favorability, competence, leadership, and intelligence, either men have done better than women, or men and women politicians have been assessed similarly until very recently. We find an across-the-board significant difference in favor of women across all categories, which is a departure from past research and corroborates much of the contemporary research being produced now.
What factors or characteristics explain the differences in these evaluations? In what follows, we leverage our experimental design and additional data collected during our survey to put forward a set of possible explanations why we observe greater marks for women over men politicians. We posit two explanations based on respondent characteristics and two based on partisanship. Because of the randomization of the experiment, testing individual hypotheses is relatively straightforward. After exploring each theoretical expectation on its own, we then directly compare the competing explanations for the higher ratings for women over men politicians.
Women Supporting Women
In 2018 in particular, there was no shortage of media coverage arguing that the women-led resistance movement had a strong impact on the nomination and potential election of women (Gambino Reference Gambino2018; Kurtzleben Reference Kurtzleben2018). In a CBS poll fielded six months before our survey, women were far more likely than men to say that the country would be better off if more women served in elected office (De Pinto Reference De Pinto2019). Previous academic research also lends support to this theory. In 1992, when women began to run for office at higher rates, researchers found that among all partisans—but especially within the Democratic Party—voter sex was significantly related to vote choice, with women tending to vote for women candidates more than men (Dolan Reference Dolan1997, Reference Dolan1998; Plutzer and Zipp Reference Plutzer and Zipp1996). Increased numbers of women in public office also inspired adolescent women to consider greater political involvement (Campbell and Wolbrecht Reference Campbell and Wolbrecht2006). Sometimes gender affinity can even break the pulls of partisanship. In instances when a woman Democrat runs against a man Republican, women who are generally Republican voters have shown a slight shift toward women candidates (Brians Reference Brians2005). For judicial nominees, Badas and Stauffer (Reference Badas and Stauffer2018) find that shared gender identity mediates the effect of being ideologically distanced on the decision to support a nominee.
Some research has shown that when women's issues are made more salient, we can expect greater same-gender affinity among women voters (Koch Reference Koch1997). Thus, the post–2016 election period and the 2018 campaigns featuring women and women's issues might be a particularly ripe time to expect that women respondents would account for the boost in women politicians’ assessments. Thus,
H1 Women respondents rate women politicians higher than men politicians.
Younger Respondents Supporting Women
When women started to enter U.S. politics in greater numbers, research found that younger voters made up some of the core support for women candidates (Welch and Sigelman Reference Welch and Sigelman1982). In the first “Year of the Woman,” analyses found that younger voters showed greater support for women than older voters, all else being equal (Dolan Reference Dolan1998). If younger voters are more enthusiastic about women, and if these respondents give women overwhelmingly positive assessments, that might account for the overall favorability marks we observe in 2018. Additionally, in explicitly political realms, older voters generally hold stronger gender stereotypes than younger voters (Dolan Reference Dolan2014). Thus, we might expect to observe greater favorability for women candidates among younger respondents, as generational shifts in attitudes suggest they are less prone to draw on potentially detrimental stereotypes. Thus,
H2 Younger respondents rate women politicians higher than men politicians more so than older respondents.
Democrats Supporting Women
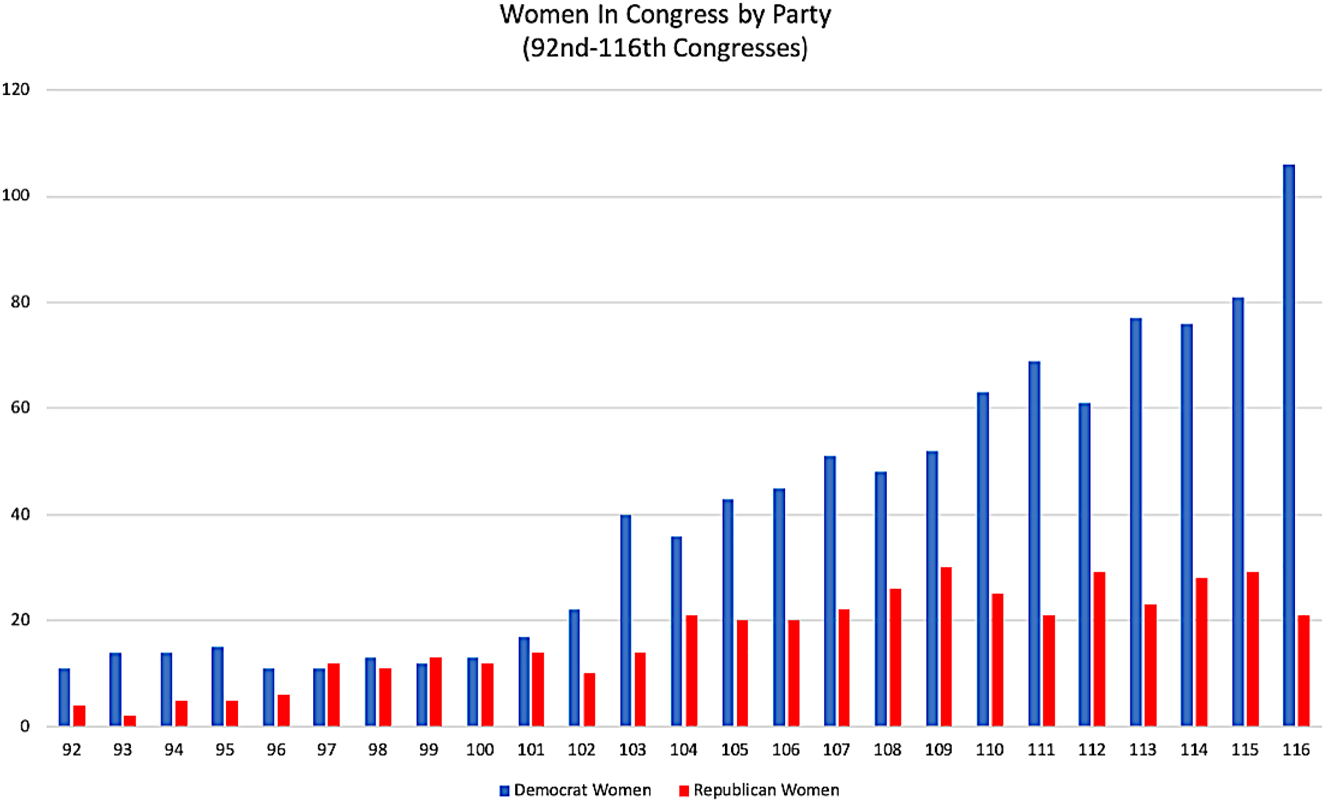
The Democratic Party has a history of electing more women politicians than the Republican Party. From the 1970s onward, Democratic women have outnumbered Republican women in Congress for all but four years. This partisan difference has increased over the past 20 years in a marked way. Figure 2 shows the number of Republican and Democratic women elected to the House and Senate from the 92nd Congress (1971–73) to the 116th Congress (2019–21).
Women in Congress by party (92nd–116th Congresses)

Both Democratic Party elites and voters show greater preferences for women politicians compared with Republicans when looking at election results. There is also a greater supply of women candidates who desire to run as Democrats than Republicans (Crowder-Meyer and Lauderdale Reference Crowder-Meyer and Lauderdale2014). In the past, even when the partisanship of the candidate did not align with that of Democratic voters, Democratic voters tended to trust women candidates and view them as more qualified than men (King and Matland Reference King and Matland2003). However, the more recent extreme polarization may make findings such as these less applicable in contemporary politics.
Lastly, all else being equal, voters tend to think that female candidates are more liberal or Democratic leaning than men (Koch Reference Koch2000, Reference Koch2002). Assuming that people prefer politicians who hold ideological viewpoints close to their own, the greatest boost to women candidates may come from Democratic respondents showing outsized preferences for women candidates.Footnote 8 Thus,
H3 Democratic respondents (compared with independents or Republicans) rate women politicians higher than men politicians.
Our final hypothesis posits an explanation that relies on respondent assumptions about politicians. While there were no references to partisanship in our treatments, we asked respondents to guess the partisanship of the politician after they provided assessments on favorability, sincerity, and some additional attributes. With empirical reality as a guide, a guess that the woman was a Democrat is reasonable, as people rely on the most narrowly relevant information available when constructing an attitude or opinion in the absence of other information (Crawford et al. Reference Crawford, Jussim, Madon, Cain and Stevens2011; Karl and Ryan Reference Karl and Ryan2016). Thus, in a political setting, assuming a woman of unknown partisanship is a Democrat is understandable.
However, research indicates that people generally assume—sometimes incorrectly—that others people they encounter or assess share characteristics similar to their own (Mathison Reference Mathison1988; Thielmann, Hilbig, and Zettler Reference Thielmann, Hilbig and Zettler2020). The false consensus effect (Ross, Greene, and House Reference Ross, Greene and House1977), whereby individuals project their own opinions onto others, is more common when the other is a woman. In particular, men, more so than women, are more likely to assume that a woman shares the same impression that the man has (Lenton et al. Reference Lenton, Bryan, Hastie and Fischer2007). Some research has also found that those with conservative ideological viewpoints tend to falsely project their own views onto others more often than liberals (Rabinowitz et al. Reference Rabinowitz, Latella, Stern and Jost2016), as do those who score higher on social dominance and authoritarianism batteries (Strube and Rahimi Reference Strube and Rahimi2006).
Partisanship tends to trump gender in political preference formation, but the intricacies of how stereotyping and expectations play out is complicated; when partisanship and gender are explicitly appealed to, Democrats and Republicans value different sorts of cues in particular ways (Bauer Reference Bauer2018). However, our expectation precedes this sort of dual stereotype conundrum, and it is a bit simpler on its face. If people in general have a tendency to project their opinions onto others, and if this tendency is enhanced when the other in question is a woman, there is reason to believe that one's own partisanship may be more likely to be projected onto the politician when she is a woman, and one's evaluation, in turn, would be more favorable overall. However, another potential pathway by which partisan projection would lead to higher marks for women politicians is dependent on the patterns of projection for Democratic and Republican respondents. If Democratic respondents presume that women share their partisanship because women in politics tend to Democrats and Republican respondents presume that women share their partisanship because those with conservative ideological outlooks—which overlaps with Republican partisanship—tend to project their own beliefs onto other more often, women politicians ought to be the overall benefactors of any presumed shared partisan bumps. For our final hypothesis, we test whether women and men politicians have respondent partisanship projected onto them, and whether the same respondent-politician partisan projection is related to greater favorability.
H4 Voters are more likely to presume that women politicians share their own party identity and therefore are more supportive of women candidates.
ANALYSES AND RESULTS
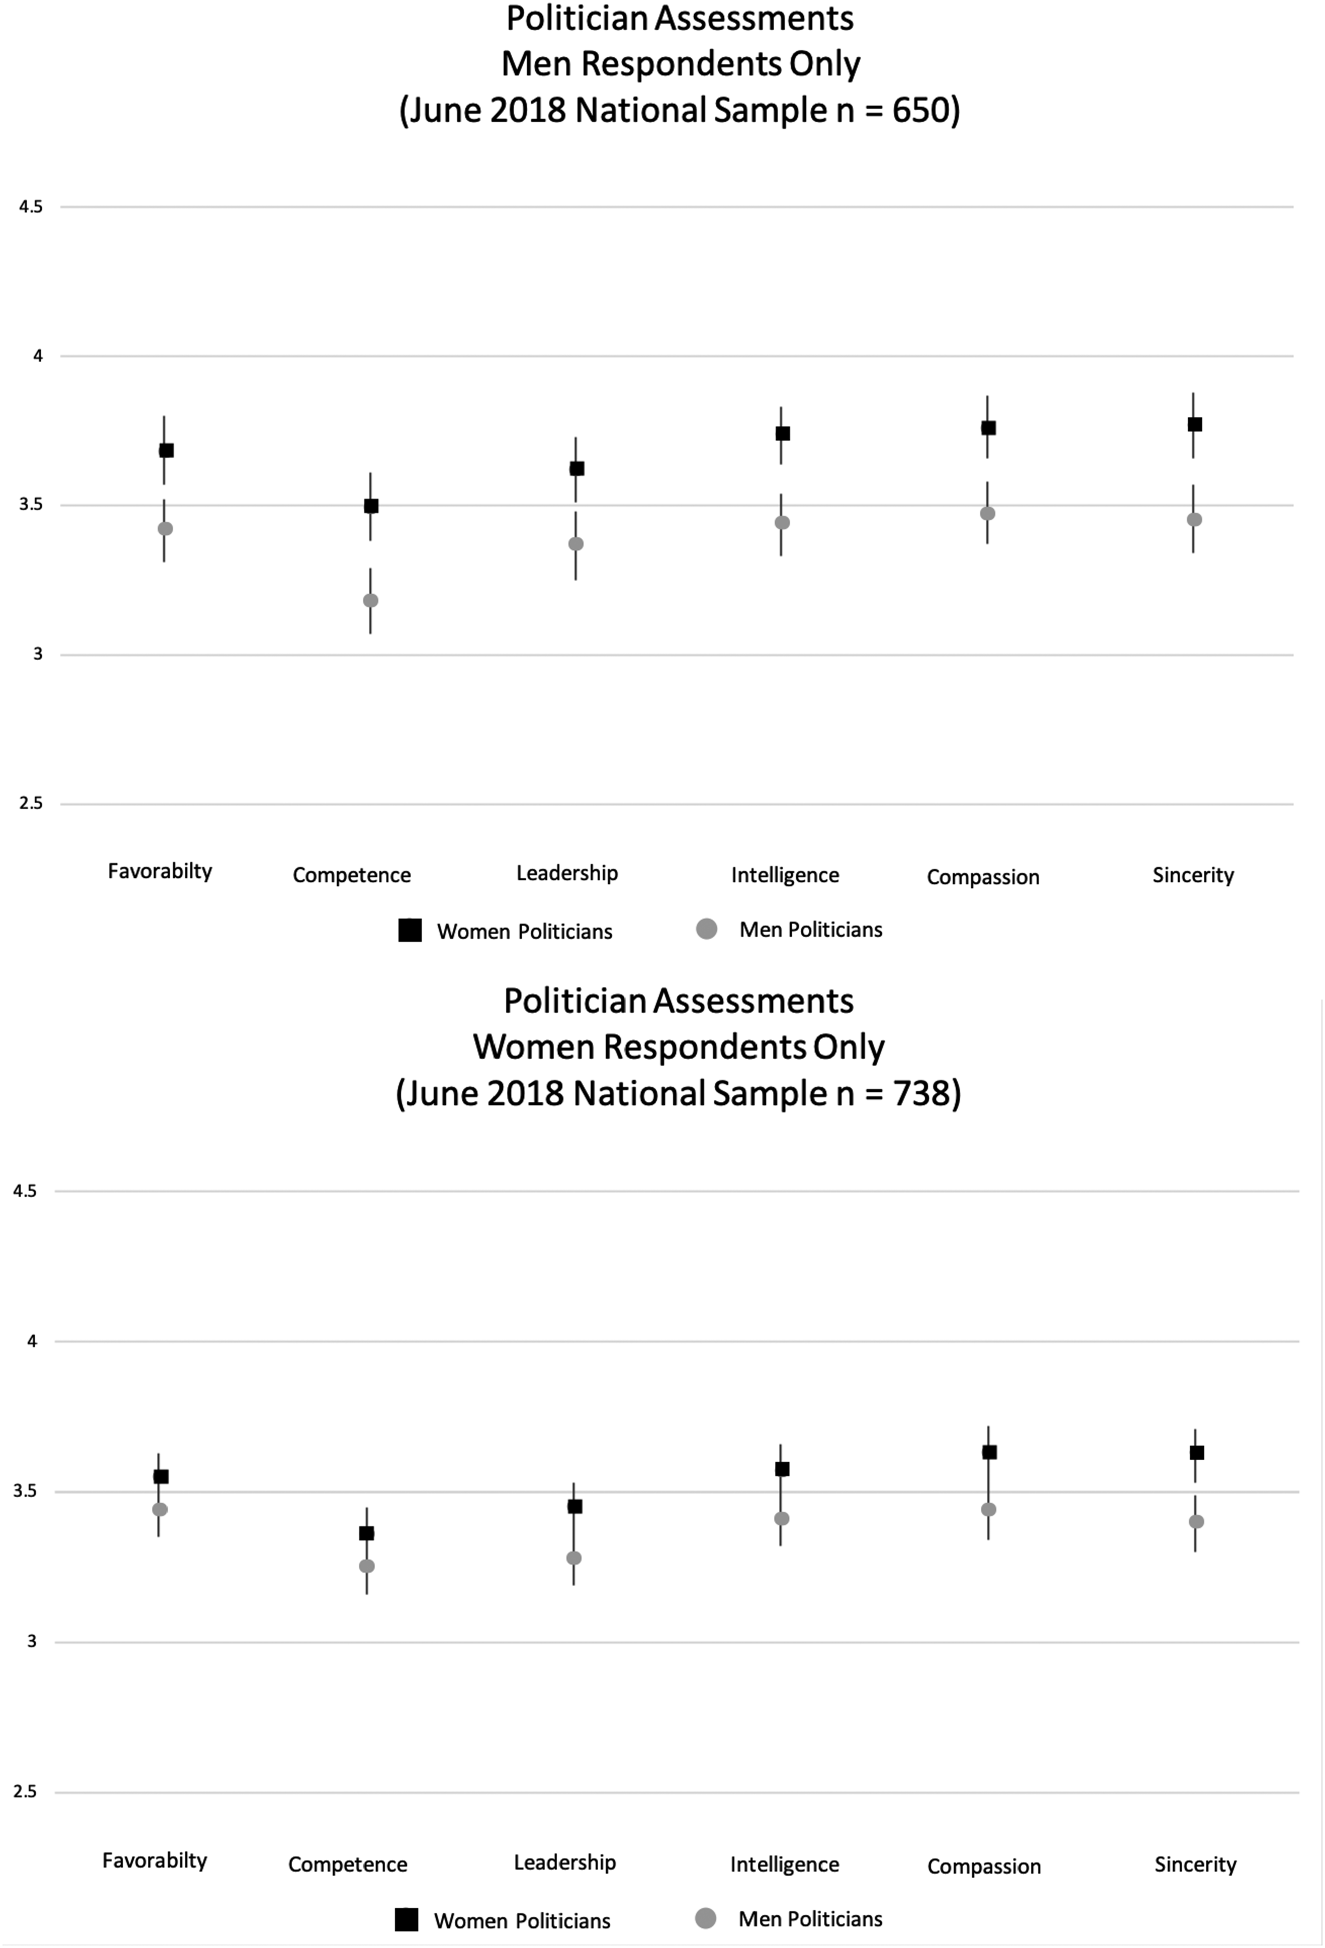
Recall that when examining differences of means across various assessments, respondents evaluated women politicians more favorably than men (Figure 1). However, when breaking out these assessments by respondent gender, the evaluative differences between men and women politicians are much more pronounced among men respondents. Figure 3 displays the assessments of men and women politicians by respondent sex. On average, men respondents gave significantly more preferential assessments to women politicians in every outcome category, whereas women respondents thought men and women politicians were equally favorable and competent, and women politicians were only slightly preferred on the measures of leadership, intelligence, compassion, and sincerity. Thus, our first cut at group averages does not support the hypothesis that same-gender affinity drives the result of greater overall support for women politicians.
(a) Politician assessments, men respondents only (June 2018 national sample, n = 650). (b) Politician assessments, women respondents only (June 2018 national sample, n = 738).

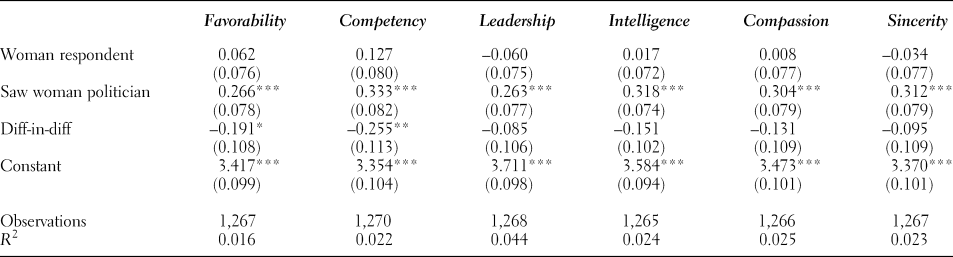
As a more precise test of H1, we estimated difference-in-difference scores for each dependent measure. This estimation allows men and women respondents to vary in baseline evaluations and examines the magnitude of the treatment effect (shifting from a man to a woman politician) among each gender, and then compares the size of the shift across respondent gender. For four of the six dependent measures, men and women respondents are not significantly different in the degree to which their evaluations of politicians change based on the politician's gender; for the remaining two measures (favorability and competency), the magnitude of the shift in evaluations is significantly smaller among women than men respondents (see Table 2).
Difference-in-difference estimations across respondent sex

Notes: All models include controls for respondent age, respondent partisanship, and treatment condition. Means and standard errors are estimated by linear regression.
*** p < .01; ** p < .05; * p < .1.
Again, H1 is not supported: men and women respondents either evaluated women politicians more favorably to a similar degree as men politicians, or men respondents did so to a significantly greater degree than women respondents.
Performing similar difference of means analyses across age categories, we again find no support for H2. Instead, older respondents tended to rate women politicians more highly than men politicians, on average, whereas younger respondents tended to rate women and men politicians equally. Full results are similar for all outcome assessment measures, and thus they are omitted in the interest of space but are available upon request.
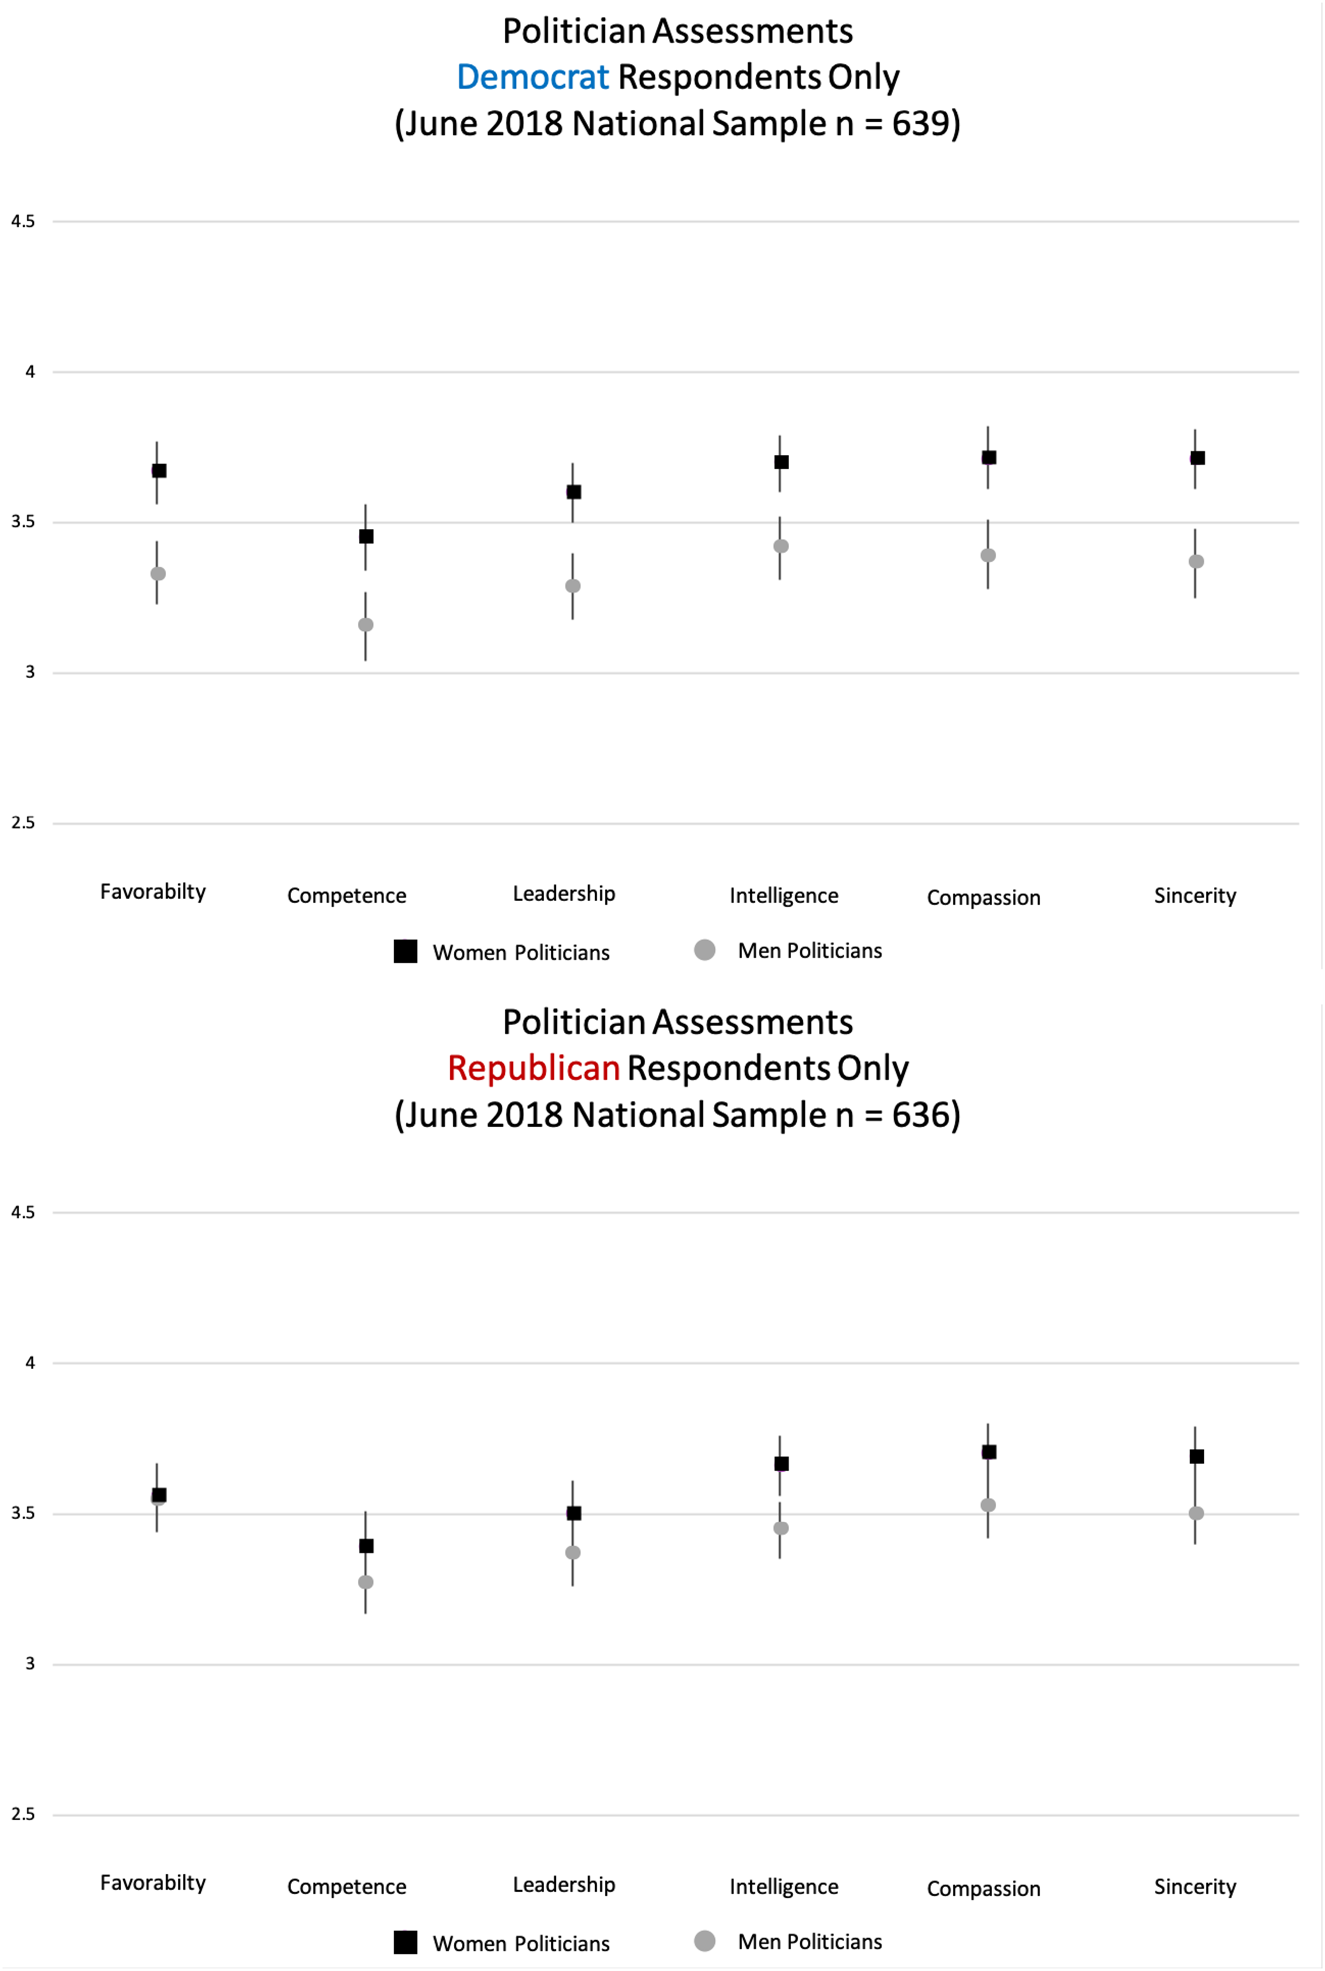
To examine H3, that Democrats give women politicians higher marks than Republican respondents, we begin by breaking the sample down into partisan categories and then perform the same difference in means calculations (see Figure 4).Footnote 9
(a) Politician assessments, Democratic respondents only (June 2018 national sample, n = 639). (b) Politician assessments, Republican respondents only (June 2018 national sample, n = 636).

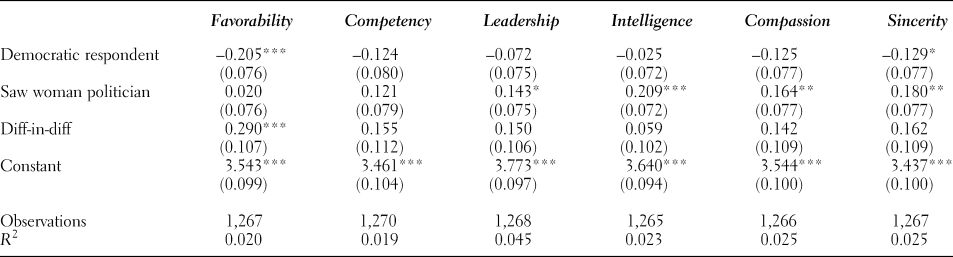
We find that Democratic respondents gave women politicians significantly higher assessments across all categories, on average. Among Republican respondents, we only find significant differences in respondents’ assessments of women politicians’ intelligence, compassion, and sincerity. As with the analyses for respondent gender, we turn to difference-in-difference estimations for each dependent measure. This more precise test of H3 reveals that the difference between the magnitude of the treatment effects (i.e., the increase in assessment when moving from a man to a woman politician) across partisanship is only significant for evaluations of favorability (see Table 3).
Difference-in-difference estimations across respondent partisanship

Note: All models include controls for respondent age, respondent partisanship, and treatment condition. Means and standard errors are estimated by linear regression.
*** p < .01; ** p < .05; * p < 0.1.
In other words, Democrats are significantly different from Republicans in the degree to which they prefer women politicians in terms of overall favorability, but the degree of preference is not significantly different in all other assessments. Interestingly, in no assessment category did men politicians perform better than women.
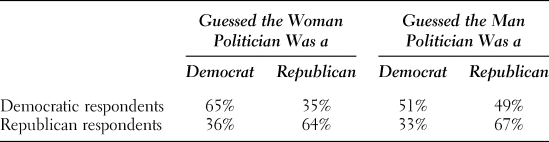
To assess our partisan projection hypothesis, we first consider what sort of presumptions respondents displayed. After evaluating the politician, we asked respondents whether they could guess which party the politician belonged to. For this analysis, we only kept the respondents who identified as Democrats or Republicans, to leverage same-party preferences. Most respondents (75%) presumed the politicians to be members of a major party. Table 4 shows the breakdown of respondent presumptions of partisanship for women and men politicians.
Respondent projection of partisanship onto politicians by respondent and politician type

As is shown, same-party presumptions are not evenly distributed among partisans. On average, Democrats who saw a woman politician thought she, too, was a Democrat, but those who saw a man thought he was nearly equally likely to be a Republican or a Democrat. For Republican respondents however, a majority of respondents presumed that both men and women politicians were also Republicans. Even though, empirically, women politicians at the federal and state levels are much more likely to be Democrats, Republican respondents tended to think the men and women they saw were equally likely to share their own partisanship. This does not appear to be attributable to an information gap; in our sample, Democratic and Republican respondents rank themselves as similar on a political interest scale, hold similar levels of education, and report consuming similar amounts of media. While curious, this result supports other work finding that those who are politically conservative have greater tendencies to project consensus than liberals (Stern et al. Reference Stern, West, Jost and Rule2014). Partisan projection is an issue of similarity, and thus finding that Republican respondents are more likely to project their partisanship may be rooted in an attitude like assumptive consensus.
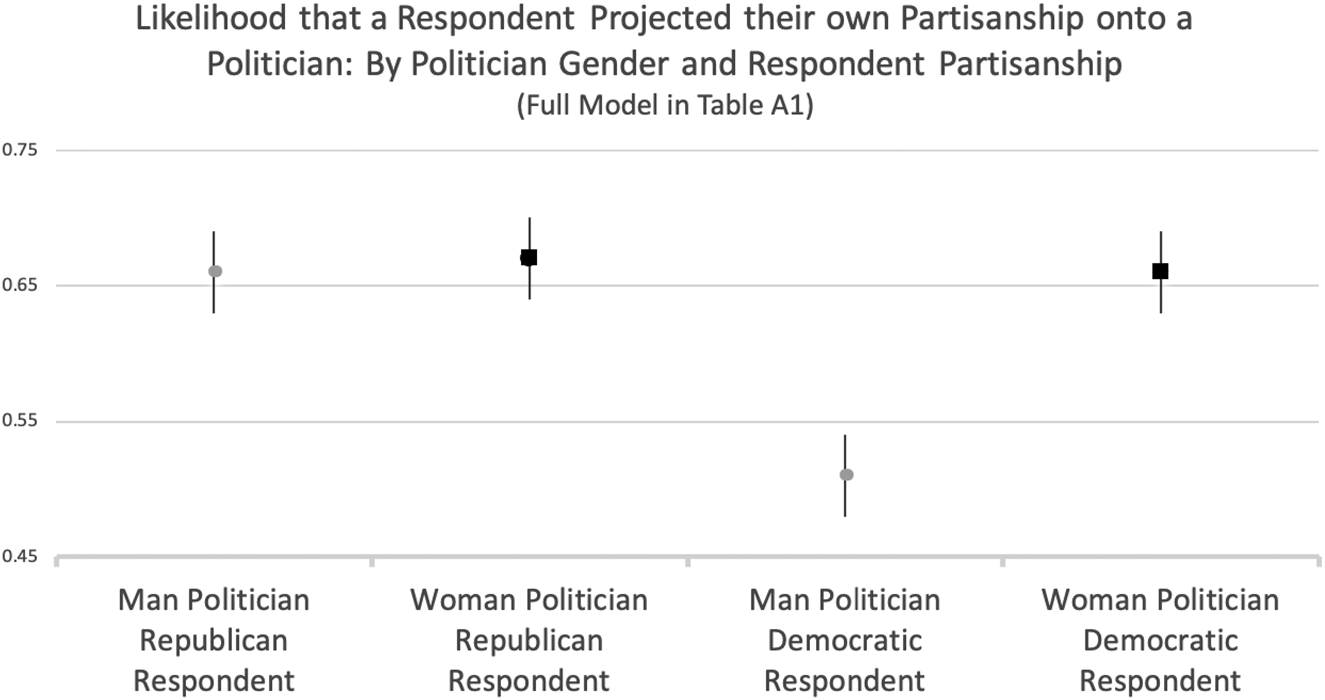
What relationships do gender, age, and partisanship of the respondent exhibit with partisan projection? Using the explanatory variables from the foregoing potential explanations, we model the likelihood that respondents presumed the politician in question shared political party affiliation. We find that both partisanship and exposure to a woman politician are related to projection, but this effect is different for Democratic and Republican respondents. We also find that as age increases, respondents are slightly less likely to assume that a politician shares their party identification. The full table of results is presented in Table A1 the appendix (in the supplementary material online), and in Figure 5 we present the marginal effects describing how the projection of co-partisanship varies by respondent partisanship and the sex of the politician.
Likelihood that a respondent projected their own partisanship onto a politician: by politician gender and respondent partisanship. The full model is presented in Table A1 in the appendix.

As indicated, among Democratic respondents, seeing a woman politician (versus a man politician) significantly increased respondents’ presumption that partisanship was shared with the respondent. Republican respondents tended see both men and women politicians as Republicans in the first place. Recall our expectation that partisan projection might happen slightly more often to women politicians. We find mixed support for this, as Republican respondents are equally likely (about 65% of the time) to project their partisanship onto both men and women politicians. Alternatively, Democrats are more likely (about 65% of the time) to project their partisanship onto women politicians, yet they only project their partisanship on men politicians at the rate of chance (about 50% of the time). In other words, Democrats are less likely to perceive men politicians as co-partisans.Footnote 10 Among Republicans, this could be taken as evidence of greater partisan projection onto women, as, empirically, women politicians tend to be Democrats, or as evidence of a greater presumptive tendency in conservative respondents.
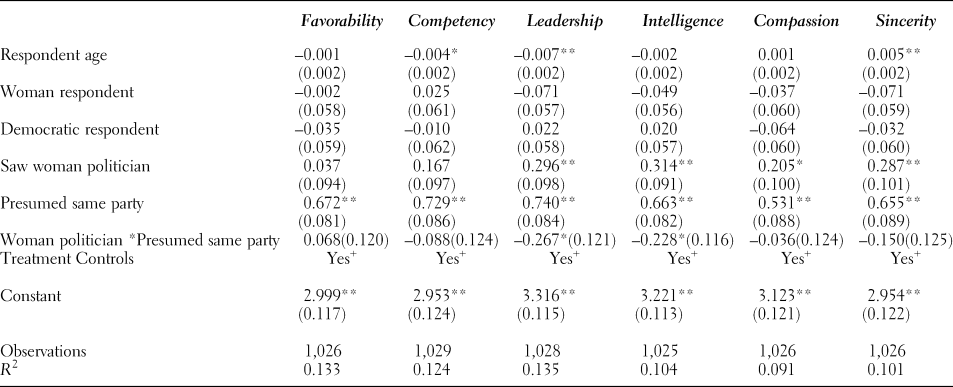
Do respondents who project their partisanship onto the politician view the politician more favorably? Yes, and, as in most previous scholarship, both Democratic and Republican respondents weigh perceived partisanship more heavily than observed gender in their evaluations. As a way to evaluate each of the potential explanations together, we model politician assessments as a function of the gender and partisanship of the respondent, the gender of the politician, an indicator perceived co-partisanship, and an interaction between the gender of the politician and the indicator of co-partisan presumption. The interaction term suggests that the impact of a politician's gender on how they are assessed may depend on their perceived partisanship (see Table 5).
Politician assessment by respondent characteristics, party presumption and politician sex (ordinary least squares)

Note: Robust standard errors.
** p < .01; * p < .05.
Overall, the partisanship of the politician—even if it is just a guess—dominates these assessments and is significantly linked to every outcome measure by a magnitude of at least double that of the politician's gender. Consistent with previous research, we find that people presume partisanship, even in the absence of explicit cues, and those perceptions account for much of their evaluations. We also find that gender affects presumed partisanship, at least for some respondents. Yet partisanship is not the whole story; while the effects of seeing a man or woman politician are smaller in size, this is not surprising considering the dominant role of party identification in American politics. Specifically, being exposed to a woman politician is associated with significantly higher evaluations of leadership, intelligence, compassion, and sincerity. Thus, the significant impact of gender in four (of six) evaluations despite the outsized influence of partisanship is striking.
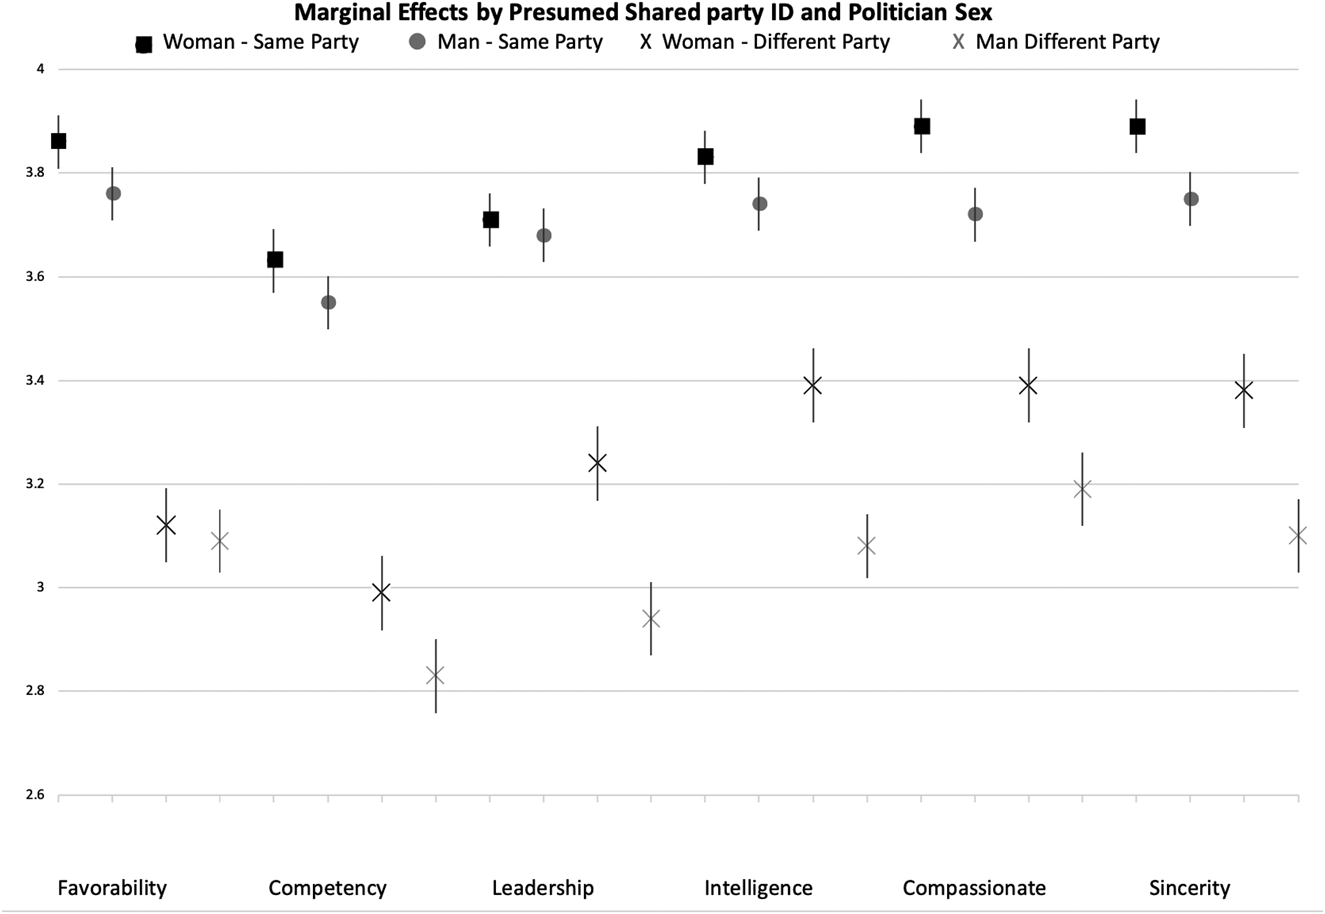
Notably, however, gender and partisanship play complicating roles in each of these cases. Favorability and competency are the only candidate qualities that appear strictly related to presumed same partisanship, with no greater assessments for women. We turn to the potential for differential support “bumps” for either men or women politicians and/or politicians who are presumed to be of the same party as the respondent. First, assessments of feminine qualities (i.e.,compassion and sincerity) demonstrate that women politicians are evaluated significantly higher than men politicians regardless of whether the politician is presumed to be of the same or different partisanship. In other words, when asked about perceptions of compassion and sincerity, politicians who are perceived as co-partisans are rated significantly higher relative to out-partisans, but among presumed co-partisans and among out-partisans as well, women politicians are evaluated significantly higher than men politicians (see Figure 6).
Marginal effects by presumed shared party ID and politician sex.

Turning to assessments of leadership and intelligence, the significant interaction term in Table 5 indicates that men and women politicians are evaluated differently based on their perceived partisanship. Specifically, politicians who are presumed to be co-partisans with the respondent are significantly preferred over out-partisans, and politician gender does not impact the degree of this preference. Yet the gender of the politician does differentially impact assessments of out-partisans on these two measures: women who are presumed to be out-partisans are evaluated significantly higher than men who are also presumed to be out-partisans. Going further, this higher out-partisan assessment for women is true across five of the six assessment categories, excluding favorability.
Considered together, we find that higher evaluations of women politicians appear to be explained by an overall Democratic preference for women and the sizeable influence of presumed partisanship, which Republicans tend to extend equally to men and women. Explanations relating to the characteristics of respondents, such as their own gender or age, find no support in our analyses. Interestingly, the assessments of overall favorability and competence—once other factors are controlled for—are no longer significantly higher for women politicians; rather, people tend to view men and women politicians equally on these outcomes. In the discussion, we consider the context of our survey experiment, interpretations of the results, and what to anticipate from future research.
DISCUSSION
Recent experimental and survey research finds greater support for women politicians than ever before, and we, too, find similar results. However, consistent with many other lines of research, partisanship tends to be the most important determinant of how people evaluate political actors. The results of our study suggest that even in the absence of explicit partisan cues, many people presume a politician's partisanship, and those perceptions are significantly related to evaluations. While Democrats and Republicans prefer members of their own party, there are differences in the types of respondents who project their own partisanship onto others and how partisans assess men and women presumed to be members of the other party. Presumed co-partisans, whether they be men or women, are generally preferred by respondents, and presumed co-partisanship was the key force related to favorability. However, even controlling for presumed co-partisanship, women were given higher marks than men for competency, leadership, intelligence, compassion, and sincerity.
Democratic respondents in our study presumed partisanship differentially by the gender of the politician. Those who saw a woman were slightly more likely to think that she was a Democrat, and those who saw a man were equally likely to presume that he was a Democrat or a Republican. Democratic respondents who guessed that politicians were Republicans still rated women significantly higher than men on competency and leadership. Thus, while presuming shared partisanship positively influences assessments, men and women stand to gain equally, and, coupled with the underlying pro-woman preferences among respondent partisans, the preference bump for women politicians persists.
For Republican respondents, the story is one of stronger partisanship. Whether presented with a man or a woman, majorities of Republican respondents were apt to presume politicians shared their partisan identification, and in accordance with that presumption, were assessed more favorably. Despite the fact that women in elected office are more often Democrats, nearly 70% of Republican respondents guessed that women politicians were also Republicans. When Republicans presumed the politicians were Democrats, there is no significant difference in their evaluations of men or women politicians. Thus, since Republicans more often assumed that women were also Republicans, the preferences that co-partisans extend to one another are conferred to more women overall. The phenomenon of party projection and our findings that women were more often projected to share partisanship with respondents—despite women more often being Democrats in politics—suggests a fruitful avenue of future research.
Using comparable men and women politicians, we find that our sample of U.S. respondents show significantly higher assessments for women. This is not a small or fragile result. Collectively, and in every treatment condition individually, respondents found women politicians to be significantly more favorable, more competent, more apt to exhibit leadership, more intelligent, more compassionate, and sincerer than men. Like other contemporary scholars, there is evidence that times and attitudes are changing in ways that likely benefit women political aspirants.
More broadly, however, the summer of 2018 offered a unique backdrop for women in politics. The charged #MeToo movement highlighting the difficulties women routinely face at the hands of men cast a gendered hue on much of the media coverage for a variety of topics. In coverage of candidate recruitment for the midterm elections, gender was particularly salient, as was the idea of new candidates with a fresh start (Dovere Reference Dovere2017; Merica and Grayer Reference Merica and Grayer2018). The press coverage of the 2018 midterms contextualizes our results in ways that make these findings more understandable. The fresh memory of the 2016 election may also have allowed the generic politicians used in the experiments to be placeholders for the most recognized politicians at the time, Hillary Clinton and Donald Trump. The overall positive ratings for women over men for outcomes such as competency, intelligence, and compassion may signal that voters had the two previous candidates in mind as references when thinking about political matters. Work done in future years without a highly salient, gender-differentiated election as a comparison for voters to mentally refer to may yield different outcomes.
These results should leave those seeking the inclusion of more women in politics hopeful. But support for women is not uniform, and partisanship still plays an outsized role. Women and younger people—theoretically more inclusive cohorts of voters—do not drive the bulk of these observed differences. Rather, it appears that Democrats tend to see the greatest differences in men and women candidates, and they prefer women candidates over men with the greatest margin. Republicans were partisans above all else, but when assuming co-partisanship, they also showed a preference for women politicians for outcomes such as intelligence and compassion. Future research could explore instances in which a person presumes the partisanship of a candidate and then is “corrected” to learn about the candidate's actual partisanship to see how first impressions generated based on individual presumption change in the context of additional information. Knowing that Republican respondents projected Republican partisanship onto men and women, would penalties be the same for both men and women who did not hold in fact that identity? More generally research into the prevalence of different sorts of presumption in political arenas seems ripe for research.
Despite women's successes in the 2018 midterms, a more important context to note is that of the 111 new members elected to Congress, only 42% were women. While this is the highest percentage of women ever elected in a new class, the overall composition of the Congress still lags behind a representative split. We maintain that these results do not signal the end of sexism in American politics, but may point to a shift from when women used to have a much steeper hill to climb to earn public acceptance. While our results indicate a change in some ways, they also confirm related research on the overwhelming importance of partisanship. Who says that the future could actually be female? Both politicians and voters have a role to play, and if more Republican women candidates ran for office, our results suggest that Republican voters would be amendable to giving them support, whereas Democrats will likely continue to show support for women politicians. The work of candidates combined with voter preferences will have the final say on empirical successes for women, but our results point to a budding preference for women that has the potential to bloom into a more representative set of political actors.
SUPPLEMENTARY MATERIAL
To view supplementary material for this article, please visit https://doi.org/10.1017/S1743923X2100012X