Introduction
Human alveolar echinococcosis (AE) is caused by the accidental ingestion of Echinococcus multilocularis eggs (Torgerson & Budke, Reference Torgerson and Budke2003), after which larvae predominantly form tumour-like tissue in the liver (Wen et al., Reference Wen, New and Craig1993). In Japan, E. multilocularis infection is prevalent in Hokkaido (Kimura et al., Reference Kimura, Furuya, Kawase, Sato, Yamano, Takahashi, Uraguchi, Ito, Yagi and Sato1999). Early detection is essential as surgical resection is the only treatment for a complete cure (Torgerson et al., Reference Torgerson, Schweiger, Deplazes, Pohar, Reichen, Ammann, Tarr, Halkik and Müllhaupt2008). Although preoperative diagnostic methods such as serodiagnosis and imaging techniques have progressed remarkably in recent years, the AE latent period is very long (Lightowlers et al., Reference Lightowlers, Mitchell, Rickard, Warren and Agabian1993), so it can take several years after infection for patients to be diagnosed. Therefore, outpatients who are not diagnosed at an early opportunity can present with considerably developed lesions.
In order to detect AE in Hokkaido, Japan, enzyme-linked immunosorbent assays (ELISA) (Sato et al., Reference Sato, Mitamura, Arai and Kumagai1983; Yamano et al., Reference Yamano, Hada, Yamamura, Takeda, Honma and Sawada2006, 2009b) and Western blotting (WB) (Furuya et al., Reference Furuya, Sato and Kumagai1987; Yamano et al., Reference Yamano, Goto, Nakamura-Uchiyama, Nawa, Hada and Takeda2009a, b) with crude antigens have been developed to achieve provisional confirmation prior to surgical treatment. ELISA is used in the primary screening step, and WB and ultrasound-based tests are used for secondary confirmation, with three diagnostic WB bands of 26–28, 18 and 7–8 kDa having been identified (Yamano et al., Reference Yamano, Yagi, Furuya, Sawada, Honma and Sato2005, Reference Yamano, Goto, Miyoshi, Furuya, Sawada and Sato2009b). Serodiagnosis enables observation of the declining immunoresponse in a postoperative follow-up and thus helps in the verification of the curative effect. However, it is difficult to observe the time course of the antibody response during the latent period. Although early detection is very important, the details regarding the changes in the antibody response in the initial stage after infection are unclear. Such information is very useful for serodiagnosis in the early stage.
For this reason, we carried out a long-term investigation into the time course of the antibody response before detection as ‘positive’ in a screening system. Among the markers for diagnoses, the 18 kDa band (main marker) appeared last in the preoperative stages and disappeared first after operation in a WB test. We also reproduced this phenomenon in rats. Rats with an excised lesion showed a similar change to human cases in the progression of the antibody response.
In this study, we observed, for the first time, changes in the antibody response during the relatively early stages of infection in human AE cases. These findings provide valuable information for future early detection of human AE cases.
Materials and methods
Experimental infection of rats with Echinococcus multilocularis
Male 6-week-old F344 rats, 135 ± 12 g (n= 8) were purchased from Sankyo Labo Service Corporation, Inc. (Tokyo, Japan) for use in E. multilocularis infection and as non-infected control rats. All rats were raised, housed and handled according to the regulations for animal experimentation at the Hokkaido Institute of Public Health (HIPH). They were acclimatized to an air-conditioned room for parasite-infected experimental animals (Biosafety level 3) in HIPH.
The parasite used in this study was a cloned E. multilocularis isolate maintained by serial passages (vegetative transfer) in cotton rats. All cotton rats were also handled according to animal experimentation regulations at HIPH. Metacestode tissue was obtained from an infected cotton rat by aseptic removal from the peritoneal cavity. After grinding the tissue through a sterile sieve, the sediment was washed three times with physiological saline including 500 IU/ml penicillin G and 1 mg/ml of streptomycin sulphate, and finally suspended at a 10% volume for injection. This homogenate was estimated to contain 1500 protoscoleces/ml. Six rats were anaesthetized by intraperitoneal injection of pentobarbital sodium solution, and were inoculated in the liver with 125 μl of the protoscolex homogenate. Two control rats were prepared by injecting 125 μl of physiological saline.
Collection of serum samples
Blood samples were collected from rat orbital veins under anaesthesia at suitable intervals. Separated serum was kept at − 30°C. Blood collection continued until 50 weeks after inoculation. Fifteen weeks after inoculation, three infected rats underwent surgical resection. The hepatic lesion was excised after ligation under anaesthesia (excised group: n= 3). The remaining three rats made up the non-excised group.
Human sera were collected and handled for the screening test, preoperative examination and postoperative follow-up according to the ethical regulations at HIPH. In each patient, a diagnosis of AE was confirmed by histopathological analysis after surgical resection (Condon et al., Reference Condon, Rausch and Wilson1988; Furuya et al., Reference Furuya, Sato, Kawanaka, Takahashi, Sawada, Honma and Tamura2001).
Antigen production
ELISA and WB were undertaken using crude antigens extracted from E. multilocularis protoscoleces. To prepare the antigens, protoscoleces were collected from cysts in the livers of cotton rats experimentally inoculated with E. multilocularis protoscoleces. The protoscoleces were repeatedly washed with phosphate-buffered saline (PBS, pH 7.4) and treated with 0.2% Triton X-100 in PBS. This solution was then centrifuged for 15 min at 1500 g, and the supernatant was dialysed against PBS for 24 h at 4°C to remove detergent. The total protein concentration of the antigen solution was set to 12 μg/ml in 0.05 m NaHCO3/Na2CO3 buffer at pH 9.6 for ELISA and in PBS for WB.
ELISA protocol
ELISA was performed using crude antigens extracted from E. multilocularis protoscoleces as previously described (Sato et al., Reference Sato, Mitamura, Arai and Kumagai1983) with some modifications (Yamano et al., Reference Yamano, Hada, Yamamura, Takeda, Honma and Sawada2006, Reference Yamano, Goto, Miyoshi, Furuya, Sawada and Sato2009b). Flat-bottomed microplates (No. 2580; Corning, New York, USA) were coated with crude antigens (100 μl/well) for 4 h at 37°C. After the coating solution was discarded, the microplates were blocked for 1 h at 37°C with 5% skimmed milk in PBS. Serum samples from human cases diluted 1:250 in 0.05% Tween–PBS (100 μl/well) were then added to the wells of the microplates and incubated overnight at 4°C. After washing with 0.05% Tween–PBS, 100 μl anti-human IgG alkaline phosphatase-conjugated antibody (A-3187; Sigma, St. Louis, Missouri, USA; 1:2500 in 0.05% Tween–PBS) was added, and the microplates were incubated for 4 h at 37°C. After further washing, bound antibodies were detected by the presence of a reaction for alkaline phosphatase on addition of p-nitrophenyl phosphate (0.1 mg/well) in 10% diethanolamine buffer (pH 9.8) following an incubation period of 8 min at 37°C (100 μl/well). The reaction was stopped with the addition of 50 μl 3 n NaOH, and the absorbance was read at 405 nm on a microplate reader (Model 680; BIORAD, Hercules, California, USA).
The ELISA value was defined as a relative value for the absorbance of serum from a human AE patient (positive control: absorbance = 1.00) (Sato et al., Reference Sato, Mitamura, Arai and Kumagai1983). The diagnostic criteria were settled as follows: ELISA value 0–0.50 = negative; 0.51–0.99 = quasi-positive; over 1.00 = positive.
In the case of rats, rat sera were diluted to 1:250 for ELISA in 0.05% Tween–PBS. Anti-rat IgG alkaline phosphatase-conjugated antibody (A-8438; Sigma; 1:1000 in 0.05% Tween–PBS) was used as the secondary antibody. All other conditions were the same as the human cases. The absorbance value was used for monitoring by ELISA.
WB test protocol
Sodium dodecyl sulphate (SDS)-polyacrylamide gel electrophoresis (PAGE) was performed utilizing an E. multilocularis crude antigen preparation according to the Laemmli method (Laemmli, Reference Laemmli1970). Antigens were separated electrophoretically on 15% SDS-PAGE, and were electroblotted on to a nitrocellulose membrane. The membrane was subsequently blocked in 5% skimmed milk in PBS for 1 h at room temperature (RT) and then incubated with patient sera (1:100 in PBS containing 0.05% Tween 20 and 5% skimmed milk) for 1.5 h at RT. After washing, the membrane was treated with anti-human IgG alkaline phosphatase-conjugated antibody (A-3187; Sigma), diluted at 1:2500 in 0.05% Tween–PBS for 1 h at RT. After further washing, the membrane was exposed to phosphatase substrate solution (5-bromo-4-chloro-3-indolyl-phosphate/nitroblue tetrazolium; PerkinElmer Life Sciences, Gaithersburg, Maryland, USA) for colour development.
In this study, three bands (26–28, 18 and 7–8 kDa) were investigated as diagnostic markers (Ito et al., Reference Ito, Nakao, Kutsumi, Lightowlers, Itoh and Sato1993, Reference Ito, Schantz and Wilson1995, Reference Ito, Sako, Yamasaki, Mamuti, Nakaya, Nakao and Ishikawa2003; Liance et al., Reference Liance, Janin, Bresson-Hadni, Vuitton, Houin and Piarroux2000; Yamano et al., Reference Yamano, Goto, Miyoshi, Furuya, Sawada and Sato2009b). Detection of only the 26–28 kDa band was regarded as ‘quasi-positive’ (Yamano et al., Reference Yamano, Goto, Miyoshi, Furuya, Sawada and Sato2009b). The 7–8 kDa band is usually accompanied by a band of approximately 12 kDa, which appears to be related to the Antigen B subunit (Leggatt et al., Reference Leggatt, Yang and McManus1992; de la Rue et al., Reference de la Rue, Yamano, Almeida, Iesbich, Fernandes, Goto, Kouguchi and Takahashi2010).
In the case of rats, rat sera were diluted to 1:100 for immunoblot analysis in 0.05% Tween–PBS. Anti-rat IgG alkaline phosphatase-conjugated antibody (A-8438; Sigma; 1:1000 in 0.05% Tween-PBS) was used as the secondary antibody. All other conditions were the same as the human cases.
Results
Antibody responses in human AE cases
Human AE postoperative stage
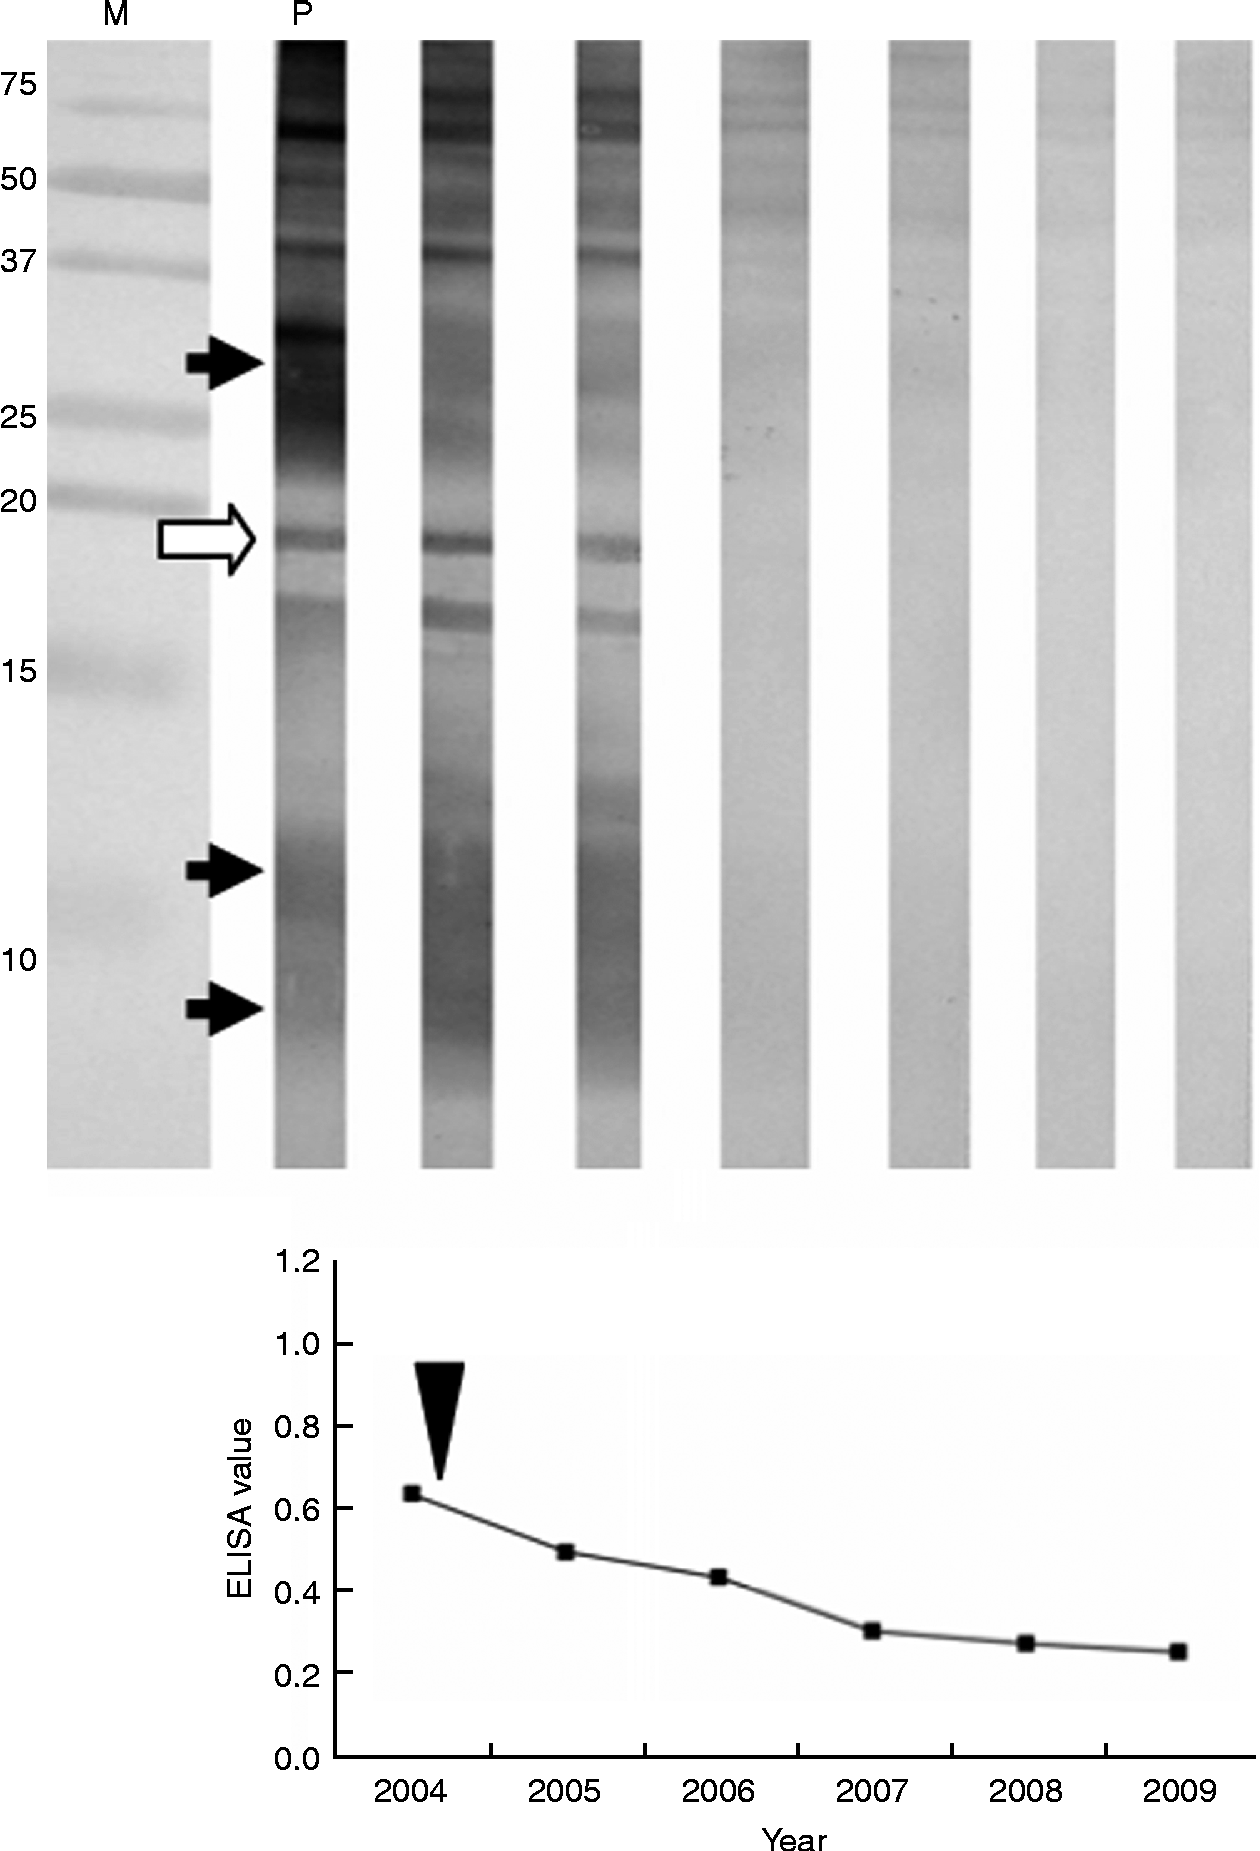
Case 1 showed a typical postoperative pattern (fig. 1). The patient was a 71-year-old Japanese woman who was positively detected using the Hokkaido screening system in 2004. Her ELISA test (ELISA value: 0.570) was within the quasi-positive range, while a WB test identified the presence of 26–28, 18 and 7–8 kDa bands. She was therefore judged to be positive. In several imaging tests, a phyma with calcification was identified. Therefore, the patient underwent resection of the phyma, and the AE diagnosis was confirmed following histopathological analysis. In the postoperative follow-up, her ELISA value dropped; the 18 kDa band had disappeared in a WB test in 2006 and the reaction of other antibodies was weakened. The patient's prognosis improved, and she has shown sero-negativity against E. multilocularis antigens since 2008.
Typical pattern of the postoperative stage of a human AE patient. Lanes: M, molecular weight size marker; P, positive control. Diagnostic bands are indicated by arrows: the open arrow shows the main marker (18 kDa) for diagnosis. The year of surgical operation is indicated by the arrowhead.

Preoperative patterns monitored until ‘positive’ detection
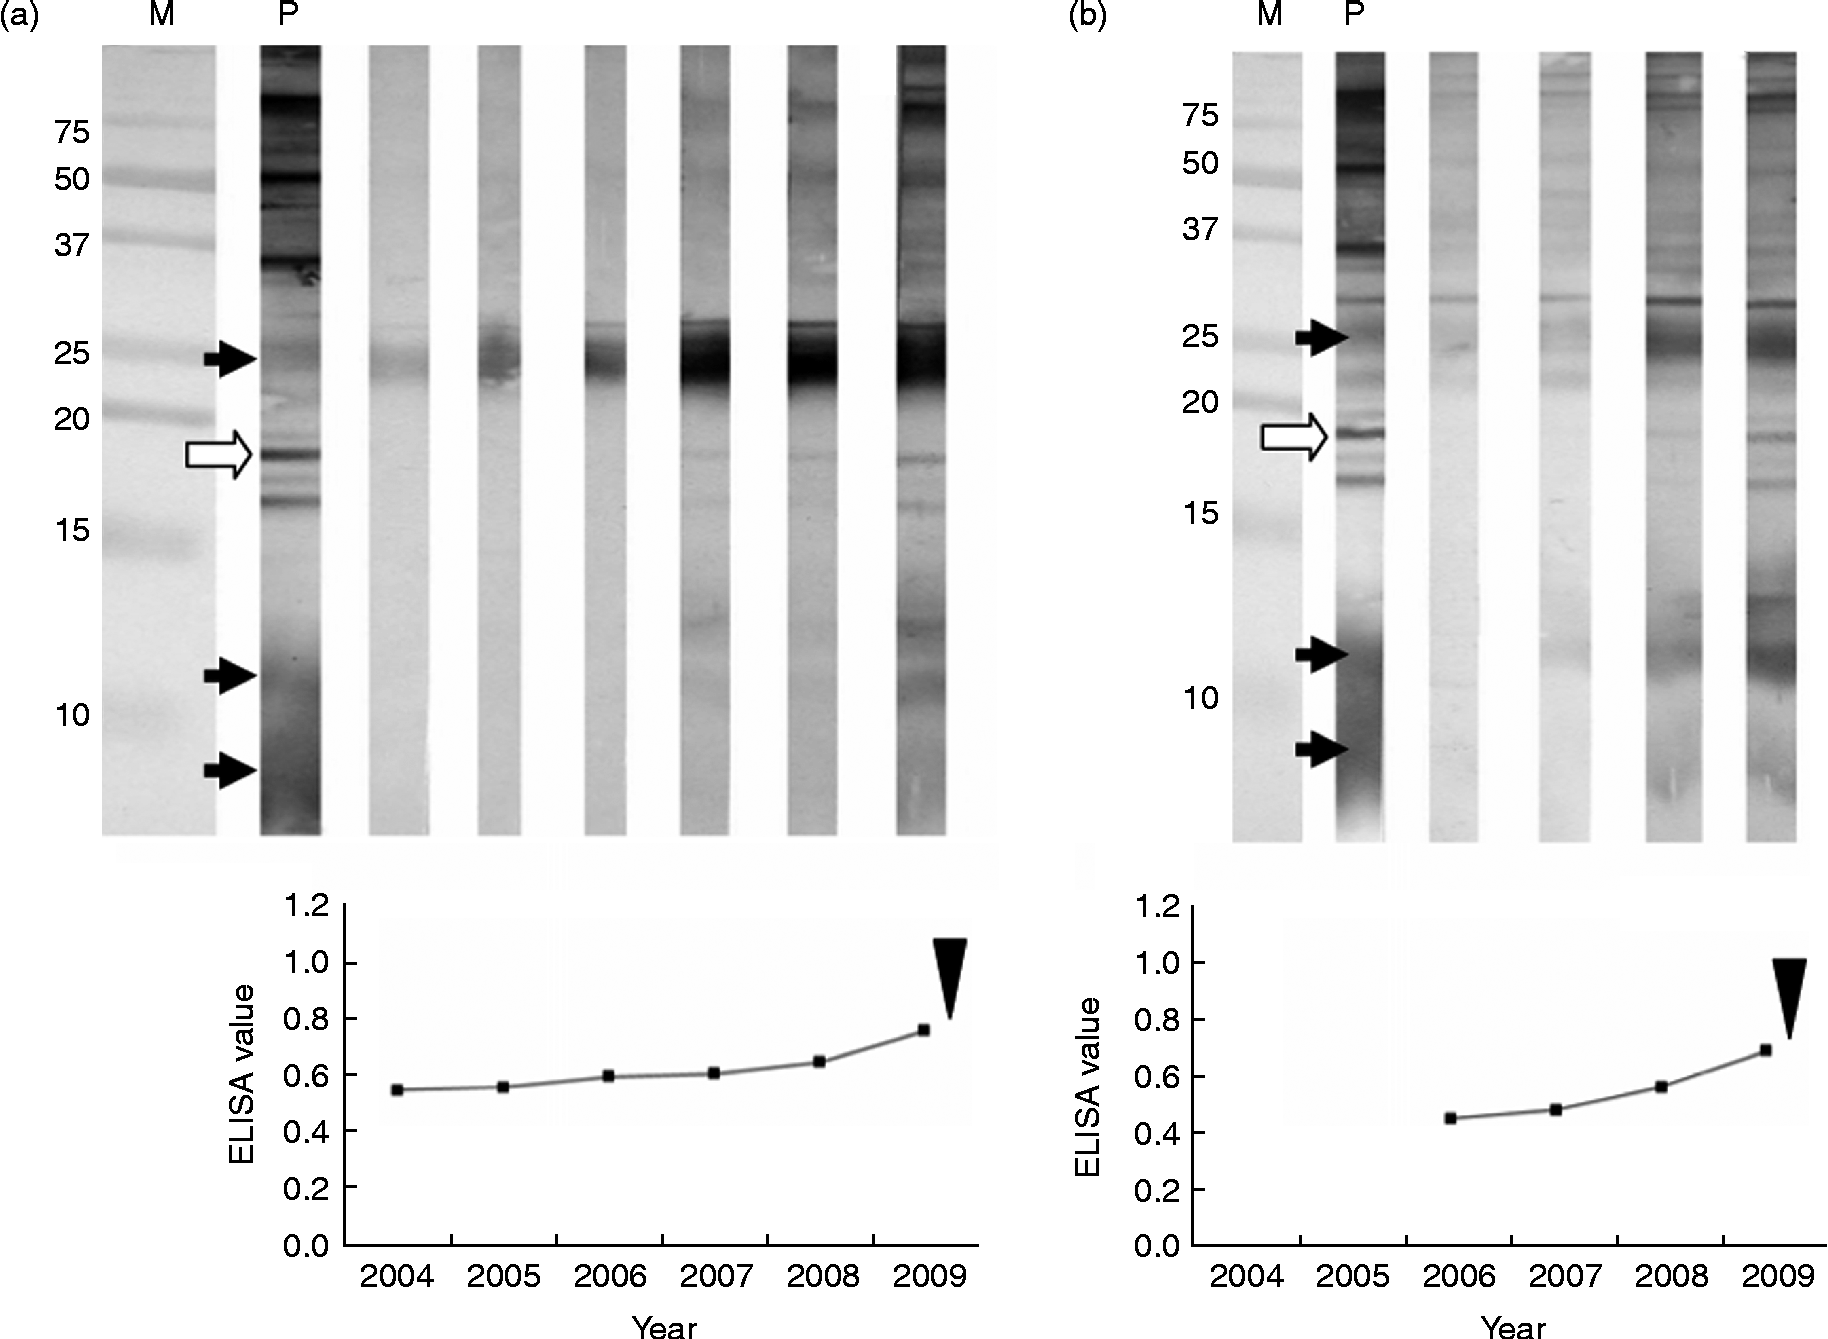
Case 2a was a 69-year-old Japanese woman who has been followed using the Hokkaido screening system since 2004 in the absence of accompanying symptoms (fig. 2a). The primary ELISA and secondary WB test yielded a quasi-positive result, with an ELISA value of 0.600 and the presence of only a 26–28 kDa band. The patient underwent follow-up for 3 years, during which time her ELISA value increased slightly and the WB test was judged to be positive following the appearance of a weak 18 kDa band in 2007. Furthermore, a phyma was identified in the liver using several imaging techniques. The patient was provisionally diagnosed with AE, and this was confirmed histopathologically after operation. Her prognosis is currently under investigation.
Preoperative patterns monitored until ‘positive’ detection. Lanes: M, molecular weight size marker; P, positive control. Diagnostic bands are indicated by arrows: the open arrow shows the main marker (18 kDa) for diagnosis. The year of surgical operation is indicated by the arrowhead. (a) Case 2a; (b) Case 2b.
Case 2b was a 68-year-old Japanese woman who has been followed using the Hokkaido screening system since 2006 (fig. 2b). The ELISA and WB test results were both quasi-positive, with an ELISA value of 0.574 and the presence of a weak 26–28 kDa band. The ELISA value increased during the follow-up period, and the 18 kDa band also appeared in a WB test in 2008. Furthermore, a phyma was identified in the liver using several imaging techniques. The patient was provisionally diagnosed with AE, and this was confirmed histopathologically after operation. Her prognosis is currently under investigation.
Total time course from preoperative stage to postoperative stage
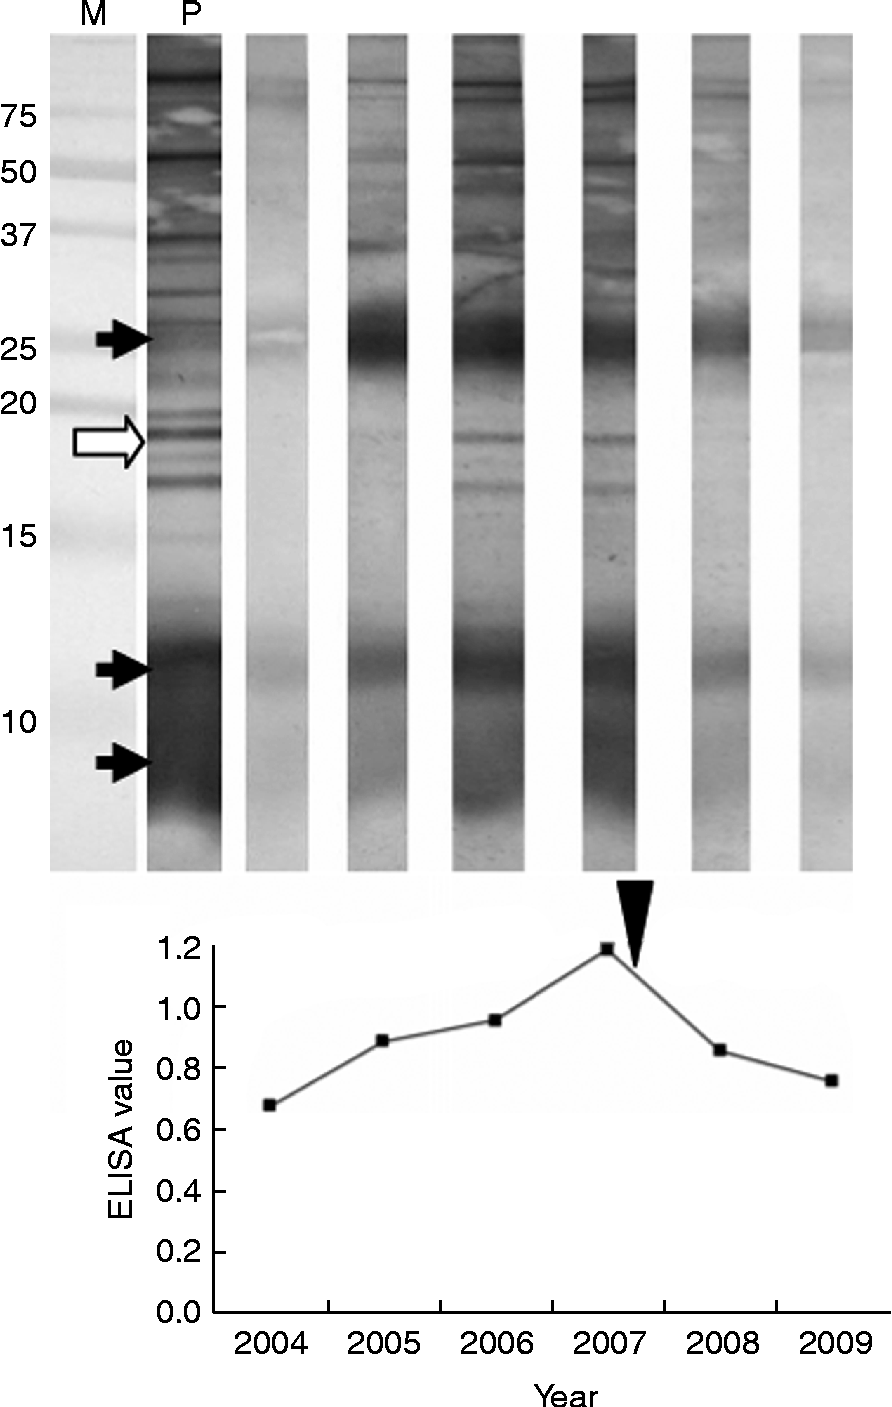
Case 3 was a 75-year-old Japanese woman who was detected using the Hokkaido screening system in 2004 (fig. 3). The primary ELISA test (ELISA value: 0.670) was within the quasi-positive range, but the secondary WB test identified 26–28 and 7–8 (and 12) kDa bands and was thus judged to be positive. Remarkable symptoms were not recognized at this point, thus the patient underwent follow-up. In the process, her ELISA value increased and a weak 18 kDa band also appeared in a WB test in 2005. Furthermore, a phyma was identified in the liver using several imaging techniques. The patient underwent surgery in 2007 and a diagnosis of AE was confirmed following histopathological analysis. Her postoperative ELISA value dropped gradually, the 18 kDa band had disappeared in a WB test in 2009, and the reaction of other antibodies also weakened.
Total time course of AE patient monitored from the preoperative stage to the postoperative stage. Lanes: M, molecular weight size marker; P, positive control. Diagnostic bands are indicated by arrows: the open arrow shows the main marker (18 kDa) for diagnosis. The year of surgical operation is indicated by the arrowhead.
Case showing sero-negativity against the 18 kDa antigen
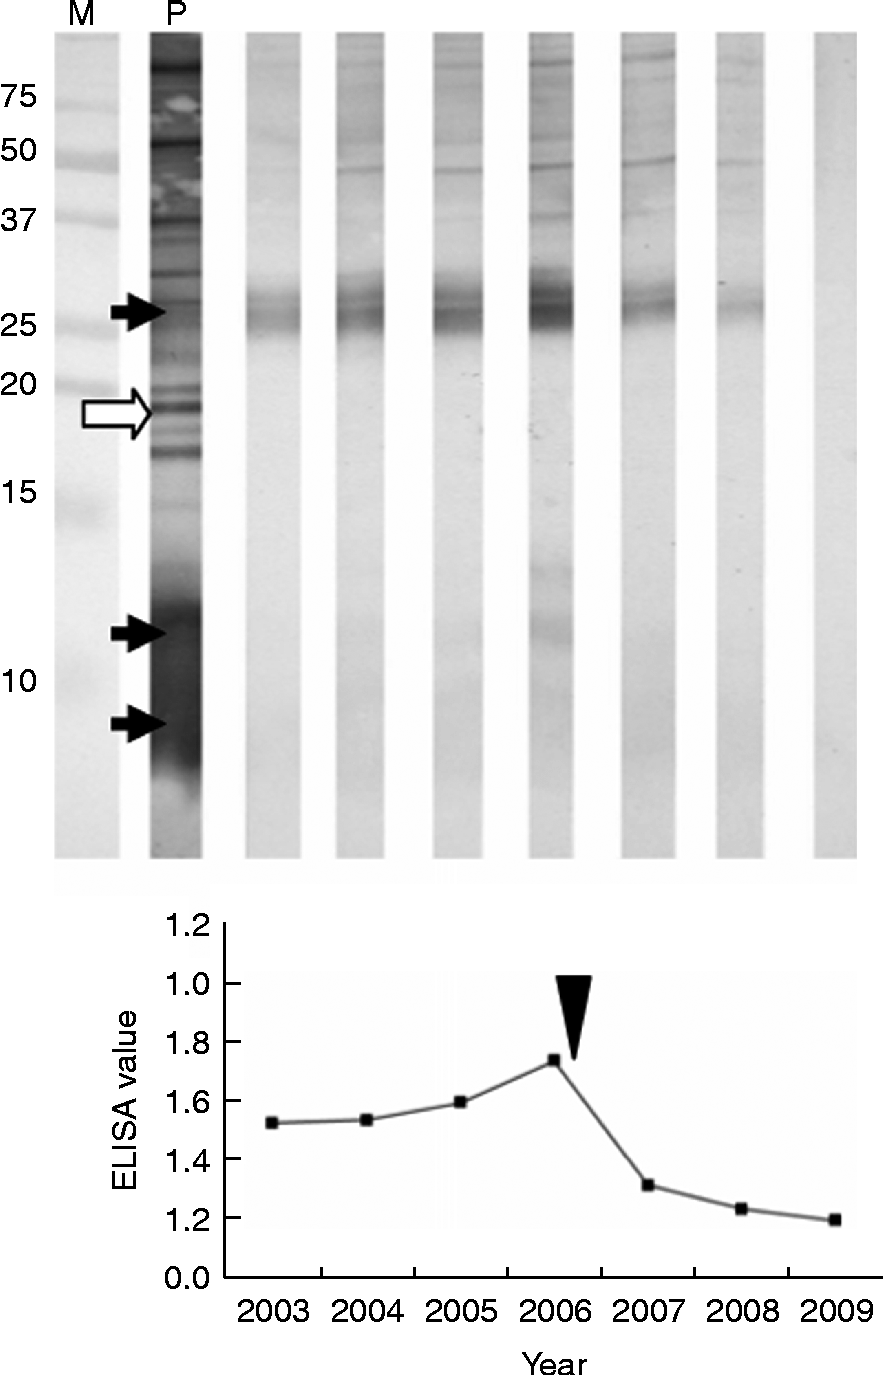
Case 4 was a 75-year-old Japanese man who has been followed using the Hokkaido screening system since 2003 (fig. 4). Both primary ELISA and the secondary WB test gave a quasi-positive result, with an ELISA value of 0.530 and the presence of only a 26–28 kDa band. The patient had no abnormal imaging features at this point and thus underwent follow-up for 3 years. Although his ELISA value increased gradually in the process, WB tests did not show the appearance of an 18 kDa band in 2004 and 2005. However, in 2006, a 12 kDa band was detected together with 26–28 kDa (strong) and 7–8 kDa (very weak) bands, and a phyma was also identified in the liver using several imaging techniques. This atypical patient underwent surgery in 2006 and a diagnosis of AE was confirmed following histopathological analysis. His ELISA value dropped in the postoperative follow-up and a WB test also became sero-negative in 2009.
Serological changes of a case showing sero-negativity against the 18 kDa antigen. Lanes: M, molecular weight size marker; P, positive control. Diagnostic bands are indicated by arrows: the open arrow shows the main marker (18 kDa) for diagnosis. The year of surgical operation is indicated by the arrowhead.
Monitoring serological changes by ELISA and immunoblot analysis in rats
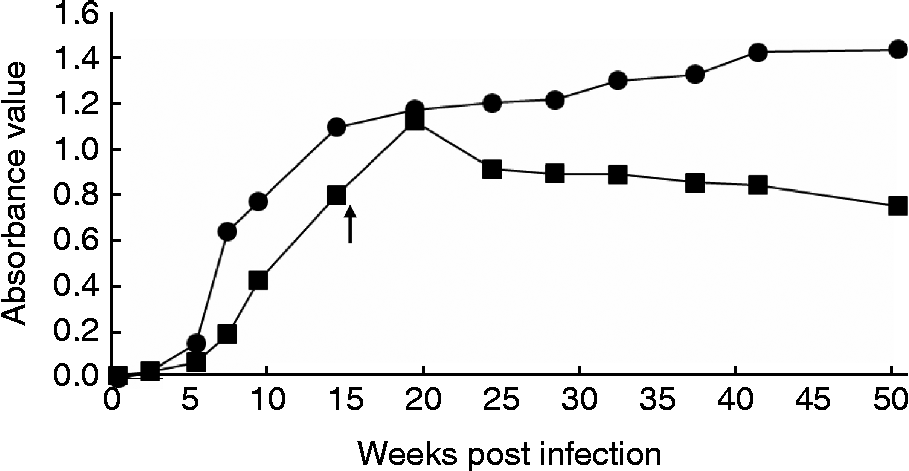
Sera were collected successively at 0, 2, 5, 7, 9, 14, 19, 24, 28, 32, 37, 41 and 50 weeks after inoculation for monitoring by ELISA. Most rats showed a sudden increase in the absorbance value 5 weeks after inoculation. Because the rats with absorbance values above 1.0 started to appear 14 weeks later, the hepatic lesion of half of the rats (n= 3) was resected in a second operation. Figure 5 shows changes in absorbance values in the excised group and the non-excised group. The absorbance value of rats with excised lesions peaked at 19 weeks; thereafter, it dropped gradually. The absorbance value of non-excised rats continued to increase.
Monitoring of serological changes in the infected rats by ELISA. Closed squares show the time course of rats in the group excised at 15 weeks after infection. Closed circles show the time course of rats in the non-excised group. All symbols show the average of the absorbance value in each group (n= 2 or 3).
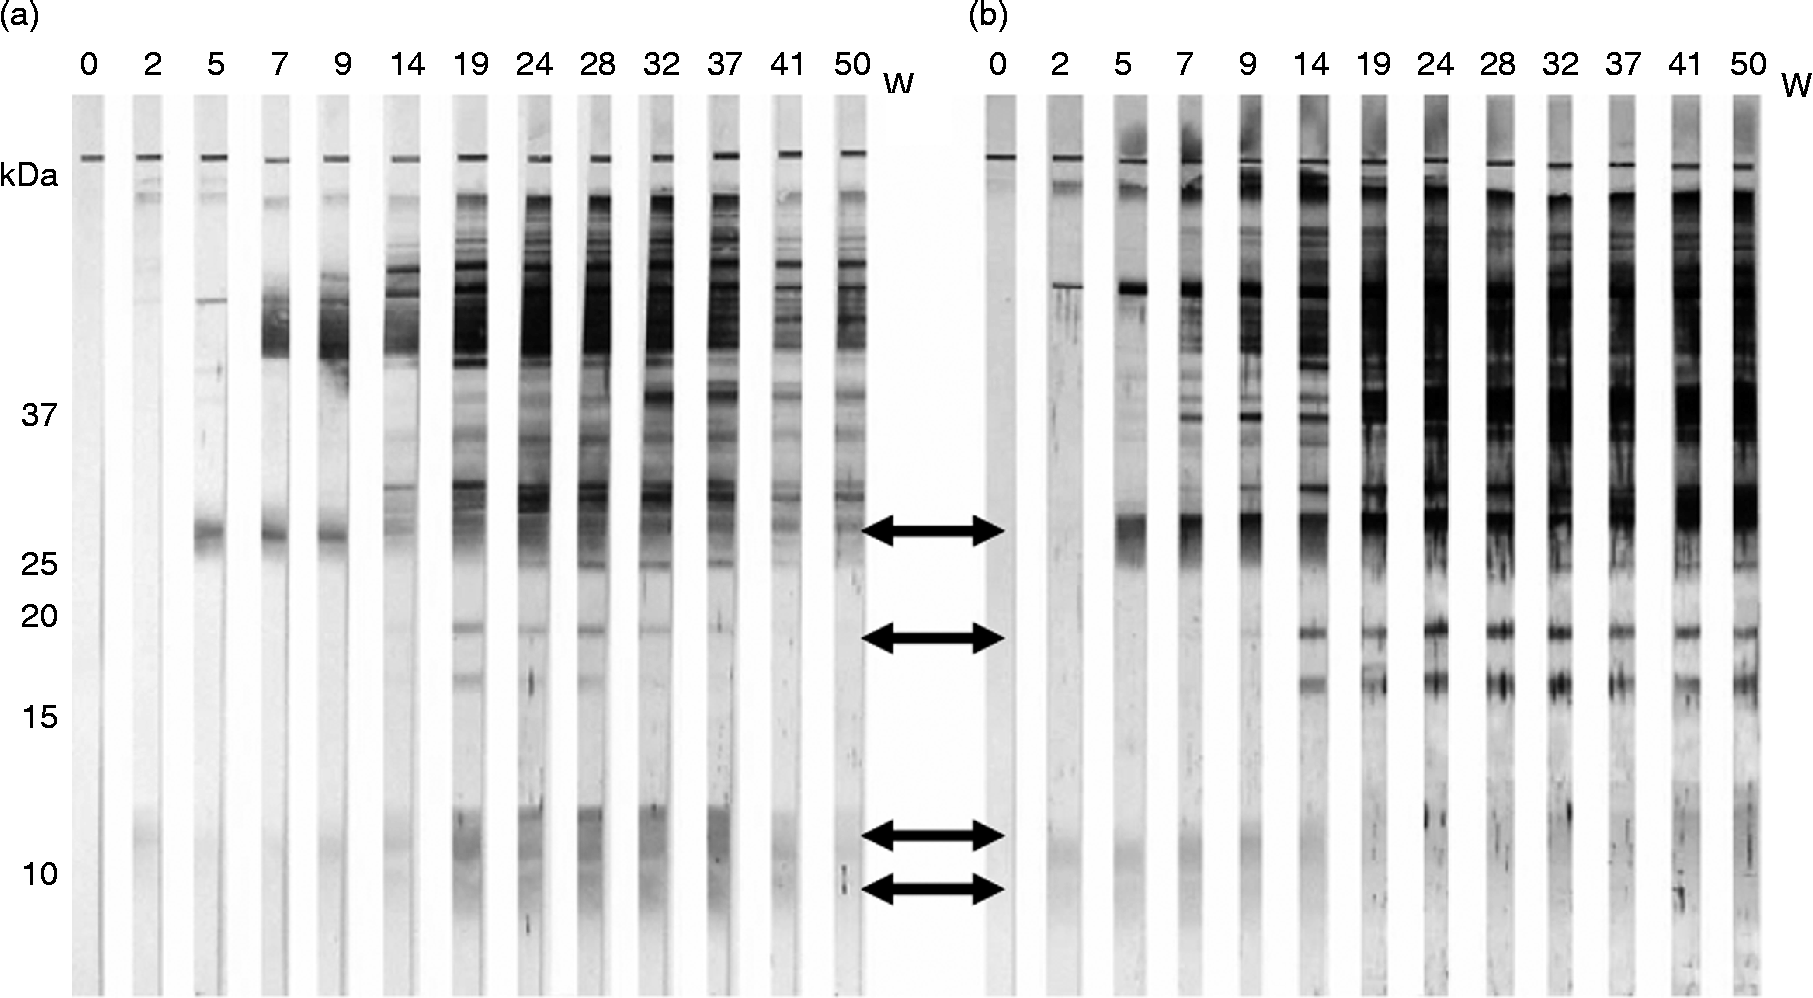
Among the WB diagnostic markers, the 18 kDa band was the last to appear, at 9–14 weeks after inoculation, in all rats. This band disappeared in rats with excised lesions at about 41 weeks (fig. 6a), but remained strong in the final test (50 weeks) in non-excised rats (fig. 6b).
Immunoblot analysis of rats excised at 15 weeks (a) or non-excised (b). Diagnostic bands are indicated by arrows. W, weeks post infection.
Assessment of rat lesions
During the course of the investigation, one rat from each group died; however, it was not known whether AE was the cause of death. The remaining four rats, which survived for 50 weeks (two per group), were dissected and both rats in the non-excised group were shown to have a lesion in their liver, while lesions were not observed in either of the rats in the excised group.
Discussion
Serological tests for human AE contribute to its provisional diagnosis prior to surgical treatment and postoperative follow-up, as shown in fig. 1 (Case 1). In the follow-up of patients with AE, serological observations in different clinical stages have been reported so far (Tappe et al., Reference Tappe, Grüner, Kern and Frosch2008, Reference Tappe, Frosch, Sako, Itoh, Grüner, Reuter, Nakao, Ito and Kern2009). In particular, the antibody response time course in the postoperative stage offers information about curative effects (Fujimoto et al., Reference Fujimoto, Ito, Ishikawa, Inoue, Suzuki, Ohhira, Ohtake and Kohgo2005). In non-human primates such as the Japanese monkey (Macaca fuscata), we previously diagnosed AE by serodiagnosis and ultrasonography (Sato et al., Reference Sato, Kawase, Yano, Nagano, Fujimoto, Kobayashi, Miyahara, Yamada, Sato and Kobayashi2005) and showed it to be almost cured after treatment with albendazole for 10 years, by imaging analysis and the disappearance of the 18 kDa band in a WB test (Kishimoto et al., Reference Kishimoto, Yamada, Yamano, Kobayashi, Fujimoto, Shimizu, Lee, Iwasaki and Miyake2009; Yamano et al., Reference Yamano, Kanetoshi, Goto, Kishimoto, Kobayashi, Fujimoto and Yamada2009c).
In contrast, information regarding the antibody response in the early stages after infection is limited, yet important as early detection is essential for AE patients. It is our prime concern to obtain this information. Nevertheless, it is difficult to detect patients without organ dysfunction and to obtain relevant information about antibody responses. For this reason, we carried out a long-term investigation using the screening system. Cases 2a, 2b and 3 of the present study enabled us to observe the process of the antibody response at a relatively early stage: all cases did not show remarkable symptoms at the first examination. In particular, Case 3 was the first time course to be successfully followed from the preoperative stage to postoperative follow-up, including stages before the appearance of the 18 kDa band (main marker).
In addition, we compared the antibody response of mammals that become the intermediate host in the infection cycle of E. multilocularis, such as humans and rats, from infection to after operation. Although the lifespan of a rat is different from that of a human, the antibody responses of the two species were similar. The 18 kDa immunoblot band of the rat appeared last, and it was the first to disappear after excision of the lesion (fig. 6a), as was the case for the human 18 kDa band. Such similarity suggests that the time courses are comparable in mammals that can become intermediate hosts, throughout all periods after infection.
In WB tests, the low molecular weight range from 7 to 28 kDa has few bands interfering with the AE diagnosis, in comparison with the high molecular weight range. Indeed, we found it difficult to distinguish bands in this range in the later time points of rats in the non-excised group. Therefore, there is validity in choosing antigens in the low molecular weight range as serodiagnostic markers for AE. On the other hand, we previously reported that 6–7% of AE patients demonstrated sero-negativity against the 18 kDa antigen, as observed in Case 4. This could be due to detecting patients before the 18 kDa band appearance, or because such patients are fundamentally not reactive against the 18 kDa antigen. Therefore, although the 18 kDa antigen can be useful as a marker for AE diagnosis, it cannot contribute to the detection of some patients, such as Case 4. To avoid misdiagnosis, different diagnostic antigens, such as the 26–28 and 7–8 kDa bands, should also be considered (Yamano et al., Reference Yamano, Yagi, Furuya, Sawada, Honma and Sato2005, Reference Yamano, Goto, Miyoshi, Furuya, Sawada and Sato2009b). In addition, these bands tend to appear earlier than the 18 kDa band and thus offer the potential for early detection of AE. Furthermore, Deplazes et al. (Reference Deplazes, Grimm, Sydler, Tanner and Kapel2005) have demonstrated two types of antibody reaction in pigs infected experimentally with AE.
In summary, we have observed for the first time a change in the antibody response during the relatively early stage after infection in human AE cases. With the exception of the time span, this change in the antibody response did not differ between human cases and those of infected rats. These findings provide valuable information for the early detection of future human AE cases.