





1. Introduction
Turbulence in the atmospheric boundary layer (ABL) and wakes of upstream rotors causes buffeting on turbines. Since the incident turbulence is not fully correlated over the turbine rotor, critical components can be subjected to O( $10^8$) load cycles in a lifetime (Manwell, McGowan & Rogers Reference Manwell, McGowan and Rogers2009). As turbines have continued to increase in size to provide further gains in energy production, these loads have become increasingly challenging to predict and manage. Accordingly, the interaction of turbines with the atmosphere, wakes and other sources of complex inflow, and its implication to turbine loading is regarded as a grand research challenge for wind energy (Veers et al. Reference Veers2019).
Wind turbine rotors normally operate at high tip-speed ratio  $\varLambda\ (=\varOmega R/U_\infty )$ with
 $\varLambda \gg \sqrt {{\overline {v^2}}/{\overline {u^2}}}$, where
 $\varOmega$ is the rotor speed,
 $R$ is the tip radius,
 $U_\infty$ is the free-stream wind speed,
 $u$ is the fluctuating streamwise ABL velocity and
 $v$ any fluctuating transverse ABL velocity in the rotor plane. As such, the fluctuating lift force that governs the blade loading is mainly dependent on the streamwise turbulence velocity as opposed to the transverse components. Therefore, for load assessments, it is critical to ensure that both the magnitudes (intensities) and scales of the streamwise velocity components are appropriately characterised. Correlations for turbulence intensities and length scales are available to guide wind turbine designers to predict the free-stream flow within the ABL (see, e.g., ESDU85020 2002). Comparisons of measurements of fluctuating wind velocity in the induction zone of a wind turbine and the blade loads and power by Howard & Guala (Reference Howard and Guala2016), for instance, have emphasised the impact of the turbulent flow. Inherent in most conventional turbine loading assessments performed either stochastically, or more commonly, in the time domain using synthesised time histories and blade element theory, is the assumption that the rotor is subjected to an undisturbed (free-stream) turbulence field with adjustments made only to the mean flow (Burton et al. Reference Burton, Jenkins, Bossanyi, Sharpe and Graham2021).
In reality, a free-stream turbulent flow approaching a rotor is subjected to both distortion (stretching of the vortical elements from mean shear) and blocking, which the rotor blades must react to. Observing this distortion and blocking has in the past proved challenging. However recently, measurements of the turbulent flow field approaching commercial horizontal axis wind and tidal turbine rotors have been made using unobtrusive sensing techniques such as light detection and ranging (LiDAR) and acoustic doppler current profilers (ADCPs). These have demonstrated that the low frequency turbulent content (large eddies), in particular, is modified through the induction zone (Pena, Mann & Dimitrov Reference Pena, Mann and Dimitrov2017; Mann et al. Reference Mann, Peña, Troldborg and Andersen2018; Milne & Graham Reference Milne and Graham2019). Field experiments of full-scale wind turbines have demonstrated that the rotors can be particularly sensitive to these energy scales (Chamorro Reference Chamorro2015). Depending on the operational state of the rotor, distortion and blocking of the flow and its subsequent influence on the unsteady aerodynamic effects of dynamic inflow and dynamic stall, can amplify or attenuate the unsteady loads. The ability to predict the changes to the turbulent flow field approaching a rotor has significant practical implications. Notably, it can allow for more informed turbine loading assessments and improved controller design, particularly when exploiting measurements of the upstream flow.
On the basis that the turbulence distortion occurs rapidly in the expanding rotor inflow, Graham (Reference Graham2017) applied rapid distortion theory (RDT) to compute changes to the turbulent velocity directly from the distorted vorticity field as it is convected up to the plane of the rotor disc. Predictions were made for both the turbulence intensities and spectra for general ratios of turbulence integral length scale to the rotor diameter, including the small-scale limit using the linearised framework of Batchelor & Proudman (Reference Batchelor and Proudman1954). Milne & Graham (Reference Milne and Graham2019) combined the RDT model with a theoretical prediction for the additional effect of the fluctuating potential flow field on the turbulence (blockage) to the turbulent streamwise velocities occurring over the inflow region. These predictions of the changes to the spectra and intensities accounting for the combined effects were found to be qualitatively consistent with the full-scale measurements from wind and turbine rotors. The relative importance of distortion and blockage to the modification of the turbulent flow field within the induction zone depends strongly on the ratio of the integral length scale  $L_x$ of the turbulence to the turbine diameter (
 $L_x/D$). As wind turbines have continued to increase in size, this ratio has decreased. It has approached typical ratios (approaching 1) for tidal turbines, giving rise to more appreciable effects of distortion and blocking. Predicting the effect of distortion and blocking on a wide range of relevant
 $L_x/D$ ratios, however, requires significant computation. Developing a model capable of efficient computations through approximations of the theoretical results is therefore desirable for its application in practice.
Further, while field observations have provided qualitative evaluations of theoretical predictions for the effect of distortion and blockage, there remains a need for high quality experimental data to facilitate more extensive validation. Appropriately scaled and carefully designed laboratory experiments can allow for a more controlled flow and remove the influence from external systems, e.g. speed or pitch controllers on the induction. Deskos et al. (Reference Deskos, Payne, Gaurier and Graham2020) have reported on a series of experimental results in a current flume to investigate changes to the turbulence intensities and power spectra upstream of a rotor that were compared with predictions from a quasi-steady blockage theory. The ability to generate a wide range of  $L_x/D$ scales and acquire measurements of the spatial variation of the turbulent flow field in a flume is however challenging. Flow conditions representative of small length-scale isotropic turbulence or larger-scale ABL turbulence may be more readily reproduced and measured in a wind tunnel using carefully designed roughness elements and installations of wire grids. Hot-wire acquisition techniques can also be used to directly sample throughout the induction zone at high resolution. Further, laboratory testing can permit the use of a porous disc as an analogy to a rotor. For lightly loaded rotors (i.e. corresponding to sufficiently small induction factors), the elimination of the blades and nacelle from the problem can provide a set up more representative of the actuator disc for which the predictions by, e.g., Graham (Reference Graham2017) are inherently based on. Since differences in turbulence coherence can be expected between a rotor and disc, testing in a wind tunnel can assist in informing the conditions in which the theoretical predictions are likely to be most valid.
To this end, the objectives of this paper are to measure the inflow turbulence structure and loading on a horizontal axis rotor and porous disc analogues in a wind tunnel and to subsequently evaluate the applicability of theoretical-based predictions that can be applied in engineering practice. The paper proceeds as follows. Section 2 describes the design of the experiment in which porous discs and a model rotor were tested in grid turbulence and a simulated ABL. These tests give a range of length-scale ratios and different intensities and induction coefficients. The mean flow and structure of the free-stream incident turbulence are characterised in §§ 3 and 4, respectively. Sections 5 and 6 outline the theoretical models for prediction of the inflow turbulence and resulting fluctuating axial forces on the rotor. The turbulence in the induction zone and response of the rotor/actuator disc to this is first considered for very large and very low turbulence length scale to disc diameter ratios. For general cases between these two extremes, distortion of the turbulent inflow is obtained by interpolating the very small length-scale ratio result using the behaviour of the low frequency spectrum limit computed previously in Graham (Reference Graham2017). The potential flow (blockage) response of the actuator disc is presented as the two above alternatives for small and large length-scale ratios and a simple interpolation is suggested. In § 7 the theoretical framework is tested against the wind tunnel tests that give a range of length-scale ratios and different intensities and induction coefficients. Finally, the models of the potential flow response of the actuator disc to the distorted turbulent inflow are used, assuming homogeneity over the face of the disc but taking account of the reduced transverse coherence, to compute predictions of the spectra and intensities of the fluctuating axial forces induced. These predictions are similarly tested against force measurements for the above cases. The key findings of the study are summarised in § 8.
2. Experiment
2.1. Facility and arrangement
The experiments were conducted in the  $10^{\prime}\times 5^{\prime}$ closed-loop wind tunnel at the Department of Aeronautics at Imperial College, London. The wind tunnel test section is nominally 3.048 m wide
 $\times 1.524\ {\rm m}$ high (
 $10^\prime\times 5^\prime$) and 20 m long. Both the wind tunnel speed and air temperature are closed-loop controlled. The test models comprised a three-bladed rotor and two porous discs of different diameters with similar porosity designed to provide a similar resistance of the rotor at the tip-speed ratio of the tests. Both the rotor and discs were aligned normal to the flow. Throughout each test the actuator conditions were fixed, thus simulating below rated conditions for a horizontal axis wind turbine for which this normally applies.
The models were first tested in a nominally clean uniform flow of the wind tunnel test section in a  $10\ {\rm m}\ {\rm s}^{-1}$ wind speed that served to establish their mean characteristics. Subsequent tests were conducted in two different turbulent flow regimes: (1) a
 $1:400$ scaled, simulated turbulent ABL with a mean hub height wind speed of
 $10\ {\rm m}\ {\rm s}^{-1}$; and (2) a uniform mean flow,
 $10\ {\rm m}\ {\rm s}^{-1}$ of homogeneous, small-scale, turbulence generated by a planar square mesh grid
 $(M=125\ {\rm mm})$. The ABL was designed according to the Engineering Sciences Data Unit (ESDU) method (ESDU82026 2002) assuming neutral conditions. A roughness length of
 $z_0 = 0.01\ {\rm m}$ was adopted from which the mean wind speed and streamwise intensity profiles were obtained. A boundary layer with similar characteristics was generated in the wind tunnel using Counihan spires (Counihan Reference Counihan1969) and a fence, and developed over a 15 m rough floor fetch. Figure 1 shows that despite a slightly weaker near-surface mean shear compared with the ESDU profiles, there is a good match in the wind tunnel for the mean velocity and intensity profiles across the rotor plane. The distribution of the ESDU values of the von Kármán length scale, which quantifies the scale of the largest eddies in the flow, varied significantly (Han et al. Reference Han, McCann, Mücke and Freudenreich2014) in response to small changes in
 $z_0$. At the planned rotor hub height of 150 m (
 $375\ {\rm mm}$), the length scale ranged between 140 m and 320 m. In the wind tunnel the von Kármán length scale was measured as 0.41 m, which is equivalent to 164 m at full scale. Figure 2 shows the wind tunnel set-up for these experiments, comprising the spires, fence and roughness fetch, and a biplanar grid (shown outside the wind tunnel) that replaced the Counihan arrangement for the tests in grid generated turbulence.
Vertical profiles of the mean velocity (a) and streamwise turbulence intensity (b). The circular symbols denote hot-wire data acquired in the wind tunnel for the installed fetch. The ESDU values for  $z_0 =0.01$ m at full scale are shown by the solid red line, with the dashed lines corresponding to the
 ${\pm }10\,\%$ limits. The dashed horizontal line at
 $Z=375\ {\rm mm}$ (150 m at full scale) represents the hub height for the rotor and porous discs. Both figures have a left wind tunnel scale axis and a right full scales axis, assuming
 $1:400$ scaling.

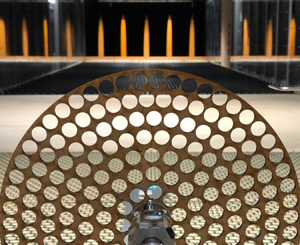
Set-up of the wind tunnel experiments. (a) The Counihan spires, fence and the ground roughness fetch are shown in the background. The rotor rig, comprising torque and r.p.m. sensors, electromagnetic brake and forward-reaching shaft are in the foreground. The large porous disc is seen mounted onto the shaft, which for this case, was locked from rotating. Shown outside the wind tunnel, on the right of the image, is a two-dimensional turbulence generation grid, which replaced the spires, fence and roughness when the grid turbulence experiments were conducted. Immediately ahead of the porous disc, the vertical hot-wire probe holder, with a right-angle hot-wire probe, is shown mounted on a linear rail, which enabled the distance between the sensor and the model (rotor or disc) to be varied. The general sign convention is shown. (b) End and front views of the rig with the large porous disc, showing the sign convention and origins. Here  $x = 0$ lies at the streamwise location of the upstream face of the porous disc for the disc measurements, or at the streamwise location of the blade quarter chord for the rotor measurements;
 $Z = 0$ lies on the tunnel roughness floor for coordinates related to the ABL;
 $z=0$ lies at the centre of the porous plate or rotor. For two-point velocity correlations, the main hot wire was held at hub height, and a second hot wire was introduced, traversing vertically (shown in the end view) or transversally (shown in the front view) relative to the first wire, with separation
 $\Delta z$ or
 $\Delta y$. (c) The rotor and two porous plates used in these experiments. The central grey region on the porous plates shows the extent of the hub.

For the experiments in the ABL, all the models were tested in the same position in the wind tunnel. This was around 15 m downstream of the spires, at mid-width of the test section, and at an effective hub height of  $375\ {\rm mm}$ (equivalent to 150 m at full scale). A right-angle hot-wire probe was mounted on a probe holder, with the sensor at hub height. The circular stem of the probe was approximately
 $2\ {\rm mm}$ in diameter and about
 $50\ {\rm mm}$ long, while the probe holder was approximately
 $4\ {\rm mm}$ in diameter and about
 $200\ {\rm mm}$ long. As such, it was assumed to have minimal effect on the mean and turbulent flow at the measured point. The probe was able to translate along
 $x$, at hub height, by means of a rail mounted on the floor upstream of the rotor rig.
For the experiments behind the grid, the models were mounted such that the hub was at the mid-width and mid-height of the test section. The right-angle hot-wire probe, on its probe holder, was at hub height and fixed at 12.5 $M$. The rotor rig was able to translate downstream of the fixed hot-wire sensor.
The geometric blockage ratio based on the frontal area of the models in the wind tunnel working section was  $4.3\,\%$ for the rotor, and
 $3.5\,\%$ and
 $1.0\,\%$ for the large and small porous discs, respectively. The upstream wind speed at hub height was measured with a Pitot-static probe and a Furness FCO560 micromanometer, with the latter also recording the wind temperature and atmospheric pressure. For the tests in grid turbulence, the Pitot probe was placed upstream of the grid. For the ABL experiments, it was
 $3.5D$ ahead and
 $2.5D$ to the side from the centres of the test models.
2.2. Porous discs and rotor
Figure 2 shows a schematic of models of the porous discs and the  $D=500\ {\rm mm}$ diameter three-bladed turbine. The two porous discs were of
 $D=450\ {\rm mm}$ and
 $245\ {\rm mm}$ and fabricated from
 $4\ {\rm mm}$ thick medium-density fibreboard. In both discs,
 $12\ {\rm mm}$ diameter holes were spaced equidistant both radially and azimuthally. The ratio of the open area to total area for the small disc was 52.9 %. This ratio was slightly larger for the larger disc, 55.5 %, due to the smaller distance between the outermost array of holes and the disc perimeter.
The turbine was designed using conventional blade element momentum theory. The spanwise chord length and twist angle distributions were based on a design tip-speed ratio of  $\varLambda =4.0$. The low Reynolds number SG6051, SG6043 and SD2030 airofoil sections (Selig, Donovan & Fraser Reference Selig, Donovan and Fraser1989; Giguère & Selig Reference Giguère and Selig1998) were blended along the blade span outward from the
 $42\ {\rm mm}$ diameter hub. The Reynolds numbers of the large and small porous discs, based on the wind speed at hub height and their diameters, were
 $3\times 10^{5}$ and
 $1.63\times 10^{5}$, respectively. The Reynolds number of the rotor, based on the tangential velocity and the chord at
 $0.75R$ (where
 $R=D/2$), was
 $6.35\times 10^{4}$.
For the hot-wire velocity measurements upstream of the rotor and discs, the models were mounted on a rig comprising an in-line Magtrol torque-r.p.m (revolutions per minute) sensor and a Magtrol proportional–integral–derivative (PID) controlled electromagnetic brake. For the rotor case, this was used to provide a constant rotational speed of 1500 r.p.m., equivalent to a tip-speed ratio of  $\varLambda =3.93$. For the discs cases, the shaft was locked from spinning. In both the discs and rotor cases, the shaft extended approximately
 $360\ {\rm mm}$ ahead of the rig platform. The lowest structural resonance (pitching) of the models attached to the support system corresponded to a frequency of about 25 Hz for the large disc and the rotor. It was significantly higher for the small disc.
The streamwise velocity component of the turbulence was measured upstream of the discs and rotor using a Dantec 55P14 miniature right-angle hot-wire probe driven by a Dantec streamline constant temperature anemometer. For the models in grid turbulence, the hot-wire velocity data were recorded for 90 s. Data were acquired for 210 s in the ABL flow. The model plane, i.e.  $x=0$, was defined as the streamwise location of the disc front face for the porous disc measurements. It was at the rotor blade quarter chord for the rotor measurements. For the spanwise correlation measurements, in the absence of the models, two 55P14 probes were mounted on a spanwise rail, with the two sensors at hub height, in the location of the plane of the model. One sensor was kept fixed on the axis at hub height, while the other was traversed horizontally by
 $\Delta y$. For the vertical correlation measurements, also in the absence of the models, a similar arrangement was adopted. Specifically, one sensor was kept fixed on the axis at hub height while the other was traversed vertically above it by
 $\Delta z$. In all cases, data were acquired at 60 kHz. Calibration was carried out against a Pitot-static probe in the free stream.
For the axial force measurements, two methods were used. In method 1 the porous discs were mounted directly on an ATI F/T Sensor: Nano17 Titanium SI 32-0.2 model, and therefore, the model overhang distance (ahead of the load cell) was kept to a minimum, minimising torque loads. It was not possible to mount the rotor in this arrangement, due to the risk this would impose on the small load cell. The Nano17 load cell was then mounted onto the rotor rig shaft, again locked from spinning. In method 2 the rotor rig was modified (the torque and electromagnetic brake were removed) and an ATI F/T Sensor: Gamma SI-130-10 was mounted instead. A forward-reaching sting, mounted at its root onto the Gamma load cell, accepted the models at its tip. Axial load tests on the rotor using this method, since the rotating shaft was replaced by a sting, necessitated the rotor to be free spinning and the electromagnetic brake removed. In this case, the nominal 1500 r.p.m. was maintained by adjustable blade tip drag devices. These comprised small steel screws projecting a short length from the blade tip. This passively controlled the rotational speed without adding significant mass to the live part of the model.
In both methods, the mean and fluctuating axial (drag) force induced by the mean and turbulent flows on the whole rotor and each porous disc were measured. The data sampling rate for both the Nano and Gamma load cells was set at 10 kHz. The acquisition duration of the axial load data for the models in grid turbulence and ABL flow was 90 s and 210 s, respectively. These axial load data were then low-passed filtered. Specifically, for cases in grid turbulence, the small disc data were filtered using a cutoff frequency of  $f_c=100\ {\rm Hz}$. The large disc and rotor data were filtered using
 $f_c=25\ {\rm Hz}$. For cases in ABL flow,
 $f_c=100\ {\rm Hz}$. The low-pass filtering of load-cell data is discussed in more detail in § 7.
3. Mean velocity in the induction zone
The mean velocity in the induction zone is first characterised, given its fundamental effect on the inflow turbulent field. Vortex cylinder theory (Conway Reference Conway1995), which is consistent with the actuator disc momentum theory (Betz Reference Betz1920), and was assumed for the previous distortion calculations by Graham (Reference Graham2017), is known to provide a good prediction of the mean streamwise velocity  $U$ along the axis in the induction zone of a horizontal axis rotor with uniform disc loading. This is similarly the case for a porous disc with a spatially uniform coefficient of resistance. The theory predicts that at the disc face,
 $x=0$, the mean axial velocity will be uniform everywhere through the disc
 $r\le R$. Through the induction zone the mean streamwise velocity along the disc axis (i.e.
 $r=0$ and
 $x<0$) is given by
 \begin{equation} U\left(x,r=0\right)=(1-a(x))U_\infty, \end{equation}
where the axial induction factor on the axis,  $a(x)=a_0(1+{x}/{\sqrt {R^2+x^2}})$, with
 $a_0$ the value of the disc induction factor. Since there is uniformity across the disc face,
 \begin{equation} U\left(x=0,r\leq R\right)=(1-a_0)U_\infty. \end{equation}
Batchelor & Proudman (Reference Batchelor and Proudman1954) originally defined a contraction coefficient,  $c =U/U_\infty$, for accelerating turbulent flow passing through a contracting duct. Here it is defined for the slowing, diverging flow upstream of the rotor disc for which
 $c<1$. At the disc
 $c=c_0=1-a_0$, noting that
 $a_0$ is directly related to the pressure drop coefficient
 $K={\Delta p}/({\tfrac {1}{2}\rho U(0)^2})$ (where
 $\Delta p$ is the pressure difference across the disc and
 $\rho$ is the fluid density), through the expression
 $K=4a_0/(1-a_0)$.
Figure 3 shows the mean velocity measurements normalised by the upstream mean velocity at the same height along the axis through the induction zone upstream of the discs and rotor. Values of induction coefficients  $a_0$ can be calculated for each of the models from either fitting the Betz (Reference Betz1920) actuator disc mean velocity formula (3.1) or by evaluating
 $a_0$ directly from the mean axial force measurements. The velocity measurements along the axis and the theoretical lines given by (3.1) to fit them fall below the (dashed) lines, which are similarly calculated from the force measurements. The discrepancy increases towards the disc and is much larger for the small porous plate than for the other two. We believe that this is due to the greater solidity of the hub region of the discs and rotor, which is relatively more extensive in the case of the small porous plate. We have therefore taken the value of
 $a_0$ given by the force measurements to be the more reliable for the prediction of induction zone turbulence intensities and force spectra.
Mean streamwise velocity for the rotor, large porous disc and small porous disc tested in the ABL (a,c,e) and grid turbulence (b,d,f). Circular markers show data from hot wire. The solid line is a best fit of (3.1), iterating on  $a_0$, to hot-wire data. The dashed line is computed using
 $a_0$ based on the thrust measurements.

It is noted that in the case of the ABL there is a small downward deviation of the mean flow streamlines ahead of the disc due to the interaction of the mean shear with the disc resistance. However, this deviation can be shown to be very small (Conway Reference Conway1995), and has not been taken into account in the present work.
4. Representation of the incident turbulence
4.1. Spectral models and grid turbulence
The von Kármán empirical spectrum function for isotropic turbulence is often taken for convenience to represent free-stream turbulence. This is the case when there is no mean shear such as in homogeneous turbulence downstream of a grid (e.g. Bearman Reference Bearman1972) or if the mean shear is weak. Accordingly, it is used for comparison with the present tests in grid turbulence and, subsequently, for the theoretical prediction models. The spectrum model (von Kármán Reference von Kármán1948) specifies the triple-wavenumber energy spectrum function that, assuming isotropy, gives the following for the streamwise velocity components:
 \begin{equation} \varPhi_{11\infty}^{VK}\left(\kappa_\infty\right) = \frac{1}{4{\rm \pi}}\left(1.339L_{x\infty}\tau_\infty^*/\kappa_\infty^{*2}\right)^2 \frac{C\overline{u^2}_\infty\kappa_\infty^{*4}}{\left(1+ \kappa_\infty^{*2}\right)^{{17}/{6}}}. \end{equation}
Here  $\overline {u^2}$ is the variance of the fluctuating streamwise velocity,
 $L_{x\infty }$ is the streamwise integral length scale,
 $\kappa _\infty ^*=1.339 L_{x\infty } \kappa _\infty$,
 $\kappa _\infty =(\kappa _1,\kappa _2,\kappa _3)$,
 $\tau _\infty ^*=\sqrt {{\kappa _2^*}^2+{\kappa _3^*}^2}$ and
 $C=(220/9) L_{x\infty }$;
 $\infty$ denotes free-stream conditions. The single wavenumber
 $\boldsymbol {\phi }_{11\infty }^{VK}(\kappa _1)$ spectrum of streamwise velocity can be derived from (4.1) by integrating over the transverse wavenumbers as
 \begin{equation} \boldsymbol{\phi}_{11\infty}^{VK}(\kappa_1) =\int^\infty_{-\infty}\int^\infty_{-\infty}\varPhi_{11\infty}^{VK} \left(\kappa_\infty\right)\,{\rm d}\kappa_2\,{\rm d}\kappa_3. \end{equation}
The wavenumber  $\boldsymbol {\phi }_{11\infty }^{VK}(\kappa _1)$ is more commonly expressed as a frequency spectrum. By assuming Taylor's hypothesis of effectively frozen turbulence convection to relate the axial wavenumber
 $\kappa _1$ to the frequency by
 $f\ (={\kappa _1U_\infty }/{2{\rm \pi} })$, it is given by
 \begin{equation} S_{11\infty}(\,f)=\frac{4L_{x\infty} \overline{u^2}_\infty}{U_\infty\left[1+\left(\dfrac{1.339L_{x\infty}f}{U_\infty}\right)^2\right]^{5/6}}. \end{equation}
In this case the convection velocity of the turbulence is assumed to be the uniform mean velocity  $U_{\infty }$.
Since the triple-wavenumber spectrum (4.1) is axisymmetric, the transverse coherence coefficient  $C_{11}(\Delta r,\kappa _1)$, which gives the correlation between wavenumber
 $\kappa _1$ (i.e. frequency) components separated a transverse distance
 $\Delta r$ in any direction in the
 $(y=r_2,z=r_3)$ plane, can be obtained from the Fourier transform of
 $\varPhi ^{VK}_{11\infty }$ with respect to either transverse wavenumber
 $\kappa _j$,
 $j=2$ or
 $3$, yielding
 \begin{equation} C_{11}(\Delta r_j,\kappa_1)=\frac{4\int^\infty_0\int^\infty_0 \varPhi^{VK}_{11\infty}(\kappa_\infty)\cos(\Delta r_j \kappa_j) \,{\rm d}\kappa_2 \,{\rm d}\kappa_3}{\boldsymbol{\phi}_{11\infty}^{VK}(\kappa_1)}, \end{equation}
taking account of the symmetry of the integrals with respect to wavenumber.
Similarly, the transverse correlation coefficient  $R_{11}(\Delta r)$ is obtained by integrating over the streamwise wavenumber, giving
 \begin{equation} R_{11}(\Delta r_j)=\frac{8\int^\infty_0\int^\infty_0\int^\infty_0 \varPhi^{VK}_{11\infty}(\kappa_\infty)\cos(\Delta r_j \kappa_j)\,{\rm d}\kappa_1\,{\rm d}\kappa_2\,{\rm d}\kappa_3}{\overline{u_\infty^2}}, \end{equation}
as plotted, for example, in Figure 4.
Two-point velocity correlation for the grid turbulence flow and its computation from integrated coherence.

Both of the above integral expressions can be evaluated analytically for the von Kármán form of the spectrum to provide quantification of the spatial structure of the turbulence. The resulting expression for the transverse correlation is
 \begin{equation} R_{11}(\Delta r^*)=\frac{1}{\varGamma(1/3)}\left(\frac{\Delta r^*}{2}\right)^{1/3}\left\{ K_{1/3}(\Delta r^*)-\Delta r^*K_{2/3}(\Delta r^*)\right\}, \end{equation}
where  ${K}_\alpha$ is the modified Bessel function of the second kind and
 $\Delta r^*\ (={r}/{1.339L_{x\infty }})$ is the non-dimensional transverse separation. The corresponding coherence is
 $$\begin{align} & C_{11}(\Delta
r,\kappa_{1\infty}) =
\frac{2}{\varGamma(5/6)}\left(\frac{(1+\kappa_{1\infty}^{*2})^{1/2}\Delta
r^*}{2}\right)^{5/6}\nonumber\\ &\quad \times\left\{
K_{5/6}\left((1+\kappa_{1\infty}^{*2})^{1/2}\Delta
r^*\right) -\frac{(1+\kappa_{1\infty}^{*2})^{1/2}\Delta
r^*}{2}K_{1/6}\left((1+\kappa_{1\infty}^{*2})^{1/2}\Delta
r^*\right) \right\}.
\end{align}$$
The expressions given above for frequency spectra, correlations and coherences are also given, for example, in Burton et al. (Reference Burton, Jenkins, Bossanyi, Sharpe and Graham2021, §§ 2.6.4 and 2.6.7) and Harris (Reference Harris1970).
In the case of tests in grid generated turbulence, the expression for the von Kármán energy spectrum function  $\varPhi _{11\infty }^{VK}$ as given in (4.1) will be used as an adequate representation of the turbulence incident on the rotor. At distances greater than about 10 grid meshes downstream of a grid, turbulence can be assumed to be approximately homogeneous. However, it is statistically axisymmetric rather than isotropic, with
 $\overline {u^2}$ being considerably larger than the respective components in the transverse and vertical directions (
 $\overline {v^2}$ and
 $\overline {w^2}$). Because of its anisotropy, the transverse turbulence length scales
 $L_{y\infty,z\infty }$ are also less than the isotropic prediction of half of the streamwise length scale given by the autocorrelation function. In the present tests the ratio was found to be about
 $3/8$, in agreement with other grid turbulence measurements in the literature; see, e.g., Jackson, Graham & Maull (Reference Jackson, Graham and Maull1973). Therefore, since the transverse correlation of the turbulence over the disc has the largest influence on the axial force, the streamwise integral length scale used here in the calculations for the grid turbulence cases was obtained from a best fit to the measured data for
 $R_{11}(y)={\overline {u(x_0,y_0,z_0)u(x_0,y_0+y,z_0)}}/{\overline {u^2}(x_0, y_0,z_0)}$ in (4.6), which is an excellent match.
The corresponding transverse coherence, like the transverse correlation, is independent of transverse direction. This is shown by figure 5 with the wind tunnel measurements for the grid generated turbulence. The measurements were taken with horizontal separations only in this case. The square mesh grid having the same pattern in both horizontal and vertical directions, the vertical separation equivalents were not measured but assumed to be the same as the horizontal ones. Previous work with other regular grids had shown the turbulence becoming statistically axisymmetric as it developed downstream of the grid.
Horizontal coherence for select frequencies in grid turbulence flow. Lines: computed coherence; markers: coherence from hot-wire data.

4.2. The ABL turbulence
The von Kármán representation is less adequate for ABL turbulence and its simulation in wind tunnels (see comparisons by Deaves & Harris (Reference Deaves and Harris1978) with full-scale data). In the case of simulated ABL turbulence, we have found, as have others (Counihan Reference Counihan1970; Fordham Reference Fordham1985; Hutchins & Marusic Reference Hutchins and Marusic2007; Fang & Porté-Agel Reference Fang and Porté-Agel2015), that the transverse correlations and coherences of streamwise turbulence velocity with horizontal separation and those with vertical separation are different. Specifically, the measured data for the vertical separation correlation and coherences can still be scaled to fit the predictions of the von Kármán spectrum reasonably well, for a suitable value of the streamwise integral length scale  $L_{x\infty }$. However, those for horizontal separation cannot. Our measurements, in agreement with the literature, show a much more strongly negative correlation and coherences for larger horizontal separations than are predicted for isotropic turbulence. It is postulated that these stronger negative regions may be attributable to side-by-side low- and high-speed streaks that have a tendency to form in the outer layer of turbulent boundary layers.
Mann (Reference Mann1994) has derived theoretically a description of ABL turbulence subject to the effects of mean shear (following Durbin Reference Durbin1981) and blockage by the presence of an impermeable ground plane (Hunt & Graham Reference Hunt and Graham1978), assuming RDT. In the present measurements, corresponding to a rotor hub height larger than one turbulence length scale above the ground, the ground proximity effect would be expected to be weak and the distortion appear to be primarily due to the mean shear. Calculation of the resulting spectrum function and corresponding correlations and coherences that are required to calculate the rotor or disc axial force spectra are more complicated with this theoretical model and would require multiple integrations. A major aim of the present work is the efficient prediction of axial force spectra for rotors and analogous porous discs in ABL turbulence for which an adequate representation of the transverse coherences is essential. We have therefore opted to seek a minimal extension of the empirical von Kármán spectrum function  $\varPhi _{11}$ sufficient to give an improved fit for the measured streamwise velocity coherences of the ABL turbulence while still allowing the analytic integration of (4.4) and (4.5), which are possible with this form of the spectrum function. The numerator of
 $\varPhi _{11}$ is adjusted such that the negative component of transverse correlation and coherence with horizontal separation is enhanced to fit the measured data while not affecting the vertical separation data. Specifically, the second (negative) term in the horizontal, transverse coherence is multiplied by a factor
 $\eta (\kappa _1^*)=1+{\eta _0}/({1+\kappa _1^{*2}})$ such that
 $$\begin{align} & C_{11}\left(\Delta
y,\kappa_{1\infty}\right)=\frac{2}{\varGamma(5/6)}\left(\frac{(1+\kappa_{1\infty}^{*2})^{1/2}\Delta
y^*}{2}\right)^{5/6} \nonumber\\ &\quad\times\left\{
K_{5/6}\left((1+\kappa_{1\infty}^{*2})^{1/2}\Delta
y^*\right)-\eta(\kappa_{1\infty}^*)\frac{(1+\kappa_{1\infty}^{*2})^{1/2}\Delta
y^*}{2}K_{1/6}\left((1+\kappa_{1\infty}^{*2})^{1/2}\Delta
y^*\right)\right\}.
\end{align}$$
The vertical coherence remains unchanged, as in (4.7),
 $$\begin{align} & C_{11}\left(\Delta
z,\kappa_{1\infty}\right)=\frac{2}{\varGamma(5/6)}\left(\frac{(1+\kappa_{1\infty}^{*2})^{1/2}\Delta
z^*}{2}\right)^{5/6} \nonumber\\ &\quad \times \left\{
K_{5/6}\left((1+\kappa_{1\infty}^{*2})^{1/2}\Delta
z^*\right)-\frac{(1+\kappa_{1\infty}^{*2})^{1/2}\Delta
z^*}{2}K_{1/6}\left((1+\kappa_{1\infty}^{*2})^{1/2}\Delta
z^*\right)\right\}.
\end{align}$$
The modified triple-wavenumber spectrum function corresponding to these two coherence functions can be shown, as outlined in Appendix B, to be
 \begin{equation} \varPhi_{11\infty}\left(\kappa_\infty\right) = C_0\left\{\varPhi_{11\infty}^{VK}\left(\kappa_\infty\right) -\frac{5\eta_0 (1.339 L_{x\infty})^2 L_{x\infty}\overline{u_{1\infty}^2}}{3{\rm \pi} U_\infty} \left[ \frac{1+\kappa_\infty^{*2}-\dfrac{11}{3}\kappa_{2\infty}^{*2}+\dfrac{5}{3}\kappa_{3\infty}^{*2}}{(1+\kappa_{1\infty}^{*2})(1+\kappa_\infty^{*2})^{17/6}} \right]\right\}, \end{equation}
where  $C_0={81}/({81-6\eta _0})$. The modification (second) term has been arranged so that the spectra all revert to their isotropic form at high frequencies and the possibility of analytical integration has not been compromised. The single wavenumber (frequency) spectrum that follows from integrating
 $\varPhi _{11\infty }$ in (4.10) over all
 $\kappa _{2\infty }$ and
 $\kappa _{3\infty }$ is
 \begin{equation} S_{11\infty}(\kappa_{1\infty})=\frac{81-15\eta_0/(1+\kappa_{1\infty}^{*2})}{81-6\eta_0}S_{11\infty}^{VK}(\kappa_{1\infty}). \end{equation}
The corresponding empirical correlations can be determined by integrating numerically each coherence with respect to frequency. These coherences and correlations are compared with the measured data from the wind tunnel ABL in figures 6 and 7. An optimisation routine, varying  $\eta _0$ and
 $L_{x\infty }$, fitted both theoretical spanwise and vertical correlations, obtained from integrating the coherences, to the corresponding two-point experimental data. This yielded the best-fit values as
 $\eta _0=2.0$ and
 $L_{x\infty }= 0.3\ {\rm m}$, the latter being approximately
 $3/4$ of the autocorrelation value as for the grid turbulence. The results show much improved agreement across most separation distances, though weaker agreement at small
 $\Delta y$ is acknowledged. In the ABL case, as in the grid turbulence case, the length scale
 $L_{x\infty }$ is derived from fitting the measured transverse correlation data to the corresponding empirical expressions.
Horizontal separation ( $y$ direction) and vertical separation (
 $z$ direction) two-point velocity correlations for the ABL flow. Horizontal separation (
 $y$ direction) correlation: blue circular markers are correlation data from hot wire and the solid line is the correlation from integration of the coherence. Vertical separation (
 $z$ direction) correlation: black diamond markers are correlation data from hot wire and the dashed line is the correlation from integration of the coherence.

Horizontal separation (a) and vertical separation (b) coherence in ABL flow for select frequencies.

With this best-fit value of  $\eta _0=2.0$ the prefactor in (4.11) is
 $({27-10/(1+\kappa _{1\infty }^{*2})})/{23}$. For low wavenumbers, this tends to
 $17/23$ and, therefore, reduces the spectrum energy density below
 $S^{VK}_{11\infty }(\kappa _{1\infty })$ and, for high wavenumbers, tends to
 $27/23$ equalling
 $C_0$ and giving a modest amplification. The cross-over wavenumber at which the power spectral density (PSD) is unchanged is given by
 $\kappa ^*_{1\infty }=\sqrt{(3/2)}$.
5. Turbulence intensity in the induction zone of an actuator disc
The turbulent velocity is modified through the induction zone approaching an actuator disc. Its modification is a result of two effects: firstly, the fluctuating (blocking) flow field of the disc in response to the incident turbulence; secondly, the consequence of the mean velocity gradients generated by the disc resistance on the turbulent vorticity.
The fluctuating (vector) velocity field of the inflow turbulence is therefore decomposed into two parts,
 \begin{equation} \boldsymbol{u}(x)=\boldsymbol{u}_p(x) + \boldsymbol{u}_\zeta(x), \end{equation}
where  $\boldsymbol {u}_p(x)$ is the perturbation velocity due to the blocking action of the disc and
 $\boldsymbol {u}_\zeta (x)$ is the streamwise fluctuating velocity distorted by the mean flow gradients in the induction zone. In the limit of zero disc resistance
 $(a_0=0)$
 $\boldsymbol {u}_p\rightarrow 0$ and
 $\boldsymbol {u}_\zeta \rightarrow u_\infty$. Here
 $\boldsymbol {u}_{p}$ is the gradient of a potential
 $\phi _p$, satisfying Laplace's equation
 \begin{equation} \nabla^2\phi_p=0. \end{equation}
Therefore,
 \begin{equation} \boldsymbol{\nabla}\times \boldsymbol{u}=\boldsymbol{\nabla}\times\boldsymbol{u}_\zeta=\boldsymbol{\zeta}, \end{equation}
with
 \begin{equation} \nabla^2\boldsymbol{u}_\zeta=-\boldsymbol{\nabla}\times\boldsymbol{\zeta}. \end{equation}
The vorticity  $\boldsymbol {\zeta }$ in the inflow turbulence moves with the fluid particles. It is subject to compression, extension and rotation of the vortex lines as they are convected along the diverging streamlines of the mean flow in the induction zone of the actuator disc. This results in distortion of
 $\boldsymbol {u}_{\zeta }$ that can be calculated by integrating (5.4) over the flow field. The potential part
 $\boldsymbol {u}_{p}$ of the fluctuating flow field is that which is associated with the pressure field due to the blocking action of the disc. This part can be calculated from solutions of the Laplace equation (5.2), satisfying boundary conditions on
 $\boldsymbol {u}(x=0)$ at the disc.
Using the above split, in the following sections the theoretical framework for predicting the intensity of the streamwise component  $u$ of the fluctuating velocity through the induction zone is established. This is on the basis that the fluctuating axial force induced on a high tip-speed ratio rotor, as well as on porous discs, is dominated by this velocity component. The incident free-stream turbulence is assumed to be uniform and statistically homogeneous. In the absence of the disc, the turbulence intensity
 $\overline {u^2}_{\infty }$ and length scale
 $L_{x\infty }$ may be taken as constant. We note that this assumption is expected to be appropriate for large commercial scale wind turbines, but less so for smaller turbines since in the shear dominated surface the intensity and length scales both change strongly with height. The turbulence will be taken to be specified by its value at the location of the centre of the actuator disc in its absence. Additionally, the disc axis will be assumed to be aligned with the mean wind direction. Before presenting the general case, asymptotic conditions are first considered. These correspond respectively to the cases of very small and very large ratios of turbulence length scale to disc diameter.
5.1. Calculation of the effects of distortion and blocking when  $L_{x\infty }/D \gg 1$

If the turbulence length scale is much larger than the length scale  $D$ of the disc, distortion becomes negligible (Graham Reference Graham2017) and, therefore,
 \begin{equation} u_{\zeta} \rightarrow {u}_{\infty}. \end{equation}
Also, for  $L_1\gg 1$, the potential flow field due to the disc resistance to the turbulence reverts to a quasi-steady extension of the mean flow (Mann et al. Reference Mann, Peña, Troldborg and Andersen2018). Therefore, for
 $x\le 0$, the perturbation to the fluctuating flow on the upstream axis due to disc resistance is
 \begin{equation} u_p=-a_0\left(1+\frac{x}{\sqrt{R^2+x^2}}\right)u_{\infty}. \end{equation}
Hence, the velocity on the upstream axis is
 \begin{equation} u=\left[1-a_0\left(1+\frac{x}{\sqrt{R^2+x^2}}\right)\right]u_{\infty}. \end{equation}
Equation (5.6) provides the quasi-steady prediction for the perturbation due to blocking of the time-dependent flow field of the disc. It is what is normally assumed for predicting the turbulence in the induction zone and also the unsteady rotor forces that the turbulence induces. The combination, (5.7), of quasi-steady perturbation with undistorted incident turbulence has been found to give reasonably good agreement with measured data (Mann et al. Reference Mann, Peña, Troldborg and Andersen2018) when  $L_{x\infty } > D$.
This has typically been assumed to be the case for all wind turbines in the turbulent ABL. However, with blade lengths of large offshore wind turbines now exceeding  $100\ {\rm m}$ this condition is not always fulfilled by the ABL turbulence. It is even less applicable within large wind farms containing large amounts of wake turbulence. Further, stratification can significantly reduce the integral length scales and the streamwise intensity under stable conditions typical of night time. In these cases, the
 $L_{x\infty }/D \lesssim 1$ regime can be more easily achieved. Here
 $L_{x\infty }$ may also not be greater than
 $D$ for many cases of horizontal axis turbines in relatively shallow turbulent flows, which can occur in certain ABLs and tidal streams (e.g. Milne et al. Reference Milne, Sharma, Flay and Bickerton2013; Milne, Sharma & Flay Reference Milne, Sharma and Flay2017; Milne, Graham & Coles Reference Milne, Graham and Coles2021).
5.2. Calculation of the effects of distortion and blocking when $L_{x\infty }/D\ll 1$

Next we consider the other extreme of small length-scale turbulence. This is a less realistic case but applies to some tests that have been carried out in grid turbulence within the literature (Ebdon et al. Reference Ebdon, Allmark, O'Doherty, Mason-Jones, O'Doherty, Germain and Gaurier2021; Slama et al. Reference Slama2021). It is of theoretical interest because it is a case of rapid flow expansion that satisfies the conditions for the classical RDT theory (Batchelor & Proudman Reference Batchelor and Proudman1954) and analytic results can be obtained.
When  $L_{x\infty }/D\ll 1$, the distortion of the whole turbulent vorticity field that generates the distorted velocity at any given point may be considered to be locally homogeneous. The RDT theory (Batchelor & Proudman Reference Batchelor and Proudman1954) for turbulent flow through a contracting duct,
 $c>1$, applies directly. However, many of the effects are reversed since the range is
 $0.5< c<1$. (The theory is not applicable to high induction coefficient flows for which
 $c<0.5$ because of wake instability Castro Reference Castro1971). When the turbulence length scale is very small, the distortion applies locally. The spectrum of the distorted turbulence at any point along the axis upstream of the rotor depends only on the ratio of the mean axial velocity
 $U(x)$ at that point to the free-stream velocity. Therefore, the distortion depends only on the local value of
 $a(x)$. At the disc face
 $(x = 0)$, actuator disc theory predicts uniform streamwise mean velocity. It follows that the distortion is constant over the whole face of the disc, with
 $a(r)=a_0$ for all
 $r< R$.
Following the analyses of Batchelor & Proudman (Reference Batchelor and Proudman1954), also repeated in Graham (Reference Graham2017), the ratio  $\mu (a_0,\kappa )$ of the triple-wavenumber spectrum of the streamwise turbulent velocity after distortion to that far upstream before distortion is
 \begin{equation} \mu=\frac{\varPhi_{11}\left(\kappa\right)}{\varPhi_{11\infty}\left(\kappa_\infty\right)}=\frac{\kappa^4_\infty}{\kappa^4}. \end{equation}
Here,  $\kappa$ is now the vector of distorted wavenumbers
 $(\kappa _1,\kappa _2,\kappa _3)$ and
 $\kappa _\infty$ the vector of corresponding undistorted wavenumbers. Due to compression of the waves, the slowing and diverging mean flow increases the axial wavenumbers. The transverse wavenumbers are decreased by the associated transverse expansion. The relations are
 $\kappa _1=\kappa _{1\infty }/c$,
 $\kappa _2= \sqrt {c}\kappa _{2\infty }$,
 $\kappa _3= \sqrt {c}\kappa _{3\infty }$ and, therefore,
 $\tau =\sqrt {\kappa _2^2 + \kappa _3^2}=\sqrt {c}\tau _\infty$. The subscript
 $\infty$ designates undistorted far upstream values and
 $c(x)$ is the local contraction coefficient at any point
 $x\leq 0$ along the axis.
Because turbulence of a small length scale  $L_{x\infty }\ll D$ decays significantly through the streamwise length of the inflow region of the rotor disc
 $(\sim D)$, the reference undistorted turbulence state, for example, the intensity
 $\overline {u_\infty ^2}$, is therefore taken to be the state that it would have had at the location
 $x=0$ of the disc in its absence.
After distortion, for  $L_{x\infty }\rightarrow 0$, the frequency spectrum,
 $S_{11}(\kappa _1)$, can be computed by integrating
 $\varPhi _{11}$ over
 $\kappa _2$ and
 $\kappa _3$, either by numerical integration or by evaluating the integral analytically in terms of hypergeometric functions. It is more straightforward to evaluate the mean square intensity analytically. By integrating the triple-wavenumber spectrum of the turbulence over all three wavenumbers in polar coordinates, the following analytic expression (Batchelor Reference Batchelor1960, p. 73, equation (4.3.17)), is obtained:
 \begin{equation} \frac{\overline{u^2_{\zeta}}}{\overline{u^2_{\infty}}} = \frac{3}{4c^2}\left\{\frac{\beta^2-1}{\beta^3}\tan^{-1}\beta + \frac{1}{\beta^2}\right\}. \end{equation}
Here  $\beta ^2= 1/{c^3}-1 = 1/(1-a)^3-1$. This result is due to distortion only and does not consider the blocking
 $u_p$, which is only effective at or very close to the disc face in this limit. It shows that distortion increases the streamwise intensity.
The effect of blocking is now considered. For small turbulence length scales, except close to the outer edge (blade tips), the flow passing through the disc senses its blocking effect locally as a uniform porous sheet of resistance over the plane  $x = 0$. Analysis to predict the effect of a sheet of resistance (such as a wire-mesh gauze) of effectively infinite extent on a turbulent flow passing through it has been given by Batchelor (Reference Batchelor1960, p. 61). This analysis, in addition to the resistance pressure jump imposed across the sheet, allows for a specified degree of refraction of the streamlines passing through it. The actuator disc model used here is assumed to exert only resistance to the flow with no refraction of streamlines at the disc. To calculate the blocking potential flow caused by the disc, the analysis is applied as for the gauze, but with the following changes.
(i) The axial mean velocity through the actuator disc is
$(1-a_0)U_\infty$, instead of the value of $U_\infty$ for an infinite gauze (or, equivalently, a gauze across a duct). This is to account for the effect of the finite extent of the disc on the mean flow.(ii) In the far wake, where the pressure field returns to ambient, the axial mean velocity is now
$(1-2 a_0)U_\infty$ rather than $U_\infty$ for the infinite gauze. This accounts for the mean flow wake of the disc.(iii) The pressure depends on
${\partial \phi }/{\partial t}$ and, hence, on the frequency $\omega$ of each wavenumber component that remains invariant, unaffected by distortion. However, the axial wavenumber changes from $\kappa _{1\infty }$ to $\kappa _1={\kappa _{1\infty }}/({1-a_0})$ and the transverse wavenumbers change to $\kappa _2=\sqrt {1-a_0}\kappa _{2\infty }$ and $\kappa _3=\sqrt {1-a_0}\kappa _{3\infty }$ due to the distortion, following the assumptions of RDT theory for small-scale turbulence convecting through a contracting or expanding mean flow.


Assuming weak turbulence ( $u/U\ll 1$), the linearised equations for the fluctuating pressures either side of the disc are
 \begin{gather} \left\{\frac{\partial}{\partial t}+U\frac{\partial}{\partial x}\right\}\phi_1=\frac{1}{\rho}(\,p_\infty-p_1)+(U_\infty-U)u_{1\infty}, \end{gather}
 \begin{gather} \left\{\frac{\partial}{\partial t}+U\frac{\partial}{\partial x}\right\}\phi_2=\frac{1}{\rho}(\,p_\infty-p_2)+(U_w-U)u_{2\infty}, \end{gather}
where  $U=(1-a_0)U_\infty$ at the disc,
 $U_w=(1-2a_0)U_\infty$ in the wake and subscripts 1 and 2 refer to
 $x\le 0$ and
 $x\ge 0$, respectively. The linearised equation for the fluctuating pressure jump
 $\Delta p=(\,p_1-p_2)$ at the disc is
 \begin{equation} \Delta p ={\rho}KU\left(u_{1\infty}+\frac{\partial\phi_1}{\partial x}\right), \end{equation}
where  $K={4a_0}/{(1-a_0)}$ and
 $\phi _1$ and
 $\phi _2$ are the fluctuating velocity potentials of the perturbation
 $u_p$ on the upstream and downstream side, respectively, caused by the resistance of the disc. The velocity components satisfy mass-flow continuity for the upstream and downstream velocities. Hence,
 $\nabla ^2\phi _j=0$ and
 $\partial u_{j\infty }/\partial x +\partial v_{j\infty }/\partial y + \partial w_{j\infty }/\partial z=0$ for
 $j=1$ and 2. Also velocities are continuous through the disc. Hence,
 $u_{1\infty }+\partial \phi _1/\partial x=u_{2\infty }+\partial \phi _2/\partial x$ and correspondingly for the transverse directions. The velocity
 $u_{1\infty }= u_\zeta$, the incident velocity after distortion, which can be written as
 \begin{equation} u_{\zeta}=\hat{u}_{\zeta}\exp({{\rm i}(\omega t-\kappa_1 x-\kappa_2 y-\kappa_3 z)}). \end{equation}
Therefore, since  $\phi _1$ and
 $\phi _2$ satisfy the Laplace equation as above,
 \begin{gather} \phi_1=\hat{\phi}_1\exp({\tau x+{\rm i}(\omega t-\kappa_2 y-\kappa_3 z)}), \end{gather}
 \begin{gather} \phi_2=\hat{\phi}_2\exp({-\tau x+{\rm i}(\omega t-\kappa_2 y-\kappa_3 z)}), \end{gather}
where  $\widehat {\phi _j}$ is the amplitude of
 $\phi _j$. Assuming that Taylor's hypothesis is valid upstream of the disc's effective induction zone, the frequency
 $\omega =\kappa _{1\infty }U_\infty$ (
 ${\rm rad}\ {\rm s}^{-1}$). Taylor's hypothesis is considered to be fairly accurate in homogeneous turbulence in a flow with no mean shear such as is the case for the present grid turbulence, but it is less certain where there is mean shear such as in the ABL. Favre, Gaviglio & Dumas (Reference Favre, Gaviglio and Dumas1967) have measured space–time correlations of turbulent velocity in a boundary layer and shown that Taylor's hypothesis is reasonable in this turbulent shear flow for the lower wavenumber components of the turbulence and with a mean velocity near the middle of the boundary layer taken as the appropriate convection velocity. We assume this to be the case for the present ABL measurements and take the mean velocity at the hub height as the convection velocity. The component of the fluctuating streamwise velocity at each wavenumber
 $\kappa$ incident at the disc after distortion can therefore be written as
 \begin{equation} u_{\zeta}=\hat{u}_{\zeta}\exp({{\rm i}(\kappa_{1\infty}U_\infty t-\kappa_1 x-\kappa_2 y-\kappa_3 z)}), \end{equation}
with  $(\kappa _1, \kappa _2, \kappa _3)$ now being the wavenumbers after the effect of distortion,
 $=(c^{-1}\kappa _{1\infty }$,
 $\sqrt {c}\kappa _{2\infty }$,
 $\sqrt {c}\kappa _{3\infty })$. A solution can be obtained from the above set of equations, (5.10)–(5.15), for the potential
 $\phi _1(x)$ of the ‘backflow’ induced by the pressure field upstream of the disc. It follows that the backflow velocity is given by
 \begin{equation} u_{p}\left(x\right) = \frac{\partial\phi_1}{\partial x}=\frac{-a_0\tau\left(\tau-{\rm i}\kappa_1\right)\hat{u}_{\zeta}\left(0\right)}{\tau^2-2{\rm i} a_0\kappa_1\tau+\kappa_1\kappa_{1\infty}} {\rm e}^{\tau x}\exp({{\rm i}\left(\omega t-\kappa_2 y-\kappa_3 z\right)}). \end{equation}
Combining the two effects, the total streamwise fluctuating velocity wavenumber component  $u(x,\kappa )$ at
 $x \le 0$ on the upstream axis of the rotor is obtained as the sum of the component amplitudes
 $\hat {u}_{\zeta }$ and
 $\hat {u}_{p}$,
 \begin{align} u\left(x\right) &=
\left[\hat{u}_{\zeta}\left(x\right) \exp({-{\rm i}\kappa_1
x}) - \frac{a_0\tau\left(\tau-{\rm
i}\kappa_1\right)\hat{u}_{\zeta}\left(0\right)}{\tau^2-2ia_0\kappa_1\tau+\kappa_1\kappa_{1\infty}}
\exp({\tau x-{\rm i}\omega T})\right]\notag\\ &\quad \times \exp({{\rm
i}\left(\omega t-\kappa_2 y-\kappa_3 z\right)}).
\end{align}
There is a time difference  $T$ between the two terms on the right-hand side of (5.18). This arises due to the time for convection between the evaluation point
 $x$ on the upstream axis and the disc face at which the blocking potential flow field is generated. Since incompressible flow is assumed, this pressure field is generated throughout the flow without any propagation time lag. The effect of
 $T$ is small except at high frequency and will be neglected here.
5.3. Calculation of the effects of distortion and blocking in general length-scale cases
The total fluctuating streamwise velocity  $u(x,t)$ in the inflow region is a typical measurement made in both the field and wind tunnel tests. Evaluating the distorted velocity
 $u_{\zeta }(x,t)$ for intermediate length-scale ratios
 $L_{x\infty }/D$ is however computationally expensive. Therefore, values have been obtained here by interpolating between the two limits
 $L_{x\infty }/D\rightarrow 0$ and
 $L_{x\infty }/D\rightarrow \infty$.
The largest distortion effect occurs at the low frequency end of the spectrum. Since the spectrum is flat here, the ratio of post-distortion spectrum to pre-distortion spectrum for zero frequency, which is less computationally expensive to calculate (Graham Reference Graham2017), is used as the function to interpolate the post-distortion spectra. The intensities for general length-scale ratios and values of induction factor are interpolated between the limiting case of the spectrum  $S^B_{11}(\kappa _1)$ derivable from the Batchelor (Reference Batchelor1960) theory for
 $L_{x\infty }/D\ll 1$ and the undistorted free-stream spectrum
 $S_{11\infty }(\kappa _1)$, which applies when
 $L_{x\infty }/D\gg 1$:
 \begin{equation} S^\zeta_{11}(\kappa_1)=g_0S^B_{11}(\kappa_1)+(1-g_0)S_{11\infty}(\kappa_1). \end{equation}
The interpolation function  $g_0$ is given by
 \begin{equation} g_0(L_{x\infty}/D)=0.8(\,f_0(L_{x\infty}/D)-1), \end{equation}
where
 \begin{equation} f_0(L_{x\infty}/D)=\frac{S^\zeta_{11}(\kappa_1=0)}{S_{11\infty}(\kappa_1=0)} \end{equation}
and  $f_\kappa (x)$ represents the distortion factor at
 $x$. The factor
 $0.8$ normalises the limiting value,
 $(1/c^2 - 1)$, of the right-hand side when
 $L_{x\infty }/D=0$.
Values of  $f_0(L_{x\infty }/D)$ have been computed and presented (see Graham Reference Graham2017, figure 8) for a range of
 $L_{x\infty }/D$ when
 $a_0=1/3$. For small turbulence length scales and
 $a_0 = 1/3$,
 $f_0(L_{x\infty }/D\rightarrow 0) \rightarrow 1/c^2 =1/(1-a_0)^2 = 2.25$. For large length scales,
 $L_{x\infty }/D \gg 1$,
 $f_0 \rightarrow 1.0$, for all
 $a_0$. A rational approximation of the function
 $g_0(L_{x\infty }/D)$ over the range
 $0\le L_{x\infty }/D \le 5$ is
 $$\begin{align} & g_0(L_{x\infty}/D)
\nonumber\\ &\quad =\frac{-0.24346L_D^5 + 1.01543L_D^4 -
3.0913L_D^3 + 1.65344L_D^2 - 0.02736L_D +
1.0251}{-1.81856L_D^5 + 5.55776L_D^4 - 14.8328L_D^3 +
14.0444L_D^2 - 3.1816L_D + 1.0},
\end{align}$$
where  $L_D$ is
 $L_{x\infty }/D$ and noting that a pole near
 $L_D = 1.1$ must be avoided.
Streamwise root-mean-square (r.m.s.) ratio upstream of an actuator disc, induction factor  $a_0=1/3$. Ratio
 $L_{x\infty }/D$ marked on curves. Top (red), thick solid line:
 $L_{x\infty }/D\rightarrow 0$, (5.9); bottom (red) dashed line: quasi-steady, Pena et al. (Reference Pena, Mann and Dimitrov2017),
 $L_{x\infty }/D\rightarrow \infty$; thin solid black lines: interpolation 1, interpolation of both distortion and blocking; thin dash-dotted black lines: interpolation 2, (5.30).

Equation (5.19) with (5.21) and (5.22) satisfies the necessary limit conditions for the interpolated velocity spectra, specifically
 \begin{gather} S^\zeta_{11}(L_{x\infty}/D,c=2/3,\kappa_1=0)=\frac{1}{c^2} S_{11\infty}(\kappa_1=0), \end{gather}
 \begin{gather} S^\zeta_{11}(L_{x\infty}/D\rightarrow\infty,c,\kappa_1)= S_{11\infty}(\kappa_{1\infty}), \end{gather}
 \begin{gather} S^\zeta_{11}(L_{x\infty}/D\rightarrow 0,c,\kappa_1)= S_{11,0}(\kappa_1), \end{gather}
 \begin{gather} S^\zeta_{11}(L_{x\infty},c,\kappa_1\rightarrow\infty)\sim\rightarrow S_{11\infty}(L_{x\infty},c,\kappa_1\rightarrow\infty). \end{gather}
The mean square intensity is then obtained by integrating (5.19) for the spectrum  $S^\zeta _{11}(\kappa _1)$, noting that the interpolation function
 $g_0$ is independent of wavenumber and using the triple-wavenumber spectrum integration result in (5.9). Hence, the interpolated mean square intensity due to distortion alone is
 \begin{equation} \frac{\overline{u_{\zeta}^2}}{\overline{u_{\infty}^2}} =\frac{3g_0}{4\beta c^2(x)}\left[\left(1-\frac{1}{\beta^2}\right)\tan^{-1}\beta+\frac{1}{\beta}\right]+ 1 - g_0. \end{equation}
Equation (5.27) evaluated at  $x=0$, and therefore, with
 $c(x) = c_0$, provides a prediction of the intensity of the incident turbulence impacting the rotor disc.
We now consider the effect on the intensity in the induction zone of the perturbation velocity component  $u_p$ due to the blocking by the resistance of the disc. Here
 $u_p$ has been derived for very small length scales in (5.17) using the gauze theory of Batchelor (Reference Batchelor1960). Since this expression depends on wavenumber, when added to
 $u_\zeta$, (5.18), it must be multiplied by its complex conjugate and integrated over all three wavenumbers to obtain the mean square intensity for the limiting case
 $L_{x\infty }/D\rightarrow 0$. The result is plotted as a solid red line for the root mean square (r.m.s.) in figure 8. For the largest length-scale ratios, the blocking perturbation tends towards the backflow given by quasi-steady theory and
 $u_\zeta \rightarrow u_\infty$ unaffected by distortion. Therefore, (5.27) is multiplied by a factor
 $(1 - a(x))^2$ that is independent of wavenumber, so the same factor therefore applies to the mean square intensity. The result of this is shown in figure 8 as the red dashed line for the largest length-scale ratio
 $L_{x\infty }/D=4.0$. It shows that a strong reduction in intensity is generated as the disc is approached, far stronger than the very small increase due to distortion effect for this comparatively large length scale.
Between these two length-scale limits the backflow  $u_p$ due to resistance may be interpolated as has been done for the distortion of
 $u_\zeta$. For this, we have used a simple exponential interpolant
 ${\rm e}^{-L_{x\infty }/D}$ between (5.17) for
 $L_{x\infty }=0$ and (5.6) for
 $L_{x\infty }\rightarrow \infty$. The results of doing this for
 $\sqrt {\overline {u^2}}$, which will be referred to as interpolation 1, are plotted as solid black lines in figure 8 for the range of turbulence length-scale ratios
 $L_{x\infty }/D$ shown on the curves. The results for the ratios 0.01 and 0.1 are slightly above the ratio equal to
 $0$ limiting curve because there is a small initial rise in
 $f_0(L_{x\infty }/D)$ (figure 8, Graham Reference Graham2017).
Interpolation 1 is also shown compared with the measured  $\sqrt {\overline {u^2}}$ data from the wind tunnel experiments in figure 9, for two estimates of the disc/rotor induction factor
 $a_0$: (a,c,e) the discs or rotor in ABL, and (b,d,f) the discs or rotor in grid turbulence, i.e. thin dashed red lines are for
 $a_0$ given directly from the mean thrust force measurements and blue solid lines for
 $a_0$ obtained by fitting equation (3.1) to the hot-wire measured data. In the ABL (figure 9a,c,e), i.e. the larger length-scale ratio cases, the effect of distortion is small and only the strong reduction due to
 $u_p$ blocking is apparent. In figure 9(b,d,f), for grid turbulence cases, i.e. the smallest length-scale ratios, a large increase in intensity occurs due to distortion as the axial location approaches the disc. The increase is followed by a rapid fall in intensity due to the blocking that occurs just ahead of the disc over a distance similar in size to the length scale
 $L_x$ of the turbulence. This is to be expected since, apart from close to the edge of the disc, the potential flow response to small-scale turbulence eddies will be local and, therefore, on a scale proportional to
 $L_{x\infty }$.
Streamwise r.m.s. velocity normalised by the no rotor/no disc mean velocity, for rotor and both discs in (a,c,e) ABL and (b,d,f) grid turbulence flows. Circular marker: hot-wire data; solid blue line: interpolation 1, i.e. interpolation of both distortion and disc resistance potential flow, using  $a_0$ given by fitting actuator theory to the hot-wire data; thin dashed red line: interpolation 1, i.e. interpolation of both distortion and disc resistance potential flow, using
 $a_0$ given by thrust measurements; thick dashed black line: interpolation 2, i.e. (5.30) requiring no numerical integration, using
 $a_0$ from thrust measurements; thin dash-dotted green line: quasi-steady approximation with distortion given by interpolation for the relevant
 $L_x/D$; dotted magenta line: quasi-steady approximation without any distortion assumed.

In order to avoid evaluation by numerical integration, an interpolation based on length scale between the large length-scale quasi-steady formula for the potential flow blocking field ahead of the disc and (5.17) for small length scale is proposed.
To do this, we modify (5.7) for the induction  $a(x)$ by replacing the disc radius length scale
 $R$ in this equation by a new length scale
 $R_L$, which varies smoothly over the range of
 $L_{x\infty }/D$ with the same exponential variation as used for interpolating the resistance
 \begin{equation} R_L = R(1-{\rm e}^{-L_{x\infty}/D}), \end{equation}
in (5.7) which is therefore modified to
 \begin{equation} u \rightarrow \left[1-a_0\left(1+\frac{x}{\sqrt{R_L^2+x^2}}\right)\right]u_{\infty}. \end{equation}
Inserting it as the squared factor in (5.27) then gives the following formula for intensity in the induction zone:
 \begin{align} \frac{\overline{u^2}}{\overline{u_{\infty}^2}}=\left[1-a_0\left(1+\frac{x}{\sqrt{R_L^2+x^2}}\right)\right]^2 \left\{\frac{3g_0}{4\beta c^2(x)}\left[\left(1-\frac{1}{\beta^2}\right)\tan^{-1}\beta+\frac{1}{\beta}\right]+(1-g_0)\right\}. \end{align}
The results of using (5.30), referred to here as interpolation 2, are shown as black dash-dot lines in figure 8 for all the length-scale ratio cases labelled. Equation (5.30) agrees with the limiting cases for the largest and smallest length-scale ratios. The agreement between the two methods is not perfect close to the disc over the mid-range of length-scale ratios but they are equally close to the measured results in figure 9 at distances where the measurements were taken. It should be noted that the modification  $R\rightarrow R_L$ causes no change at the disc face
 $x=0$ and, therefore, has no influence on force prediction.
The above evaluation of the axial velocity component of the turbulence for a range of turbulence length-scale ratios has been developed mainly to provide a basis for predicting the fluctuating axial forces on a rotor due to the impact of the turbulence. But the two interpolation methods given are also intended to provide information about the fluctuating wind velocity in the near region upstream of a rotor to help in interpretation of LiDAR and wind monitoring measurements in this region. The results only apply to the upstream flow and in a region reasonably close to its axis. A similar approach based on the actuator disc model might be applied downstream but effects of blade wakes and downstream swirl would also have to be considered.
6. Prediction of axial force spectra induced on an actuator disc
The axial forcing on an actuator disc in response to the turbulent flow field is now considered. The pressure difference across the disc is given by
 \begin{equation} \Delta p=\rho K\left(x=0\right)\left\{u_{\zeta}(0)+\frac{\partial\phi_1}{\partial x}\right\}U =\rho K(1-a_0)\left\{u_{\zeta}(0)+\frac{\partial\phi_1}{\partial x}\right\}U_\infty. \end{equation}
Spectra of fluctuating axial force on the disc may be calculated by integrating the pressure drop  $\Delta p$ over the whole disc.
Actuator disc theory predicts that the mean velocity is uniform over the disc at the disc face,  $x=0$, although not so for
 $x<0$. Therefore, in the limit
 $L_{x\infty }/D\rightarrow 0$ the distorted streamwise turbulence will again be statistically uniform over the disc when it reaches the face. We will assume this also for the purposes of computing axial force spectra for cases with larger values of
 $L_{x\infty }/D$. However, it is recognised that in reality tip/boundary effects on the disc and vertical shear in the ABL mean that this is not exactly true.
For  $L_{x\infty }/D\gg 1$, the fluctuating loading (minus the time-mean loading) at any point
 $(y,z)$,
 $\sqrt {y^2+z^2}\le R$, on the disc is given by the quasi-steady approximation. In this case,
 $\partial {\phi _1}/\partial {x} =-a_0 u_{1\zeta }(0)$ and, therefore,
 \begin{align} \Delta p(y,z,t)&=\rho Ku(x=0,y,z,t)U \nonumber\\ &=4a_0(1-a_0)\rho u_{\zeta}(0,y,z,t)U_\infty\nonumber\\ &=4a_0(1-a_0)\rho U_\infty\hat{u}_{\zeta}\exp({{\rm i}(\omega t-\kappa_2y-\kappa_3z)}) \end{align}
for each wavenumber component  $(\kappa _1, \kappa _2, \kappa _3)$.
Therefore, the axial force
 \begin{equation} \widehat{F_x}{\rm e}^{{\rm i}\omega t}=4a_0(1-a_0)\rho U_\infty\hat{u}_{\zeta} {\rm e}^{{\rm i}\omega t}\iint_A{\rm e}^{-{\rm i}(\kappa_2y+\kappa_3z)}\,{\rm d}A, \end{equation}
where  $A$ is the area of the disc. The integral over
 $A$ can be evaluated by taking axes
 $(s,n)$ with origin at the centre of the disc and with
 $s$ aligned with the direction of the component wavenumber
 $\tau$ and
 $n$ normal to it. Referring to figure 10,
 $\kappa _2=\tau \cos \theta$ and
 $\kappa _3=\tau \sin \theta$, where
 $\theta$ is measured from the
 $\kappa _2$ axis. For any given
 $s$ on the disc,
 $\Delta p(s)$ is independent of
 $n$ for
 $-\sqrt {(R^2-s^2)}\leq n\leq \sqrt {(R^2-s^2)}$. Therefore, integrating for each transverse wavenumber component over the disc gives
 \begin{equation} \iint_A{\rm e}^{-{\rm i}(\kappa_2y+\kappa_3z)}\,{\rm d}A=2\int_{-R}^R \sqrt{R^2-s^2} {\rm e}^{{\rm i}\tau s}\,{\rm d}r=2{\rm \pi} R\frac{{\rm J}_1(\tau R)}{\tau} \end{equation}
and, therefore,
 \begin{equation} \widehat{F_x}{\rm e}^{{\rm i}\omega t}=8{\rm \pi}\rho a_0(1-a_0)\hat{u}(0)U_\infty\frac{{\rm J}_1(\tau R)}{\tau R} {\rm e}^{{\rm i}\omega t}, \end{equation}
where  ${\rm J}_1$ is a Bessel function of the first kind.
Schematic of integration of Fourier wave component over disc.

At the other limit,  $L_{x\infty }/D\ll 1$,
 $u$ is given by (5.18), which for zero frequency,
 $(\kappa _1=0)$, is identical to (5.29). We can therefore follow a similar procedure as used to obtain (5.29) to predict the axial force spectra for the discs and rotor when applying (5.18).
For turbulence generated by the grid that is statistically axisymmetric, the triple-wavenumber spectrum of axial loading on the actuator disc depends only on the transverse wavenumber  $\tau\, (=\sqrt {\kappa ^2_2+\kappa ^2_3})$. The integration can therefore be carried out axisymmetrically with respect to
 $\tau$. On the other hand, the turbulence in the simulated ABL, which is assumed for the present calculations to be statistically homogeneous over the disc is not axisymmetric as represented by the empirically modified version of the von Kármán triple-wavenumber spectrum of (4.10). It is therefore necessary in these cases to carry out the wavenumber integration in polar form
 $\kappa _2=\tau \cos \theta$ and
 $\kappa _3=\tau \sin \theta$, integrating over the disc with respect to
 $\theta$ first and then the transverse wavenumber
 $\tau$.
If  $L_{x\infty }/D\rightarrow \infty$ the inflow turbulence remains undistorted,
 $\hat {u}(0)=\hat {u}_{\infty }$,
 $\tau =\tau _\infty$ and the factor
 ${{\rm J}_1(\tau R)}/{\tau R}\rightarrow 1/2$ since the values of
 $\tau$ give the main contribution to the integral tending to
 $0$. Equation (6.5) then leads to the same result for the axial force spectrum as quasi-steady theory. For intermediate
 $L_{x\infty }/D$, such as the ABL tests, distortion and reduced coherence over the disc do have some effect. In that case,
 $\hat {u}(0)=\hat {u}_{\zeta }$ and
 $\tau =c_0^{1/2}\tau _\infty$ in (6.5). For very small length-scale ratios,
 $L_{x\infty }/D\ll 1$, (6.1) must be integrated over the disc face with
 $\partial \phi _1/\partial x$ given by (5.17). Therefore, the axial force is
 \begin{align} \widehat{F_x}{\rm
e}^{{\rm i}\omega t}&=\rho
K(1-a_0)^2\hat{u}_{\zeta}(0)U_\infty\left\{1-a_0\left[
\frac{c_0^{1/2}\tau_\infty(c_0^{1/2}\tau_\infty-{\rm
i}\kappa_{1\infty})}{c_0^{1/2}\tau_\infty^2-2ia_0c_0^{1/2}\kappa_{1\infty}\tau_\infty+\kappa_{1\infty}^2}\right]\right\}\notag\\
&\quad \times \frac{{\rm J}_1(c_0^{1/2}\tau_\infty
R)}{c_0^{1/2}\tau_\infty R}{\rm e}^{{\rm i}\omega t}.
\end{align}
If
 \begin{equation} \left[\frac{c_0^{1/2}\tau_\infty(c_0^{1/2}\tau_\infty-{\rm i}\kappa_{1\infty})}{c_0^{1/2}\tau_\infty^2-2{\rm i}a_0c_0^{1/2}\kappa_{1\infty}\tau_\infty+\kappa_{1\infty}^2}\right]= \mu_\kappa(a_0,\kappa_{1\infty},\tau_\infty) \end{equation}
then when  $\kappa _{1\infty }\rightarrow 0$,
 $\mu _\kappa \rightarrow 1$,
 $F$ in (6.6) simplifies to the quasi-steady formula of (6.5) but after distortion of
 $\hat {u}_1(0)$ and
 $\tau _\infty$.
The axial force spectrum  $S_{FF}$ for the small wavenumber (grid turbulence) case can be computed by combining (4.1) with (6.6) for the axial force on the disc. After integration with respect to
 $\theta$ from
 $0$ to
 ${\rm \pi} /2$ over all transverse wavenumber directions,
 \begin{align} S_{FF}(\,f)=32{\rm \pi}^2R^4\rho^2a_0^2 C\int_0^\infty\vert1-\mu_\kappa a_0\vert^2f_\kappa^2(0)\left\{\frac{{\rm J}_1(c_0^{1/2}\tau_\infty R)}{c_0^{1/2}\tau_\infty R}\right\}^2\frac{\tau_\infty^{*3}\,{\rm d}\tau_\infty^*}{(1+\kappa_{1\infty}^{*2}+\tau_\infty^{*2})^{17/6}}. \end{align}
Here  $S_{FF}$ is the PSD of the axial force per unit frequency
 $f({\rm Hz})\, (=\kappa _{1\infty }\bar {U}_\infty /2{\rm \pi} )$,
 $f_\kappa$ is the ratio of the amplitudes of the velocity components of the triple-wavenumber velocity spectrum after distortion at the disc to their undistorted values given in (5.19) and (5.21).
For the ABL turbulence, incorporating the modified triple-wavenumber spectrum function (4.10),
 $$\begin{align}
S_{FF}(\,f)&=32{\rm \pi}^2R^4\rho^2a_0^2 C \int_0^\infty\vert1-\mu_\kappa
a_0\vert^2f_\kappa^2(0)\left\{\frac{{\rm
J}_1(c_0^{1/2}\tau_\infty^* R^*)}{c_0^{1/2}\tau_\infty^*
R^*}\right\}^2\nonumber\\
&\quad \times\frac{\tau_\infty^{*3}\left[1-\dfrac{\eta_0}{22}\left(\dfrac{6}{\tau_\infty^{*2}}-\dfrac{5}{(1+\kappa_{1\infty}^{*2})}\right)\right]\,{\rm
d}\tau_\infty^*}{(1+\kappa_{1\infty}^{*2}+\tau_\infty^{*2})^{17/6}}.
\end{align}$$
7. Results and discussion
The wind tunnel measurements are first used to evaluate the predicted turbulence intensities in the induction zone. These intensities, which were computed from integrating the velocity spectra over wavenumber  $\kappa _1$, are shown for all three models in figure 9. The velocity spectra correspond to the length-scale ratios and induction factors
 $a_0$ for each case as previously described. It should be noted that the computations of the turbulence carried out for figure 8 in Graham (Reference Graham2017) assumed axisymmetric distortion. This requires that both the mean velocity field and the incident turbulence are statistically axisymmetric. These conditions are reasonably true for grid turbulence but not for the ABL. However, since in the ABL case the distortion is weak, even though the integrations are influenced by conditions averaged around the axis, the axisymmetric assumptions are reasonable and should not lead to significant errors.
The wind tunnel tests of the discs and rotor in the simulated turbulent ABL show that quasi-steady theory for the disc resistance and blocking effect, together with some allowance for the weak distortion ( $L_{x\infty }/D\sim 1$), gave predictions of axial turbulent velocity (r.m.s.) intensity in reasonably close agreement with the measured data. The comparisons therefore suggest that quasi-steady theory (as suggested by Mann et al. Reference Mann, Peña, Troldborg and Andersen2018) with some accounting for distortion (weak in these cases) is adequate for practical full-scale turbines up to the current rotor diameters (
 $\sim 200\ {\rm m}$). For most practical cases of wind turbine rotors in the ABL (
 $L_{x\infty }>D$), allowing for distortion in the induction zone, the potential blocking flow effect is therefore adequately represented by quasi-steady theory. Agreement is likely to be less good when looking at spectra since distortion tends to increase the lower frequencies while quasi-steady assumption for disc resistance is less accurate at higher frequencies because of omission of the acceleration term. The use of (5.17) based on the Batchelor (Reference Batchelor1960) theory for small-scale turbulence incident on an infinite gauze is more appropriate for small length-scale ratios. This is likely to be the case in tests of model turbines in grid generated turbulence in a wind tunnel as here (
 $L_{x\infty }/D<0.1$).
The computations for a range of length-scale ratios  $L_{x\infty }/D$ as provided in figure 8 show that, for the smaller length-scale ratios for which the effects of distortion are most clearly seen, the intensity of the axial component of turbulence starts to increase due to the distortion at a distance
 $x$ upstream of the disc where
 $-x/D \sim 1$. This is true for the distortion effect at all length scales since it is caused by the mean velocity gradient that scales on the disc diameter. The other major effect is the rapid reduction in intensity of the axial component as the disc is approached due to blocking by its resistance. When the length-scale ratio
 $L_{x\infty }/D$ of the turbulence is small, this effect is local and on the axis appears to start as might be expected, a distance from the disc face proportional to
 $L_{x\infty }$. And this will be true everywhere just in front of the disc not too close to the disc edge. However, if the turbulence length scale is comparable with or larger than the disc diameter,
 $D$, the intensity reduction due to blocking will depend increasingly on the overall geometry and, hence,
 $D$ and the reduction will start at a distance scaling on
 $D$. In larger length-scale ratio cases therefore where the distortion is weak and the blocking that is stronger extends out a distance
 $D$, the latter entirely obscures the former and no increase in intensity is seen. But when the length-scale ratio is small the two effects separate out and an increase due to distortion followed by a sharp reduction due to blocking is clearly seen (figure 8).
Figures 11 and 12 show the comparisons of the predicted and measured normalised force spectra in the ABL and grid turbulence. The spectra are presented in a variance preserving log-linear form that aids in informing the dominant frequencies (scales) underpinning the turbulence intensities. The length scales in the ABL tests gave ratios  $L_{x\infty }/D\ge 0.5$, as typically the case for full-scale turbines in the ABL.
The PSD of the axial force on the rotor, large porous disc and small porous disc in ABL turbulence. Blue, thin solid lines joining markers: load-cell data. Red thick solid line: interpolation 1, i.e. interpolation of both distortion and disc resistance potential flow, using  $a_0$ given by thrust measurements; red dashed line: quasi-steady approximation with distortion; red dash-dotted line: quasi-steady approximation without any distortion assumed; red dotted line:
 $u_p$ blocking (5.17) with distortion. Error bars on the data indicate the data range from repeat runs.

The PSD of the axial force on the rotor, large porous disc and small porous disc in grid turbulence. Blue, thin solid lines joining markers: load-cell data. Red thick solid line: interpolation 1, i.e. interpolation of both distortion and disc resistance potential flow, using  $a_0$ given by thrust measurements; red dashed line: quasi-steady approximation with distortion; red dash-dotted line: quasi-steady approximation without any distortion assumed. Error bars on the data indicate the data range from repeat runs.

All the unfiltered force measurement spectra contain large, narrow-band peaks in the high frequency region due to structural resonances, and blade passing and rotational frequencies in the case of the rotor. For the model tests in the ABL, the input force data has been filtered by a sixth-order low-pass Butterworth filter set at 100 Hz. This was well beyond the frequencies of the main turbulence-induced intensity peak. For the grid turbulence tests, the input force data for the small porous plate was also filtered by the sixth-order low-pass Butterworth filter set at 100 Hz. However, for the rotor and large porous plate, the cutoff frequency had to be lowered to 25 Hz to mitigate as far as possible structural resonances, a slight rotor imbalance at 25 Hz and the lowest frequency  $(30\ {\rm Hz})$ of the large porous disc in pitch. The decision on where to set the filter cutoff was a compromise between maintaining data in the main turbulence-induced intensity peak region and removing as far as possible the unwanted effects of the resonances. Since the intensity peak in this case was at a much higher frequency, the result of the filter cutoff did not remove all of the effects of the structural resonance while also leading to a significant reduction of intensity on the high frequency side of the intensity peak as is apparent in figure 12.
Replacing quasi-steady theory for the blocking by (5.17) (Batchelor Reference Batchelor1960, p. 61, theory) in the ABL cases tested increased the predicted PSDs of force shown in figure 11, both after the same distortion, by about  $15\,\%$. This gives better agreement with the measured results. The expression for
 $u_{p}$ in (5.17) given by this theory becomes the same as quasi-steady theory
 $(u_{p}=-a_0 u(0))$ when
 $\kappa _1\rightarrow 0$. The difference in the expression when
 $\kappa _1>0$ is mainly due to the
 ${\partial \phi _1}/{\partial t}$ acceleration term in the evaluation of a pressure jump across the disc, which is not present in quasi-steady theory. It may therefore be that a correction for the effect of the
 ${\partial \phi _1}/{\partial t}$ term is still required when
 $L_x/D=O(1)$.
The force spectra for the ABL tests shown in figure 11 have been computed taking  $L_{x\infty }=0.31\ {\rm m}$, which is the value given by fitting the empirical correlation curves in figure 6 to the measured data. However, conversion from wavenumber
 $\kappa ^*_{1\infty }$ to frequency used the larger turbulence length scale
 $0.41\ {\rm m}$ given by the zero frequency spectrum intercept (autocorrelation), which gave much better agreement for peak frequencies and amplitudes. The predicted curves have been obtained using the prediction outlined in § 6 with interpolation of distortion and resistance, interpolation 1 equation (6.9), (solid lines), the quasi-steady theory with interpolated distortion (dashed lines) and the quasi-steady theory omitting distortion (dot-dashed lines). The first of these agree reasonably well with the measured spectra for both discs and the rotor while the two quasi-steady curves fall below in each case. The effect of distortion is seen to move the peaks of the spectra towards lower frequencies as expected since distortion is more effective at low frequencies. The quasi-steady predictions of force being lower is at least partly due, as previously discussed, to the absence of the acceleration term in the pressure implicit in the quasi-steady formulae.
The measured spectra for the much smaller-scale homogeneous grid turbulence are compared with those predicted by (6.8) and by the quasi-steady analysis with and without distortion for the relevant length-scale ratio using the interpolation of  $\mu$, (6.7), in figure 12. The predicted curves use, as previously, the length scale
 $L_{x\infty }=0.032\ {\rm m}$ derived from fitting the transverse correlation. In these cases the value derived from the zero intercept of the spectrum (i.e. the autocorrelation) for the relationship between frequency and
 $\kappa _1^*$ was not used for the curves shown since agreement with the measured data is much better if the length scale from the correlation is used throughout. The turbulence intensities are strongly increased by distortion of the small length-scale turbulence, but the most significant effect is the considerable reduction of the integrated fluctuating axial force on the disc due to the much narrower coherence of the turbulent eddies. This leads to a very strong dependence of the peak values of the spectra on the turbulence length scale at a rate approaching the fourth power and quite small changes in turbulence length scales have a large effect. The curves of predicted axial force spectra shown for these three grid cases have therefore been corrected for the small increase
 $(\sim 10\,\%)$ in the transverse length-scale ratios
 $L_y/L_{y\infty }$ taken from the computed values in Graham (Reference Graham2017, figure 9). In the case of the large porous disc a significant underprediction of the peak in the spectrum plot is mainly due to the proximity of the structural resonance frequency as discussed above.
It is apparent from a comparison of the curves for the quasi-steady formulation with and without distortion that its effect is to move the predicted peaks of these force spectra towards lower frequencies. Inspection of the formula for  $\mu$ in (5.8) (Batchelor & Proudman Reference Batchelor and Proudman1954) for the case
 $L_{x\infty }\rightarrow 0$ shows that, since
 $c_0<1$,
 $\mu >1$ when the frequency is low and
 $\mu <1$ when frequency and, hence,
 $\kappa _{1\infty }$ are high so that distortion reduces the PSD of force at high frequencies. This effect is more apparent for small length-scale ratio turbulence than for the more practical range where the turbulence length scale is similar to or greater than the rotor scale.
It should be emphasised that the present predictions treat a rotor as an actuator disc. The individual blade effects are not considered. The predictions of spectra shown here are only valid for frequencies below the blade passing frequency. In the present experiments, particularly for the generally higher frequencies of the grid turbulence cases, the lowest structural resonances (disc pitching) and the frequency of rotor rotation (the large, narrow-band peak at about 25 Hz in the rotor spectrum) occurred close to the high frequency side of the energy peak in the spectrum. The vibration effects are particularly evident in the large disc results at higher frequencies where there is the largest relative disparity between the model and measured spectra. Removing them by filtering affected the shape of this part of the force spectrum. Nevertheless they have shown the appropriateness of a porous disc as a simulation of a rotor to investigate the effects of distortion and blockage. It is not clear why the predicted force spectra in small-scale grid turbulence fit the measured data using the length-scale ratio derived from transverse correlation throughout, while in the larger length-scale ratio ABL cases a better agreement for the position and amplitude of the log-linear spectral peaks is obtained by relating the frequency to dimensionless wavenumber  $\kappa ^*_{1\infty }$ using the frequency spectrum intercept (i.e. autocorrelation).
It is reiterated that there are many potential benefits when using upstream measurements to reduce unsteady loads on wind turbine blades and drivetrains. For a given utility scale wind turbine on flat terrain or the open sea or a tidal turbine, implementation of the model would require knowledge of the rotor induction factor and spatial structure of the turbulence in the free stream. The induction factor could be obtained from standard power or thrust measurements. The turbulence could be measured using an upstream LiDAR (or an ADCP in the case of a tidal turbine; Milne & Graham Reference Milne and Graham2019). Our wind tunnel data suggest that measurements up to approximately  $x/D\approx 2$ ahead of the rotor would be necessary. Given that the low frequency (large scales) are of primary interest, conventional sensors with sampling frequencies of around 1 Hz should be sufficient.
8. Conclusion
Wind tunnel measurements of the streamwise velocity field and axial forces for a fixed-pitch three-bladed model rotor and two porous disc analogues placed in a simulated turbulent ABL and in homogeneous grid turbulence have been presented. The experiments enabled a range of turbulence length scale to disc diameter combinations to be investigated at below-rated conditions. In the grid flow the incident turbulence was found to conform well to the empirical von Kármán spectral model. The incident turbulence in the simulated ABL was based on a formulation using Counihan spires and a long rough surface fetch that has been extensively used in the same wind tunnel for industrial wind engineering. To permit the underlying triple-wavenumber spectrum function to be determined analytically necessitated a practical adjustment to the streamwise coherence to account for the bias between the vertical and horizontal directions.
The new data have been used to evaluate theoretical predictions of the streamwise turbulence intensities in the induction zone and the spectra of the axial force on a rotor. The theoretical framework accounts for the two distinct effects of turbulent distortion and unsteady blockage and invokes the von Kármán spectral model. In the simulated ABL with  $L_{x\infty }/D \sim 1$, quasi-steady theory for the disc resistance and blocking effect, together with some allowance for the weak distortion effects was found to yield predictions in reasonably close agreement with the measured data. For tests of model turbulence in grid generated turbulence, a linearised treatment combining small length-scale rapid distortion of the incident turbulence and a blockage potential based on an infinite gauze is appropriate.
The increase of the intensity due to distortion starts becoming apparent upstream at  $x/D\sim 1$ with the turbulence length scale determining the size of the effect. In contrast, blocking effects are of similar amplitude but extend upstream a distance that is dependent on the length scales of both the turbulence and the disc. For small length-scale ratio cases such as for the grid turbulence tests, blocking effects occur much closer to the disc than the distortion. For the larger length-scale ratio cases, such as those for the ABL, it extends a longer distance upstream of the disc similar to that for the distortion, which being weaker in these cases, is overwhelmed by it.
In ABL flow the normalised force spectra show an increased peak amplitude due to the greater coherence of the turbulence over the disc relative to its diameter. In the case of the much smaller grid turbulence, the small disc shows similarly the largest peak in the normalised force spectrum. There is a reduction of integrated axial disc force intensity in all disc cases that is the result of the much narrower coherence of the turbulent eddies generated by the grid relative to these discs. It is also apparent from the comparisons of predictions with and without distortion that distortion shifts the predicted peaks towards lower frequencies that agree with the measured data.
These wind tunnel results that are fully controlled complement the growing body of evidence for operating turbines in the field. The present results help inform the interpretation of common measurements of turbulence in the induction zone and the dynamic response of the rotor. They have also shown the appropriateness of a porous disc as a simulation of a rotor to investigate the effects of distortion and blockage.
Acknowledgements
We are indebted to EPSRC through grant EP/L024888/1 for access to the National Wind Tunnel Facility (NWTF).
Funding
This research received no specific grant from any funding agency, commercial or not-for-profit sectors.
Declaration of interests
The authors report no conflict of interest.
Appendix A. Performance curve of the rotor
The rotor used in these experiments was tested in non-turbulent wind, first allowing the rotor to free spin, and then progressively applying load through an electromagnetic brake. As the load increased, the rotor slowed down, reaching a peak in power production at just below 1400 r.p.m. at  $10\ {\rm m}\ {\rm s}^{-1}$ (
 $\varLambda = 3.67$), subsequently producing less for lower
 $\varLambda$. The load was removed prior to rotor stall in order to avoid causing cogging in the electromagnetic brake. Torque and r.p.m. were measured continuously, from which power was calculated. The
 $C_P$ vs
 $\varLambda$ curve is shown in figure 13. Turbulence measurements presented in this paper were performed with the rotor maintained at
 $\varLambda = 3.93$, 1500 r.p.m. at
 $10\ {\rm m}\ {\rm s}^{-1}$.
Plot of  $C_P$ vs
 $\varLambda$ for the rotor used in these experiments.

Appendix B. Derivation of modified velocity spectrum function
The relationship of the normalised coherence function  $C_{11\infty }$ to the triple-wavenumber spectrum function
 $\varPhi _{11\infty }$ of a quantity (here the streamwise turbulent velocity) is
 \begin{equation} C_{11\infty}( \Delta y,\kappa_{1\infty})=\frac{\int_0^\infty \int_0^\infty \varPhi_{11\infty}(\kappa_\infty^*)\cos(\Delta y^*\kappa_{2\infty}^*)\,{\rm d}\kappa_{2\infty}^*\,{\rm d}\kappa_{3\infty}^*}{\int_0^\infty \int_0^\infty \varPhi_{11\infty}(\kappa_\infty^*)\,{\rm d} \kappa_{2\infty}^*\,{\rm d}\kappa_{3\infty}^*}, \end{equation}
since the coherence is symmetric with respect to  $\Delta y^*$ the non-dimensionalised horizontal separation
 $(={\Delta y}/{1.339L_{x\infty }})$. There is a corresponding formula for the vertical separation coherence
 $C_{11\infty }(\kappa _{1\infty },\Delta z^*)$.
We write a generally modified spectrum function for streamwise velocity as
 \begin{equation} \varPhi_{11\infty}\left(\kappa_\infty\right) = \frac{\left(1.339L_{x\infty}\right)^2}{4{\rm \pi} U_\infty}\frac{C\overline{u_{1}^2}_\infty(b_1(1+\kappa_\infty^{*2})+b_2 \kappa_2^{*2}+b_3\kappa_3^{*2})}{\left(1+\kappa_\infty^{*2}.\right)^{{17}/{6}}}, \end{equation}
with  $b_1$,
 $b_2$ and
 $b_3$ coefficients to be found. Using standard integral results for the integrals which occur in (B1) gives
 $$\begin{align} C_{11\infty}(\Delta
r,\kappa_{1\infty})&=\frac{1}{\varGamma(5/6)}\left(\frac{(1+\kappa_{1\infty}^{*2})^{1/2}r^*}{2}\right)^{5/6}\nonumber\\
&\quad \times \left\{
\frac{5b_1+3b_2+3b_3}{11}K_{5/6}\left((1+\kappa_{1\infty}^{*2})^{1/2}r^*\right)\right. \notag\\
&\quad - \left. \frac{(3b_1-3b_2)(1+\kappa_{1\infty}^{*2})^{1/2}r^*}{11}K_{1/6}
\left((1+\kappa_{1\infty}^{*2})^{1/2}r^*\right) \right\},
\end{align}$$
where  $\Delta r^*$ is either
 $\Delta y^*$ or
 $\Delta z^*$.
Putting  $b_1=1-\eta (\kappa _{1\infty }^*)$,
 $b_2=1+\tfrac {8}{3}\eta (\kappa _{1\infty }^*)$ and
 $b_3=\tfrac {14}{3}-\eta (\kappa _{1\infty }^*)$ gives
 $$\begin{align} & C_{11}\left(\Delta
y,\kappa_{1\infty}\right)=\frac{2}{\varGamma(5/6)}\left(\frac{(1+\kappa_{1\infty}^{*2})^{1/2}\Delta
y^*}{2}\right)^{5/6} \nonumber\\ &\quad \times \left\{
K_{5/6}\left((1+\kappa_{1\infty}^{*2})^{1/2}\Delta
y^*\right)-\eta(\kappa_{1\infty}^*)\frac{(1+\kappa_{1\infty}^{*2})^{1/2}\Delta
y^*}{2}K_{1/6}\left((1+\kappa_{1\infty}^{*2})^{1/2}\Delta
y^*\right)\right\}
\end{align}$$
and
 $$\begin{align} & C_{11}\left(\Delta
z,\kappa_{1\infty}\right)=\frac{2}{\varGamma(5/6)}\left(\frac{(1+\kappa_{1\infty}^{*2})^{1/2}\Delta
z^*}{2}\right)^{5/6} \nonumber\\ &\quad \times \left\{
K_{5/6}\left((1+\kappa_{1\infty}^{*2})^{1/2}\Delta
z^*\right)-\frac{(1+\kappa_{1\infty}^{*2})^{1/2}\Delta
z^*}{2}K_{1/6}\left((1+\kappa_{1\infty}^{*2})^{1/2}\Delta
z^*\right)\right\}
\end{align}$$
with
 \begin{align} \varPhi_{11\infty}\left(\kappa_\infty\right) = C_0\left\{\varPhi_{11\infty}^{VK}\left(\kappa_\infty^*\right) -\frac{5\eta_0 (1.339 L_{x\infty})^2 L_{x\infty}\overline{u_{1\infty}^2}}{3{\rm \pi} U_\infty} \left[ \frac{1+\kappa^{*2}-\dfrac{11}{3}\kappa_2^{*2}}{(1+\kappa_1^{*2})(1+\kappa^{*2})^{17/6}} \right]\right\} \end{align}
and  $C_0={81}/({81-6\eta _0})$.


 Open access

