1. Introduction
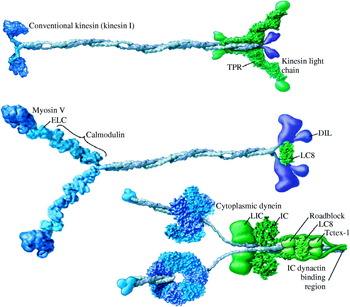
A cell takes in extracellular nutrients and produces many materials such as DNA, RNA, and proteins. It then distributes them to organelles according to their functional demands. How a cell distributes these materials to organelles is an intriguing question. Eukaryotes are known to use a network called the cytoskeleton and molecular motors to transport these materials (Alberts et al. Reference Alberts, Johnson, Lewis, Raff, Roberts and Walter2002). The cytoskeleton is made up of actin filaments, microtubules, and intermediate filaments. Actin filaments and microtubules have their own molecular motors to move along them: myosins move along actin filaments, whereas kinesins and dyneins move along microtubules. The typical structures of these three motors are shown in Figure 1. Each motor has its own direction along the cytoskeleton. Dyneins move toward the (−) end of microtubules, and kinesins move toward the (+) end. Myosin VI moves toward the (−) end of actin filaments, whereas other myosins are currently believed to move in the (+) direction (Wells et al. Reference Wells, Lin, Chen, Safer, Cain, Hasson, Carragher, Milligan and Sweeney1999). These motors convert the energy of ATP hydrolysis into mechanical work (Schliwa & Woehlke, Reference Schliwa and Woehlke2003), taking one nanometer-scale step per ATP consumed (Svoboda et al. Reference Svoboda, Schmidt, Schnapp and Block1993; Schnitzer & Block, Reference Schnitzer and Block1997; Hua et al. Reference Hua, Young, Fleming and Gelles1997).
Structures of conventional kinesin, myosin V, and cytoplasmic dynein. Conventional kinesin, myosin V and dynein form a dimer and walk processively on cytoskeleton. The motor domains involved in binding of cytoskeleton and nucleotide are shown in dark blue, the legs working as mechanical amplifiers in light blue, coiled-coil domain in gray, associated subunits around the tail in green, and cargo-binding domain in purple. The coiled-coil domain, formed by dimerization of alpha helical domains of monomers, connects the head regions, and contains a cargo-binding domain in its tail in kinesin and myosin. Dynein has functional ATP-binding AAA+ domains and the stalk binds to microtubules at the globular end. (Figure modified, with permission, from Vale, Reference Vale2003b.)

The development of single-molecule techniques has contributed much to the understanding of molecular motors (Schliwa & Woehlke, Reference Schliwa and Woehlke2003; Peterman et al. Reference Peterman, Sosa and Moerner2004). Recently, new techniques that can measure the position of fluorophores at the nanometer scale allow research into previously inaccessible areas of molecular motors, such as the stepping mechanism. In this review, we explain the basic principles of three new techniques – Fluorescence Imaging with One Nanometer Accuracy (FIONA), Single-molecule High-REsolution Colocalization (SHREC), and Defocused Orientation and Position Imaging (DOPI). In addition, we present their applications to molecular motors.
2. FIONA
2.1 Basic principles of FIONA
The diffraction-limited full-width at half maximum (FWHM) of the image of an object in conventional microscopy is  λ/2NA, where λ is the wavelength, and NA is the numerical aperture of the collecting lens. For example, the FWHM of light with =500 nm is ∼250 nm with NA=1. However, the center of a fluorophore can be determined to a significantly higher precision by determining the center of the point-spread function (PSF). The center of the PSF is the same as the central position of a fluorophore under proper conditions. Bobroff derived a 1D theoretical equation for locating the center of the PSF (Bobroff, Reference Bobroff1986). Cheezum and colleagues compared four fitting algorithms, and showed that a 2D Gaussian function is the best algorithm to fit images of a single fluorophore (Cheezum et al. Reference Cheezum, Walker and Guilford2001). Thompson and colleagues derived an equation for the uncertainty of localization, and demonstrated it using 30 nm single fluorescent beads (Thompson et al. Reference Thompson, Larson and Webb2002). The uncertainty of the localization (σμ) was derived as
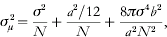
where N is the number of collected photons, a is the effective pixel size of the detector, b is the standard deviation of the background in photons per pixel, and σ is the standard deviation of the PSF. The first term (σ2/N) represents photon noise (or shot noise) that is caused by the statistical nature of photon detection. This photon noise is irreducible and is proportional to the inverse square root of the number of collected photons. This term is the limiting factor in the localization with greater number of photons. The second term (a 2/12N) represents the pixelation noise that is caused by the finite pixel size of the detector. The last term (8πσ4b 2/a 2N 2) represents the background noise and is the limiting factor in the localization with fewer numbers of photons.
Equation (2.1) implies that 1 NMR accuracy can be obtained by collecting more photons and reducing background. However, collecting more photons from an organic fluorescent molecule and reducing background is challenging. These challenges were overcome by Selvin and colleagues (Yildiz et al. Reference Yildiz, Forkey, McKinney, Ha, Goldman and Selvin2003). More than 104 photons from Cy3-labeled DNA, with subsecond integration time were collected, achieving better than 1·5 nm localization accuracy. A high NA objective and an oxygen-scavenging system were used to collect more photons from an organic fluorescent moleucle (Yildiz et al. Reference Yildiz, Forkey, McKinney, Ha, Goldman and Selvin2003). Moreover, total internal reflection fluorescence microscopy (TIRFM) was used to decrease the background (Yildiz et al. Reference Yildiz, Forkey, McKinney, Ha, Goldman and Selvin2003). TIRFM employs an evanescent wave to decrease the illumination depth from the interface between water and a glass surface, reducing the background drastically (Moerner & Fromm, Reference Moerner and Fromm2003). TIRFM is widely used in single-molecule fluorescence studies and in cell biology (Jaiswal & Simon, Reference Jaiswal and Simon2007). Oxygen is the main source of photobleaching and quenching. An oxygen-scavenging system stabilizes organic fluorescent molecules, allowing them to produce more photons and increases the possible observation time.
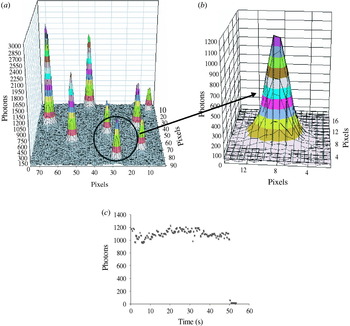
Figure 2 shows a typical PSF of Cy3-labeled DNA immobilized on a coverslip. In total, 14 200 photons were recorded by a CCD camera with 0·5 s integration time, giving 1·3 nm localization accuracy. This Cy3 photobleached in one step shown in Figure 2c, which proves that it is truly a single fluorophore. Single enhanced green fluorescent protein (eGFP) was also imaged using TIRFM, and localized to within 6·9 nm (Snyder et al. Reference Snyder, Sakamoto, Hammer, Sellers and Selvin2004). ReAsH – a fluorescent molecule recently developed as an alternative to GFP (Adams et al. Reference Adams, Campbell, Gross, Martin, Walkup, Yao, Llopis and Tsien2002) – was imaged in the same way, and localized to within 5 nm (Park et al. Reference Park, Hanson, Duff and Selvin2004).
Point-spread function (PSF) of Cy3-labeled DNA and its photons trace. (a) PSFs of several Cy3-labeled DNAs immobilized onto a coverslip. Fluorophores were imaged using objective-type total internal reflection fluorescence microscopy (TIRFM) with 0·5 s integration time. (b) The extended PSF circled in (a). This PSF has a width of 287 nm, 14 200 photons, and a signal-to-noise ratio (SNR) of 32. A Gaussian curve-fitting yielded 1·3 nm accuracy for the localization of Cy3. (c) This Cy3 lasted for 50 s and photobleached in one step, implying that the image contains only a single Cy3.

Although an oxygen-scavenging system improves the photostablity of organic fluorescent molecules, it has shortcomings: the observation times of organic fluorophores are limited due to photobleaching, and organic fluorophores need long integration times (e.g. 0·5 s) to obtain nanometer localization. These shortcomings lead to fundamental limits on long observation and fast imaging. To overcome these limits, two new alternatives can be used: one is using quantum dots (Q-dots), which are brighter and more photostable than organic fluorescent molecules. Single Q-dots have been used to image individual glycine receptors (GlyRs) in the neuronal membrane of a living cell, and they were localized laterally to within 5–10 nm with 75 ms integration time (Dahan et al. Reference Dahan, Levi, Luccardini, Rostaing, Riveau and Triller2003). The other is using multiply labeled fluorescent molecules. Thousands of GFPs have been expressed in S2 cell peroxisomes, allowing the peroxisomes to be localized to within 1·5 nm in 1·1 ms in a living cell (Kural et al. Reference Kural, Kim, Syed, Goshima, Gelfand and Selvin2005). Further improvement of observation times and speed in imaging could be achieved by using new brighter and more photostable fluorescent molecules.
2.2 Application of FIONA to molecular motors
Since FIONA can find the position of a fluorescent molecule with nanometer accuracy, it has been used to measure the nanometer-scale step size of molecular motors – myosin, kinesin and dynein (Yildiz et al. Reference Yildiz, Forkey, McKinney, Ha, Goldman and Selvin2003, Reference Yildiz, Park, Safer, Yang, Chen, Selvin and Sweeney2004a, Reference Yildiz, Tomishige, Vale and Selvinb; Reck-Peterson et al. Reference Reck-Peterson, Yildiz, Carter, Gennerich, Zhang and Vale2006). Step-size measurements have clarified the stepping mechanism of molecular motors. In addition, results obtained by FIONA have been used to answer controversial questions about myosin VI, such as the dimeric state of myosin VI and the reason for the high variable step sizes (Park et al. Reference Park, Ramamurthy, Safer, Travaglia, Chen, Franzini-Armstrong, Selvin and Sweeney2006, Reference Park, Li, Chen, Houdusse, Selvin and Sweeney2007).
2.2.1 Myosin V
Myosin V is the first molecular-motor stepping mechanism which was examined using FIONA. As shown in Figure 1, Myosin V exists as a dimer and has a motor domain, a neck region containing six calmodulin (CaM)-binding sites, and a tail domain. The motor domain has both a catalytic site for ATP hydrolysis and a binding site for actin filaments. The long neck works as a (semi-)rigid lever arm that amplifies the small conformational change in the motor domain into a large movement.
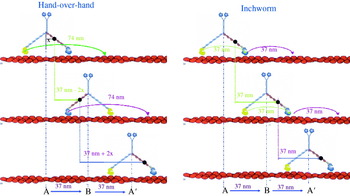
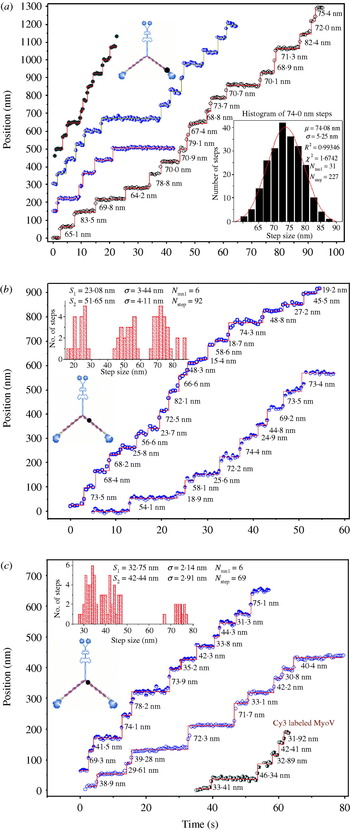
Myosin V was known to be processive and take one ∼37 nm step per ATP consumed (Mehta et al. Reference Mehta, Rock, Rief, Spudich, Mooseker and Cheney1999; Sakamoto et al. Reference Sakamoto, Amitani, Yokota and Ando2000). Owing to this processivity, myosin V can transport melanosomes, mRNA and vesicles (Miller & Sheetz, Reference Miller and Sheetz2000; Reck-Peterson et al. Reference Reck-Peterson, Provance, Mooseker and Mercer2000). Defective myosin V is known to cause pigmentation and neurological diseases in mice and human beings (Vale, Reference Vale2003a). However, the stepping mechanism of myosin V was an enigma. Two competing models were proposed to explain the stepping mechanism of myosin V: the hand-over-hand model and the inchworm model. Figure 3 shows the stepping patterns of each of these competing models. In the hand-over-hand model, two heads take alternate strides and switch their roles as the leading and trailing head at every step. The hand-over-hand model is similar to our walking model. In the inchworm model, the trailing head moves to the position of the leading head at first (shown by a green arrow in Fig. 3). Then the leading head takes a step and binds to the actin filament, which is shown with a violet arrow in Figure 3. Therefore, one head always leads and the other follows. Since a fluorophore-labeled CaM was bound to one of six CaM-binding sites, the measured step sizes are different in the two competing models. The hand-over-hand model predicts alternating 37+2x and 37–2x nm stepping, where x is the projected distance between the center of myosin V and the fluorophore-labeled CaM (assuming the center-of-mass movement is 37 nm). The inchworm model predicts 37 nm stepping regardless of the position of the fluorophore. Figure 4 shows stepping traces of fluorophore-labeled CaM-myosin V, which clearly show alternating 37+2x and 37–2x nm stepping. Myosin V shows 74–0 nm (Fig. 4a), 52–23 nm (Fig. 4b), 42–33 nm (Fig. 4c) stepping depending on the position of the fluorophore-labeled CaM. These stepping traces clearly show that myosin V walks hand-over-hand.
Two competing stepping models of myosin V (hand-over-hand vs. inchworm model). A CaM was labeled with a single fluorophore, and exchanged onto the myosin V light chain domain. Labeled CaM binds to one of six binding positions represented by black dot. In the hand-over-hand model, the trailing head passes by the leading head with the translation of a total of 74 nm, which is shown by a green arrow. Therefore, each head moves alternating 74 and 0 nm steps. If the fluorophore is on the light chain, it is shown to move 37–2x, followed by 37+2x nm, where x is the projected distance between the fluorophore and the center of myosin V. In the inchworm model, the trailing head moves to the position of the leading head shown by a green arrow. Then, the leading head takes a step, which is shown by a violet arrow. Therefore, one head always leads and the other follows. The fluorophore is shown to move 37 nm regardless of the position of the dye.

Stepping traces of myosin V displaying 37+2x and 37–2x stepping. (a) Stepping traces of four different myosin V molecules displaying 74–0 nm steps and a histogram of step size. (b) Stepping traces of two myosin V molecules displaying alternating 52–23 nm steps and a histogram. (c) Stepping traces of three different myosin V molecules displaying alternating 42–33 nm steps and a histogram. These traces support the hand-over-hand stepping model of myosin V.

The step size of molecular motors was determined by calculating the distance between two averaged positions before and after the step measured by FIONA. The accuracy of this method was demonstrated to be better than 1 nm by comparing artificial steps created by moving the Cy3-containing coverslip with a nanometric stage. Stepping is generally clear enough to determine by eye (Yildiz et al. Reference Yildiz, Forkey, McKinney, Ha, Goldman and Selvin2003). Other methods such as a maximum-likelihood algorithm can be used to find step sizes in noisy traces (Milescu et al. Reference Milescu, Yildiz, Selvin and Sachs2006). Dwell time was determined by measuring staying time at one position before taking another step.
2.2.2 Kinesin
Kinesins have been classified into at least 10 different families, and move along microtubules in the (+) direction of the microtubule (Schoch et al. Reference Schoch, Aist, Yoder and Turgeon2003; Schliwa & Woehlke, Reference Schliwa and Woehlke2003). The main role of kinesin is transporting cargos, and it is also involved in other functions such as mitosis (Sharp et al. Reference Sharp, Rogers and Scholey2000; Vale, Reference Vale2003a). As shown in Figure 1, conventional kinesin (kinesin I) exists as a dimer, and has a motor domain, stalk domain and cargo-binding domain. Kinesin mutation is reported to cause neuronal diseases (Hurd & Saxton, Reference Hurd and Saxton1996; Reid et al. Reference Reid, Kloos, Ashley-Koch, Hughes, Bevan, Svenson, Graham, Gaskell, Dearlove, Pericak-Vance, Rubinsztein and Marchuk2002; Hirokawa & Takemura, Reference Hirokawa and Takemura2004).
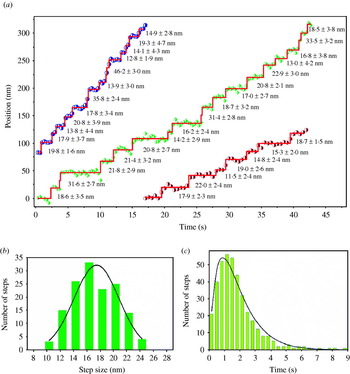
Kinesin is known to take a center-of-mass movement of ∼8 nm per ATP consumed (Svoboda et al. Reference Svoboda, Schmidt, Schnapp and Block1993; Hua et al. Reference Hua, Young, Fleming and Gelles1997; Schnitzer & Block, Reference Schnitzer and Block1997). The stepping mechanism of kinesin was controversial until recently. Hua and colleagues measured the rotation of microtubules by single kinesin using a microtubule gliding assay, and did not observe 180° rotation of the microtubules (Hua et al. Reference Hua, Chung and Gelles2002). They concluded that kinesin moved in an inchworm model, or an asymmetric hand-over-hand model. The asymmetric hand-over-hand model proposed that kinesin walks in a hand-over-hand motion without undergoing head rotation. Several results have been reported to exclude the inchworm model of kinesin (Asbury et al. Reference Asbury, Fehr and Block2003; Kaseda et al. Reference Kaseda, Higuchi and Hirose2003). Yildiz and colleagues measured step sizes of fluorophore-labeled kinesin on the head, and found that the average step size is 17·4 nm which is double the center-of-mass movement of kinesin (Yildiz et al. 2004b). Dwell time analysis showed that kinesin moves in two sequential steps, following the dwell time probability, P(t)=tk 2 exp(−kt), with the stepping rate constant k. This histogram analysis implies that kinesin walks 17 nm and hidden 0 nm steps (Yildiz et al. Reference Yildiz, Forkey, McKinney, Ha, Goldman and Selvin2003). Figure 5 shows traces of kinesin, a histogram of step size and a dwell-time analysis. This is completely consistent with a hand-over-hand mechanism, and with either Asbury's or Hua's asymmetric model.
Stepping traces, histogram and dwell time analysis of Cy3-labeled kinesin. (a) Traces of Cy3-labeled kinesin showed clear steps. (b) The histogram of step size shows an average step size of 17 nm (double the average center-of-mass movement) when kinesin walks along microtubules. (c) The analysis of the dwell-time histogram that is a convolution of 17 and 0 nm steps. These strongly suggest that kinesin walks hand-over-hand.

2.2.3 Myosin VI
Unlike other myosins, myosin VI moves toward the (−) end of actin filaments (Wells et al. Reference Wells, Lin, Chen, Safer, Cain, Hasson, Carragher, Milligan and Sweeney1999). Owing to this reverse directionality, myosin VI is known to be involved in endocytosis (Hasson, Reference Hasson2003). Myosin VI was first identified in Drosophila melanogaster (Kellerman & Miller, Reference Kellerman and Miller1992) and is known to be expressed in organisms from Caenorhabditis elegans to humans (Berg et al. Reference Berg, Powell and Cheney2001). Myosin VI plays crucial roles in cells such as transporting vesicles and maintaining the structure of stereocilia (Geisbrecht & Montell, Reference Geisbrecht and Montell2002; Hasson, Reference Hasson2003; Buss et al. Reference Buss, Spudich and Kendrick-Jones2004; Millo et al. Reference Millo, Leaper, Lazou and Bownes2004). In Snell's waltzer (sv) mouse, a myosin VI knock-out mouse, defective myosin VI causes deafness by disturbing the structural integrity of the sensory hair cells in the inner ear (Avraham et al. Reference Avraham, Hasson, Steel, Kingsley, Russell, Mooseker, Copeland and Jenkins1995, Reference Avraham, Hasson, Sobe, Balsara, Testa, Skvorak, Morton, Copeland and Jenkins1997; Melchionda et al. Reference Melchionda, Ahituv, Bisceglia, Sobe, Glaser, Rabionet, Arbones, Notarangelo, Iorio, Carella, Zelante, Estivill, Avraham and Gasparini2001).
Myosin VI shows different motility behaviors compared to myosin V. First, although myosin VI has a much smaller lever arm than myosin V – and only two CaM-binding sites (Bahloul et al. Reference Bahloul, Chevreux, Wells, Martin, Nolt, Yang, Chen, Potier, Van Dorsselaer, Rosenfeld, Houdusse and Sweeney2004; Chevreux et al. Reference Chevreux, Potier, Van Dorsselaer, Bahloul, Houdusse, Wells and Sweeney2005), the average step size is ∼30 nm, which is similar to that of myosin V. Myosin VI shows more frequent backward steps than myosin V. Myosin VI shows a broader distribution of step sizes compared to myosin V (Rock et al. Reference Rock, Rice, Wells, Purcell, Spudich and Sweeney2001). The highly variable step size of myosin VI raised the possibility that myosin VI might walk in an inchworm model. Although some unique characteristics in the motility of myosin VI are explained, future work is needed to fully understand other characteristics of myosin VI such as its large step size compared to its small lever arm.
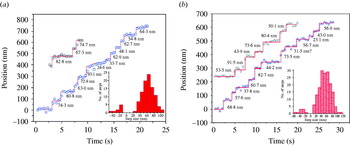
Yildiz and colleagues labeled artificially dimerized myosin VI with an eGFP on the motor domain or with Cy3 on the second of two CaMs located on its putative lever arm, and measured step sizes of these two fluorophore-labeled myosin VI (Yildiz et al. Reference Yildiz, Park, Safer, Yang, Chen, Selvin and Sweeney2004a). Stepping traces of fluorophore-labeled myosin VI are shown in Figure 6 along with histograms of step sizes. Histograms of step sizes show forward and backward steps, and a broad distribution of step size, which were previously reported in measurements of center-of-mass movement using an optical trap. Average forward step size of eGFP-labeled myosin VI was 63·3 nm (n=99), and average forward step size of Cy3-labeled CaM myosin VI was 55·2 nm. These average forward step sizes are double the center-of-mass movement of myosin VI (∼30 nm) measured by optical trap, demonstrating that myosin VI walks hand-over-hand. Dwell-time analysis shows two sequential steps, which implies that myosin VI takes 60–0 nm stepping, which supports a hand-over-hand stepping model. Unexpectedly, Cy3-labeled CaM myosin VI showed significant spatial fluctuation in its ATP state compared with eGFP myosin VI, while it shows less fluctuation in the rigor and ADP state. This implies that the lever arm of myosin VI uncouples from the motor in the ATP state. Spudich and colleagues measured step sizes of Cy5-labeled CaM myosin VI, and found that average step size was 70 nm, which supports the hand-over-hand stepping model of myosin VI (Okten et al. Reference Okten, Churchman, Rock and Spudich2004).
Stepping traces of single fluorophore-labeled myosin VI molecules. (a) Stepping traces of two myosin VI molecules with eGFP on the motor domain with a histogram of step size (shown in inset). The average forward step sizes is 63·3±16·7 nm. (b) Stepping traces of two myosin VI molecules with Cy3-labeled CaM with a histogram of step size (shown in inset). The average forward step size measured is 55·2±19·6 nm.

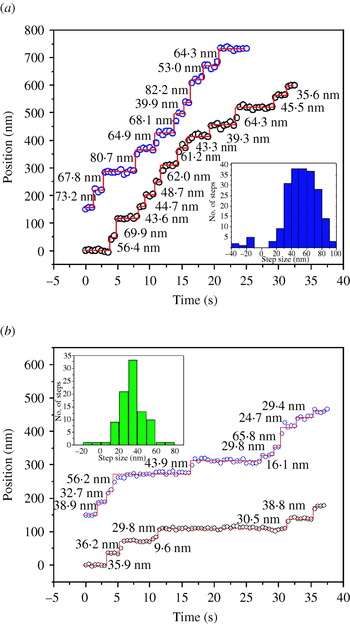
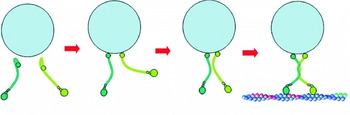
FIONA has helped to solve other mysteries of myosin VI such as the controversy about whether myosin VI functions as a monomer or a dimer (Park et al. Reference Park, Ramamurthy, Safer, Travaglia, Chen, Franzini-Armstrong, Selvin and Sweeney2006). While myosin VI contains a sequence that is predicted to form a coiled coil with high probability (Rock et al. Reference Rock, Ramamurthy, Dunn, Beccafico, Morris, Spink, Rami, Franzini-Armstrong, Spudich and Sweeney2005), all reported myosin VI dimers contain a genetically engineered leucine zipper (GCN4) distal to the native coiled coil region to guarantee the dimerization (Rock et al. Reference Rock, Rice, Wells, Purcell, Spudich and Sweeney2001; Okten et al. Reference Okten, Churchman, Rock and Spudich2004; Yildiz et al. Reference Yildiz, Park, Safer, Yang, Chen, Selvin and Sweeney2004a). Full-length myosin VI was reported not to form dimers and monomeric myosin VI was not processive (Lister et al. Reference Lister, Schmitz, Walker, Trinick, Buss, Veigel and Kendrick-Jones2004), which offered no explanation of how myosin VI transports vesicles in endocytosis. Park and colleagues demonstrated by measurements of step sizes using FIONA and electron microscopy (EM) images that the predicted region of the coiled coil in full-length myosin VI can lead to dimerization by clustering monomers through binding them either to actin filaments or to antibodies (Park et al. Reference Park, Ramamurthy, Safer, Travaglia, Chen, Franzini-Armstrong, Selvin and Sweeney2006). Step sizes of clustered full-length myosin VI were measured using FIONA, and the average step size is the same as the previously reported average step size of non-native coiled- coil myosin VI (Yildiz et al. Reference Yildiz, Park, Safer, Yang, Chen, Selvin and Sweeney2004a). Figure 7 shows traces and histograms of step sizes of full-length dimerized myosin VI by binding them either to actin filaments (Fig. 7a) or to antibodies (Fig. 7b). Measurements of step sizes using FIONA and EM images of truncated myosin VI show that the cargo-binding domain inhibits the dimerization of myosin VI and the highly probable coiled-coil region is necessary for the dimerization. These results imply a cargo-mediated dimerization model of myosin VI in cells where cargo binding exposes the hidden high-probability coiled-coil region of myosin VI, holds two monomers close, and initiates the formation of a dimer. Figure 8 shows a cargo-mediated dimerization model of myosin VI.
Stepping traces of full-length myosin VI molecules after initiating dimerization. (a) Stepping traces of two full-length myosin VI molecules with Cy3-labeled CaM, clustered through binding them to actin filaments with a histogram of step size (shown in inset). The average forward step size is 55·2±17·2 nm, which is the same as artificially dimerized myosin VI containing a non-native coiled-coil sequence (GCN4) (Yildiz et al. Reference Yildiz, Park, Safer, Yang, Chen, Selvin and Sweeney2004a). (b) Stepping traces of two full-length myosin VI molecules clustered through binding them to Cy3-conjugated antibodies with a histogram of step size (shown in inset). The average center-of-mass movement is 34·9±12·4 nm, which is similar to the average center-of-mass movement of artificially dimerized myosin VI measured by optical trap (Rock et al. Reference Rock, Rice, Wells, Purcell, Spudich and Sweeney2001).

Cargo-mediated dimerization model of myosin VI. Full-length myosin VI exists as a monomer without initiating dimerization. Binding of myosin VI monomers to cargo changes the conformation of the myosin VI, possibly exposing the high probability coiled-coil region. Close proximity of two monomers bound to cargo initiates the dimerization process. Once dimerized, the myosin VI can moves the cargo processively toward the (−) end of an actin filament.

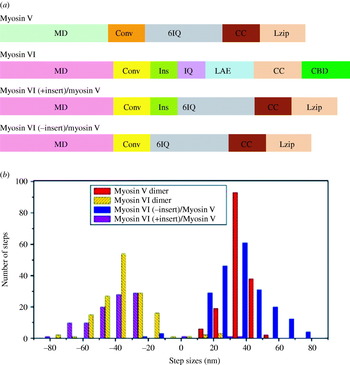
Measurements of step sizes using FIONA give clues regarding which domain is responsible for the broad step-size distribution of myosin VI, and gliding assay of actin filaments decides which domain causes the reverse directionality of myosin VI (Park et al. Reference Park, Li, Chen, Houdusse, Selvin and Sweeney2007). Ever since myosin VI was found to walk toward the (−) end of actin filaments (Wells et al. Reference Wells, Lin, Chen, Safer, Cain, Hasson, Carragher, Milligan and Sweeney1999), the main determinant of its reverse directionality has been an intriguing question. The structure of truncated myosin VI showed the unique insert (a 53 amino-acid sequence unique to myosin VI) at the end of motor domain wraps the converter domain and repositions the lever arm by 120° (Ménétrey et al. Reference Ménétrey, Bahloul, Wells, Yengo, Morris, Sweeney and Houdusse2005). Park et al. (Reference Park, Li, Chen, Houdusse, Selvin and Sweeney2007) constructed several chimeric myosins made up of the motor domain from myosin VI, plus six CaM-binding sites (lever arm) from myosin V, with or without the unique insert at the end of the myosin VI motor domain. Gliding assay of actin filaments of chimeric myosins showed that chimeric myosin with the unique insert at the end of the myosin VI motor domain move toward the (−) end of actin filaments like myosin VI while chimeric myosin without the insert move toward the (+) end like myosin V, which confirms that the unique insert at the end of the myosin VI motor domain determines its reverse directionality. A genetically engineered leucine zipper (GCN4) is added to all these chimeric myosins to guarantee dimerization. The center-of-mass movements of these chimeric myosins, myosin V, and VI were measured using FIONA, and histograms of these center-of-mass movements are shown in Figure 9. Chimeric myosins, regardless of the unique insert at the end of the motor domain, show a broad distribution of step size similar to myosin VI, while myosin V shows a sharp distribution. This result implies that a broad distribution of step size is caused not by the unique insert but by the motor domain of myosin VI. Since the converter domain transfers the conformational change from the motor domain into the lever arm, the converter domain might be the source of the broad distribution of step size in myosin VI.
Bar diagrams of myosin constructs and histograms of center-of-mass movements of dimeric myosins. (a) Bar diagrams of myosin constructs shows their respective domains and indicates their positions of the motor domain (MD), the converter domain (Conv), the unique insert domain (Ins), the IQ domain (IQ), six IQ domain (6IQ), the lever arm extension domain (LAE), the coiled-coil domain (CC), leucine zipper domain (Lzip) and the cargo-binding domain (CBD). Myosin VI, the myosin VI (+ insert)/myosin V, and the myosin VI (− insert)/myosin V share the motor domain and converter domain of myosin VI, while myosin V, the myosin VI (− insert)/myosin V, and the myosin VI (+ insert)/myosin V share 6IQ and coiled-coil domain from myosin V. (b) Histograms of the center-of-mass movement of wild-type myosin VI dimers (yellow), myosin V dimers (red), the myosin VI (− insert)/myosin V chimeric dimer (blue) and the myosin VI (+ insert)/myosin V chimeric dimer (purple) are shown. Center-of-mass movements of myosin were measured by attaching a Cy3-labeled antibody to the C-terminus of the individual myosin molecules. Positive steps denote movements toward the (+) end of actin filament, while negative steps indicate movements toward the (−) end of actin filament.

2.2.4 Dynein
Cytoplasmic dynein is a large molecular motor (∼1·2 MDa) and moves toward the (−) end of microtubules (Paschal & Vallee, Reference Paschal and Vallee1987; Mallik & Gross, Reference Mallik and Gross2004; Kon et al. Reference Kon, Mogami, Ohkura, Nishiura and Sutoh2005). It transports cargoes, and is also involved in other functions such as spindle formation and chromosome segregation (Vaisberg et al. Reference Vaisberg, Koonce and McIntosh1993; Saunders et al. Reference Saunders, Koshland, Eshel, Gibbons and Hoyt1995; Vallee et al. Reference Vallee, Williams, Varma and Barnhart2004). As shown in Figure 1, dynein is made up of two heavy chains of ∼500 kDa and various accessory polypeptides (King et al. Reference King, Bonilla, Rodgers and Schroer2002). Unlike other molecular motors, dynein has a ring of 6–7 AAA+ domains. Four AAA+ domains can bind to ATP (Gibbons et al. Reference Gibbons, Lee-Eiford, Mocz, Phillipson, Tang and Gibbons1987, Reference Gibbons, Gibbons, Mocz and Asai1991; Ogawa, Reference Ogawa1991), while the stalk domain binds to microtubules (Koonce, Reference Koonce1997). However, the molecular mechanism of motility is not well understood yet. The stepping mechanism of dynein was revealed using FIONA (Reck-Peterson et al. Reference Reck-Peterson, Yildiz, Carter, Gennerich, Zhang and Vale2006). Reck-Peterson and colleagues labeled the dynein with single Q-dot, and measured step sizes of the Q-dot-labeled dynein using FIONA. Stepping traces are shown in Figure 10. The step size of dynein has a broad distribution and dynein also shows backward steps as well as forward steps, which are similar to myosin VI, not kinesin. From these results, a stepping model for processive movement of dynein has been proposed, but motility mechanism of dynein still requires further research.
Stepping traces of tail-labeled or head-labeled dyneins. (a) Stepping traces of four GST-Dyn1331 kDa labeled with single quantum dot (Q-dot) at the NH2 terminal tail. The positions of the Q-dot are shown with black circles, the black line simply connects the data-points, and step sizes are shown in red. (b) Stepping traces of GST-Dyn1331 kDa dimer with a Q-dot at the COOH terminal head are shown. (Reproduced with permission from Reck-Peterson et al. Reference Reck-Peterson, Yildiz, Carter, Gennerich, Zhang and Vale2006.)

2.2.5 In vivo molecular motors
There are several challenges in applying FIONA to molecular motors inside a cell. First, a cell produces autofluorescence that increases background in the detection system. Second, a cell is normally in the physiological ATP condition (∼2 mm ATP), where molecular motors walk too fast to detect single steps with the time resolution of normal detection systems. (Typically, molecular motors move ∼100 steps per second; for kinesin, this is ∼800 nm/s.) Third, it is not easy to label specific proteins inside a living cell.
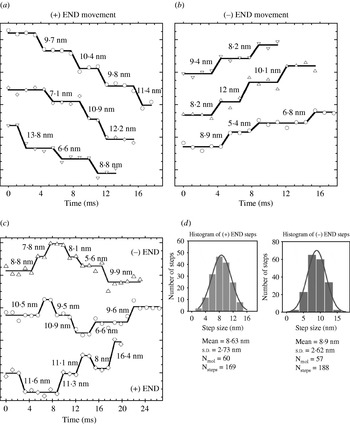
To overcome these challenges, several methods have been developed, allowing in vivo FIONA: brighter fluorescent molecules, new millisecond or even sub-millisecond time-resolution cameras, and unique labeling strategies. Kural and colleagues transfected peroxisomes with thousands of GFPs in Drosophila S2 cells, and used a millisecond time-resolution camera to localize them in a living cell (Kural et al. Reference Kural, Kim, Syed, Goshima, Gelfand and Selvin2005). Special chemicals such as latrunculin B or cytochalasin D were added to break down actin filaments, and double-stranded RNA interference (RNAi) was used to block certain families of kinesins. Peroxisomes with thousand of GFPs in a living cell have been localized with 1·4 nm accuracy with 1·1 ms time resolution. Anterograde [(+) end directed] and retrograde [(−) end directed] movement of peroxisomes were observed. The directionality of the microtubules could easily be detected, and 8 nm stepping of peroxisomes by kinesin and dynein was observed. These 8 nm steps suggested that vesicle transport can be explained by a coordination model where kinesin and dynein do not work on the same cargo at the same time, and are controlled by a mechanism that activates motors of one direction while inactivating the motor of the other direction. This result excluded the tug-of-war model where both kinesin and dynein work on the cargo simultaneously, and the movement of the cargo is determined by the stronger side. Figure 11 shows anterograde, retrograde, and mixed stepping traces along with a histogram of step sizes. Peroxisomes showed a variety of speeds, which suggests that a different number of molecular motors carry a single vesicle.
Stepwise traces of peroxisomes with thousands of GFPs and a histogram of center-of-mass movements (a) The stepwise traces of peroxisomes driven by kinesin shows ∼8 nm stepping, which is similar as previously reported in in vitro motility assays. (b) The stepwise traces of peroxisomes driven by dynein shows ∼8 nm stepping. (c) The stepwise traces of peroxisomes show switching between (+) and (−) end directed movements. (d) Histograms of the center-of-mass movement by kinesin and dynein motors.

Xie and colleagues used Q-dots to track endocytic vesicles in living cells (Nan et al. Reference Nan, Sims, Chen and Xie2005). Endocytic vesicles with Q-dots were localized with 1·5 nm accuracy with 300 μs time resolution, while 8 nm stepping was observed in both anterograde and retrograde movements similar to Kural et al. (Reference Kural, Kim, Syed, Goshima, Gelfand and Selvin2005). Additional 16 nm and 24 nm stepping was also seen.
FIONA has elucidated the stepping mechanism of molecular motors such as myosin V, kinesin, myosin VI and cytoplasmic dynein. It has helped solve several controversial questions about myosin VI and vesicle transport inside cells. Since FIONA can localize fluorescent molecules within a nanometer, it can be applied to more biological systems as well as other molecular motors.
3. SHREC
3.1 Basic principles of SHREC
Ever since FIONA became a well-established technique to localize a single fluorescent molecule, other useful techniques such as Single-molecule High-Resolution Imaging with Photobleaching (SHRImP; Gordon et al. Reference Gordon, Ha and Selvin2004) and NAnometer-Localized Multiple Single-molecule fluorescence microscopy (NALMS; Qu et al. Reference Qu, Wu, Mets and Scherer2004) have developed, allowing measurements of distances from 10 nm to 200 nm – a previously unbridgeable gap between fluorescence resonance energy transfer (FRET) and diffraction-limited microscopy. These methods measure the distance between two identical fluorescent molecules. The idea is that one undergoes photobleaching; the surviving fluorescent molecule is located with FIONA to within a few nanometers; the image just before the first photobleaching event is subtracted from the image just after photobleaching and is fitted via FIONA, determining the position of the first fluorescent molecule to within a few nanometers. The resolution is now the distance between the fluorescent molecules. SHRImP and NALMS have been used to measure the end-to-end distance of DNA, confirming their validity as a nanometer ruler. SHRImP has also been applied to measure inter-head distance of myosin VI, and provide other evidence supporting the hand-over-hand stepping model of myosin VI (Balci et al. Reference Balci, Ha, Sweeney and Selvin2005). Since these methods use the photobleaching of single dyes to measure distance, continuous measurements of distance are impossible with these techniques.
To measure the distance continuously, SHREC was developed (Churchman et al. Reference Churchman, Okten, Rock, Dawson and Spudich2005). SHREC images two chromatically different dyes, such as Cy3 and Cy5, attached to a single macromolecule in different channels of a CCD detector (typically via a dual imager, such as the Optical Insights Dual-view, which splits the image onto the two halves of the CCD). Two images are localized in the same way as FIONA, and the centers of the two fluorophores are mapped onto the same channel. Then, the distance can be calculated from 10 nm to 200 nm by comparing the localization of the fluorophores made in the individual channels in the new combined channel. Measurements of the length of double-stranded DNA using SHREC proves its usefulness as a nanometer ruler. In general, the limitation is photobleaching of the second dye: we have found Cy3 extremely photostable using the exact deoxygenation system used (Yildiz et al. Reference Yildiz, Forkey, McKinney, Ha, Goldman and Selvin2003). We have used SHREC with Alexa 488, Cy3, and Cy5 in the presence of the previously mentioned deoxygenation reagents plus Trolox (Rasnik et al. Reference Rasnik, McKinney and Ha2006).
3.2 Application of SHREC to molecular motors
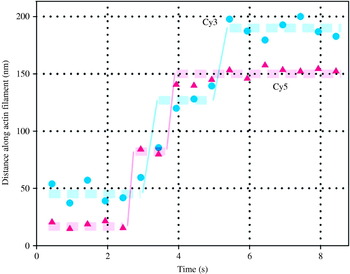
SHREC has been applied to finding the stepping mechanism of myosin V (Churchman et al. Reference Churchman, Okten, Rock, Dawson and Spudich2005; Warshaw et al. Reference Warshaw, Kennedy, Work, Krementsova, Beck and Trybus2005; Yildiz et al. unpublished observations). First, alternating steps of myosin V have been observed using SHREC by labeling two CaMs with different fluorophores with traces shown in Figure 12 (Churchman et al. Reference Churchman, Okten, Rock, Dawson and Spudich2005). Step sizes of the two heads of myosin V and the distances between them have been measured at the same time. Step sizes of two heads of myosin V were measured as ∼72 nm, and the distance between the two heads was ∼36 nm, which strongly supports the hand-over-hand stepping model of myosin V. Warshaw and colleagues have labeled two heads of myosin V with two different colors of Q-dots, and observed myosin V stepping over long distances (Warshaw et al. Reference Warshaw, Kennedy, Work, Krementsova, Beck and Trybus2005). They also observed 72 nm stepping and 36 nm separation between the two heads. Yildiz and colleagues have placed two chromatically different fluorophore-labeled CaMs at several different CaM-binding sites on myosin V, and showed several different alternating steps depending on the position of fluorophore-labeled CaM on the two neck domains (Yildiz et al. unpublished observations). By measuring the distance between the two fluorophores, they found that the distance in the leading position and trailing position is statistically the same, and suggested that myosin V follows a straight-leg model.
Stepping trace of myosin V labeled with two chromatically different fluorophores (Cy3 and Cy5). Both stepping traces of two fluorophores show 72 nm steps and 36 nm separations. The alternating stepping implies that myosin V walks ‘hand-over-hand’ model (Reproduced with permission from Churchman et al. Reference Churchman, Okten, Rock, Dawson and Spudich2005).

Although SHREC has been applied to finding the stepping mechanism of myosin V so far, it could help in finding the stepping mechanism of other molecular motors. In particular, how myosin VI takes ∼30 nm step with a small lever could be solved with SHREC.
4. DOPI
4.1 Basic principles of DOPI
Single-molecule biophysics comprises more than measuring the step sizes of molecular motors. There are numerous proteins that do not move processively, but rotate such as F1–F0 ATPase (Kinosita et al. Reference Kinosita, Yasuda, Noji, Ishiwata and Yoshida1998), non-processive molecular motors (Spudich, Reference Spudich1994), and ion channels (Selvin, Reference Selvin2003). Therefore, studying these proteins requires techniques that can detect rotational movements. The 3D orientations of the fluorophores which have linearly polarized excitation and emission dipoles can be detected by taking the advantage of the polarization of the light (Kinosita et al. Reference Kinosita, Itoh, Ishiwata, Hirano, Nishizaka and Hayakawa1991; Ha et al. Reference Ha, Enderle, Chemla, Selvin and Weiss1996; Forkey et al. Reference Forkey, Quinlan, Shaw, Corrie and Goldman2003; Syed et al. Reference Syed, Snyder, Franzini-Armstrong, Selvin and Goldman2006) or using defocused imaging (Bartko & Dickson, Reference Bartko and Dickson1999; Böhmer & Enderlein, Reference Böhmer and Enderlein2003; Toprak et al. Reference Toprak, Enderlein, Syed, McKinney, Petschek, Ha, Goldman and Selvin2006). Therefore, one can study rotational dynamics of proteins by attaching a fluorophore rigidly such that it does not undergo random rotations independent of the target proteins (Forkey et al. Reference Forkey, Quinlan, Shaw, Corrie and Goldman2003; Syed et al. Reference Syed, Snyder, Franzini-Armstrong, Selvin and Goldman2006; Toprak et al. Reference Toprak, Enderlein, Syed, McKinney, Petschek, Ha, Goldman and Selvin2006).
A single fluorescent molecule with fixed emission dipole orientation is not an isotropic emitter, and its emission strongly depends on its 3D orientation in space (Bartko & Dickson, Reference Bartko and Dickson1999; Enderlein et al. Reference Enderlein, Toprak and Selvin2006). Conventional microscopy techniques which observe the specimen in the sharp focal plane generally cannot report on the 3D orientations of fluorophores. When the sample is deliberately moved away from the sharp focus by a specific distance, the 3D orientation of fluorophores can be found without any angular degeneracy. Measuring the orientation, and ideally the position (centroid) of a fluorophore we refer to as DOPI. DOPI has no degeneracy in measuring the orientation of the dipole axis within any pre-selected hemisphere, but the bidirectional symmetry of the optical dipoles still presents an ambiguity between (Θ, Φ) and (180°−Θ, Φ+180°) for any dipole.
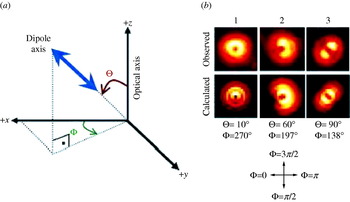
This method was first introduced by Bartko & Dickson (Reference Bartko and Dickson1999) and the complete description of the electrodynamics behind has been detailed by Böhmer & Enderlein (Reference Böhmer and Enderlein2003). In brief, the defocused image of a single fluorophore is taken in a plane where the different light rays have not converged into a single focus, i.e. the microscope objective is not in the focal plane. The resulting emission pattern of the single fluorophore on the CCD depends on Θ (the axial angle between dipole axis and optical axis), Φ (the azimuthal angle around the optical axis), and the defocusing distance from the focal plane. The defocused CCD image of a fluorescent molecule is a combination of lobes and fringes depending on the orientation of the fluorophore (Fig. 13a). When the emission dipole of a Q-dot is oriented along the z axis (Θ=0, which is the angle between dipole axis and optical axis, Fig. 13a), a donut pattern appears [Fig. 13b(1)] (The light is polarized along the x–y axis, but due to the high numerical aperture, has a z component, which excites the dipole). When oriented in the specimen plane, a symmetric pattern appears around the dipole axis [parallel to the dark line between two symmetric bright lobes in Fig. 13b(3)] making an angle of Φ=138° with the +x axis. An emission dipole in an arbitrary plane is a combination of the two images [Fig. 13b(2)]. A pattern match analysis technique is used to estimate the 3D orientation, and the lateral position of the fluorophore (Patra et al. Reference Patra, Gregor and Enderlein2004). DOPI can estimate 3D orientations with ∼10–15° uncertainty and lateral position with ∼15 nm accuracy when the exposure time is 0·6–0·8 s (for a rhodamine molecule, ∼3 mW excitation power with objective type TIR illumination) (Yildiz et al. Reference Yildiz, Forkey, McKinney, Ha, Goldman and Selvin2003; Toprak et al. Reference Toprak, Enderlein, Syed, McKinney, Petschek, Ha, Goldman and Selvin2006). Improvement of the angular and temporal resolution can be achieved by using alternative probes or inhibiting quick photobleaching through the use of new oxygen-scavenging systems (Hu et al. Reference Hu, Li, Yang, Manna, Wang and Alivisatos2001; Rasnik et al. Reference Rasnik, McKinney and Ha2006).
Coordinate system for DOPI analysis, real images and fitting images for DOPI. (a) The right-handed spherical coordinate system that is used for DOPI analysis. Θ is the axial angle with respect to the optical (z) axis, 0°⩽θ⩽90°. Φ is the azimuthal angle around the x axis, 0°⩽Φ⩽360°. Only the upper hemisphere is covered due to the dipolar degeneracy. (b) Representative experimental and fit images for Q-dots frozen in 1% polyvinyl alcohol. 1, When the dipole is aligned with the optical axis, a donut pattern appears. 2, When the dipole has an inclined angle, a combination of lobes and fringes (like a pacman) appears. 3, When the dipole is parallel to the specimen plane (perpendicular to the optical axis), two symmetrical lobes appear. The dark line between the two lobes is the in plane dipole axis.

4.2 Application of DOPI to molecular motors
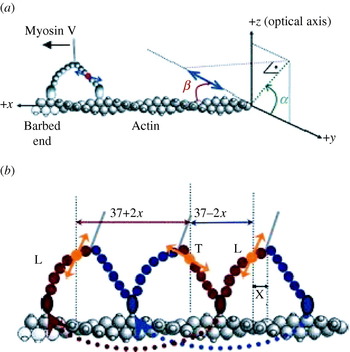
DOPI has been applied to reveal the stepping mechanism of myosin V (Toprak et al. Reference Toprak, Enderlein, Syed, McKinney, Petschek, Ha, Goldman and Selvin2006). Evidence from previous studies showed that the lever arm of myosin V has two well-defined states (trailing and leading) during ATP-dependent translocation. Therefore, myosin V was a perfect model system to demonstrate the capabilities of DOPI for biological experiments (Burgess et al. Reference Burgess, Walker, Wang, Sellers, White, Knight and Trinick2002; Forkey et al. Reference Forkey, Quinlan, Shaw, Corrie and Goldman2003). One of the six CaMs of myosin V was labeled with a bifunctional rhodamine (Forkey et al. Reference Forkey, Quinlan, Shaw, Corrie and Goldman2003; Toprak et al. Reference Toprak, Enderlein, Syed, McKinney, Petschek, Ha, Goldman and Selvin2006). The dipole orientation of the dye with respect to the lever arm is ∼40°. However, the azimuthal angle of the dipole around the lever arm is not known (Fig. 14a). All of these variables made using the laboratory coordinate frame for data analysis ambiguous. Instead, an actin-based coordinate system (Fig. 14a) to map everything on the actin frame was used (α, the azimuthal angle around the actin; β, the axial angle with respect to the actin filament).
The coordinate system and stepping of myosin V on an actin filament. (a) The actin-based coordinate system is used for less ambiguous actin–myosin V–dipole geometry. The spherical coordinates are transformed into actin-based coordinates in which α is the azimuthal angle around the actin, and β is the axial angle with respect to the actin using the following equation (0°⩽α, β⩽180°): . Dipole of the bifunctional rhodamine molecule is represented with a double-headed blue arrow. (b) Myosin V is labeled on one of the CaMs, therefore the steps are alternating short (37–2x) and long (37+2x) steps. x is the projected distance between the center of mass of motor and the fluorescent molecule. After a long step the lever arm dwells in its leading state (L), and it dwells in its trailing state (T) after a short step.

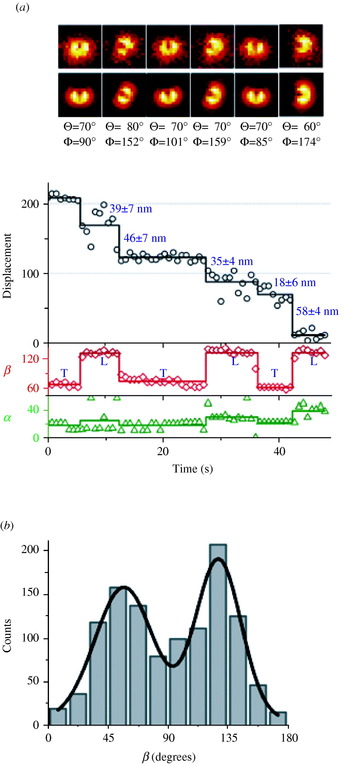
Defocused images were captured using exposure times between 0·6 and 0·8 s in the presence of ∼300 nm ATP. The exposure time, ATP concentration, and the excitation laser power (∼3 mW measured before the objective) were optimized to capture 4–5 frames for each dwell period of myosin V (Fig. 15a). A total of 97 molecules (1151 steps) were observed (molecules which walked on a linear track, sparse enough for analysis, and moved processively for many steps) and all of the myosin V molecules showed obvious lever arm rotations. The average β change was ∼71° which is consistent with EM measurements (Fig. 15b).
A stepping trace and a histogram of dwell-averaged β values of myosin V molecules. (a) A stepping trace of stepping, α, and β with images of DOPI is shown. The sample is moved away from the sharp focal plane by ∼500 nm. (b) Histogram of the dwell-averaged β values for 97 myosin V molecules. The resulting histogram is fit into a two-peaked Gaussian function (R 2=0·945). The peak with the lower value (β1=57±22°) corresponds to the trailing state, and the peak with the higher value (β2=128±17°) corresponds to the leading state.

Unfortunately, the position accuracy of DOPI was usually not enough to measure the step size of myosin V. The step size of myosin V was measured by using a simple trick to take advantage of FIONA. Using a synchronized CCD and a piezo stage allowed switching between focused and defocused imaging to get 3D orientations and reliable position data. Our piezo stage had a response time of <10 ms, and therefore traveling times between the focused and defocused planes were generally short enough not to interfere with our measurements. These measurements (32 molecules were imaged by switching between focused and defocused imaging) confirmed that all lever-arm tiltings were synchronized with stepping events within the time resolution of our experiments. Accurate step size information also allowed us to distinguish trailing and leading states of the lever arm since the lever arm is in the leading state after long steps (37+2x nm) and in the trailing state after short steps (37–2x nm). It was concluded that the average dipole angle with respect to the actin filament (β) was ∼57° for the trailing lever arm and ∼128° for the leading lever arm (Toprak et al. Reference Toprak, Enderlein, Syed, McKinney, Petschek, Ha, Goldman and Selvin2006).
Because DOPI has the capability to measure angles and position simultaneously, molecular motors and other biological systems can be much more accurately studied. Future improvement in fluorophore lifetime, brightness, and labeling will only further increase the usefulness of this technique.
5. Conclusion
FIONA, SHREC, and DOPI have been applied to molecular motors and helped to elucidate their stepping mechanisms. They have contributed to the solution of other controversial problems regarding molecular motors. Although much work has been done on molecular motors using these techniques, there are still a number of questions that can be answered with them. In particular, these techniques will lead to a greater understanding of cytoplasmic dynein, which still remains mysterious. Moreover, the investigation of molecular-motor stepping inside cells could be possible with FIONA and SHREC, bringing to light many of the unusual behaviors of motors within the cell. In addition, these techniques can be applied to other biological systems. FIONA, SHREC and DOPI have the potential to bring many breakthroughs in the field of molecular motors in the near future.
6. Acknowledgments
The authors acknowledge Benjamin H. Blehm and Dr Tyler A. Lougheed for their critical review on this manuscript. This work is supported by National Institutes of Health grants AR44420 and GM68625.