


Introduction
Environmental issues, especially pollution, have become a current topic everywhere, also in Antarctica where permanent human settlements have impacted on the environment at varying levels. Antarctic stations are an interesting and particular field for pollution research because of the small area of influence and the reduced number of sources.
Antarctica constitutes a particular and unique scenery for scientific observation and for research of global and regional scope in several lines of investigation. This fact has been addressed in the Antarctic Treaty (1959 see http://www.antarctica.ac.uk/About_Antarctica/Treaty/treaty.html), which establishes some restrictions. At the beginning of 1990, the concern for environmental problems and issues came up between the Antarctic Treaty Parties, and explicitly recognized in the Protocol on Antarctic Treaty to the Environmental Protection (1991), where environmental regulations for Antarctic Treaty Parties were stated. Specifically, in Argentina, the Dirección Nacional del Antártico (DNA) decided to elaborate environmental management plans for all scientific and logistic activities performed in its active stations. Such programmes were aimed at obtaining scientific information in order to provide more suitable actions for each particular situation.
Steady human settlements have been established for around 100 years in the Antarctic. Consequently, anthropogenic activities in Antarctica have inevitably modified the areas of settlement and the environment of influence. Such modification to the environment has mostly had an adverse outcome, mainly, due to the lack of environmental awareness of the pollution problem: waste management, liquid effluents and atmospheric pollutants, at least, up to 1991. Thus, historical contamination has been accumulated, with varying levels of impact, in several Antarctic areas. In ice free areas, soils and sediments are the most affected environments; however, pollution-related studies are scarce in Antarctica involving a couple of stations (e.g. Merlin et al. Reference Merlin, Salvador, Vitturi, Pistolato and Rampazzo1989, Lenihan et al. Reference Lenihan, Oliver, Oakden and Stephenson1990, Lenihan Reference Lenihan1992, Claridge et al. Reference Claridge, Campbell, Powel, Amim and Balks1995, Kennicutt et al. Reference Kennicutt, Mcdonald, Sericano, Boothe, Oliver, Safe, Presley, Li, Wolfe, Wade, Crockett and Bockus1995, Ciaralli et al. Reference Ciaralli, Giordano, Lombardi, Beccaloni, Sepe and Costantini1998, Sheppard et al. Reference Sheppard, Claridge and Campbell2000, Frache et al. Reference Frache, Abelmoschi, Baffi, Ianni, Magi, Soggia, Caroli, Cescon and Walton2001, Vodopivez et al. Reference Vodopivez, Smichowski, Marcovecchio, Caroli, Cescon and Walton2001, Webster et al. Reference Webster, Webster, Nelson and Waterhouse2003, Santos et al. Reference Santos, Silva-Filho, Schaefer, Albuquerque-Filho and Campos2005, 2006).
Rock-magnetic techniques have been investigated and developed, becoming a very useful tool in environmental issues, especially pollution. Exhaustive studies of magnetic monitoring or magnetic screening have been conducted around the world since eighties, e.g. Beckwith et al. (Reference Beckwith, Ellis, Revitt and Oldfield1986), Heller et al. (Reference Heller, Strzyszcz and Magiera1998), Bityukova et al. (Reference Bityukova, Scholger and Birke1999), Kapicka et al. (Reference Kapicka, Petrovský, Ustjak and Machácková1999), Matzka & Maher (Reference Matzka and Maher1999), Petrovský et al. (Reference Petrovský, Kapicka, Jordanova, Knob and Hoffmann2000), Hanesch & Scholger (Reference Hanesch and Scholger2002), Schibler et al. (Reference Schibler, Boyko, Ferdyn, Gajda, Höll, Jordanova and Rösler2002), Jordanova et al. (Reference Jordanova, Jordanova, Veneva, Andorova and Petrovský2003), Lecoanet et al. (Reference Lecoanet, Léveque and Ambrosi2003), Boyko et al. (Reference Boyko, Scholger and Stanjek2004), Desenfant et al. (Reference Desenfant, Petrovský and Rochette2004), Spiteri et al. (Reference Spiteri, Kalinski, Rösler, Hoffmann and Appel2005), Chaparro et al. (Reference Chaparro, Gogorza, Chaparro, Irurzun and Sinito2006), Magiera et al. (Reference Magiera, Strzyszcz, Kapicka and Petrovský2006).
The present article constitutes one of the first studies of magnetic screening and heavy metal pollution on Antarctic soils from Marambio Station (Seymour Island), an ice free Antarctic area. Marambio Station was founded on 29 October 1969, and ever since, it has been actively operating. The station has one of the most important permanent airstrips in the zone, so it supplies important logistic support to national and international scientific activities. Thus, the station has intensified its anthropogenic activities leading to an inevitable adverse impact on its surroundings. In addition to this, the absence of adequate procedures of waste management, at least up to the nineties, made matters worse, and therefore adverse effects of different magnitude were progressively accumulated affecting the biological, physical and landscape component of the surrounding area.
This study is aimed at investigating a) the appropriateness and usefulness of magnetic screening in Antarctic anthropogenic-influenced soils, b) the relevant magnetic parameters, c) the identification of polluted areas and possible pollution sources, and d) the pollution status in these soils and the current reference values for future works. It is worth of mentioning that no extensive study of magnetic screening focused on the pollution problem has yet been carried out in any other Antarctic area. Magnetic susceptibility mapping as a preliminary assessment of pollution seems suitable, in a first-order approximation, in these soils. Furthermore, several magnetic parameters related to characteristics of magnetic carriers and chemical determinations of trace heavy metals in “polluted” and control sites were studied in the present work.
Study area and geological setting
Marambio Station (Lat: 64°14′S; Long. 56º37′W, Fig. 1) is located on the north-east of Seymour Island on a plateau that is 3 km long (N–S) and 1 km wide (W–E) at ∼210 m above sea level (Agraz et al. Reference Agraz, Sánchez, Rinaldi and Acero1998). The top of the plateau dips gently to the south-east with a number of small shallow gullies cutting the surface on the east side. After a fire that affected the old station more than 10 years ago, the main group of buildings was rebuilt in same area and distributed on a surface of ∼0.6 kmReference Andersson2, named “Station Area” by Agraz et al. (Reference Agraz, Sánchez, Rinaldi and Acero1998). One old building named “La Remota” is located ∼2 km away from the main facilities. The buildings are placed on a platform 1 m above soil surface. Since these soils are usually covered by ice and snow, especially in winter when the fire occurred, a minor temperature influence is expected on their magnetic particles.
Location of study sites and facilities in Marambio Station. Inset shows the Antarctic Peninsula, Seymour (Marambio) Island and others.

Seymour (Marambio) Island lies south-east to the northern end of the Antarctic Peninsula (Fig. 1). The islands in that region lay in a precipitation shadow, so they have more snow and ice free land than in any other part of the peninsula, except for the South Shetland archipelago. Seymour Island is divided into two physiographic provinces: 1) the north-east island, a plateau (meseta) that is the remnant of an erosion surface and is covered by glacial drift, and 2) the south-west island, a ridge and valley topography underlain by a homoclinal sequence of Cretaceous sediment and lacking a cover, or evidence of former cover, of glacial drift.
Marambio Station was built on the top surface of the meseta, on a veneer up to 20 m deep of coarse glacial debris with boulder rocks named erratic. These deposits were studied by several authors, and large glacial erratics were first noted by Andersson in 1906 (Andersson Reference Andersson1906). Those boulders, measuring up to 3 × 2.5 × 1.5 mReference Angulo3, are scattered over the top of the meseta, or in the glacial drift. According to Malagnino et al. (Reference Malagnino, Olivero, Rinaldi and Spikerman1981), a glacio-marine origin of Quaternary age is assigned to these deposits. Later, Zinsmeister & DeVries (Reference Zinsmeister and DeVries1983) informally referred to this Formation as “Weddell Formation”; and recently, Gazdzicki et al. (Reference Gazdzicki, Tatur, Hara and Del Valle2004) formally named it as Weddell Sea Formation.
According to Gazdzicki et al. (Reference Gazdzicki, Tatur, Hara and Del Valle2004) these deposits most probably represent a small relict of a much larger glacial drift deposit that once covered most of the area. Moreover, erosion and cryogenic processes have highly affected and modified them. The Weddell Sea Formation covers the sedimentary rock belonging to the La Meseta Formation of Eocene age.
Gazdzicki et al. (Reference Gazdzicki, Tatur, Hara and Del Valle2004) found that the unconsolidated matrix of the glacial drift is composed of various materials ranging from dark-brown silty clay to yellow sand with scattered macro and microfossils. The sediment contains erratics that may reach boulder size. Most of the largest erratics are of local origin. The largest blocks (up to 3 m in diameter) are mainly granitoids and metamorphic schists, dominated by dark grey gneiss showing porphyroblastic structure. Smaller erratics are represented mainly by often porous andesite and basalts, whose colours range from black to brown, as well as by related pyroclastic rocks. More than 90 per cent of the erratics have direct affinities with igneous and metamorphic rocks known from the Antarctic Peninsula. According to Gazdzicki et al. (Reference Gazdzicki, Tatur, Hara and Del Valle2004), the clastic components were mainly derived from the James Ross Basin. Most of the clastic (90%) come from rocks known from the Antarctic Peninsula sector. Igneous and metamorphic rocks form boulders, whereas pebbles are mainly represented by basalts and andesites. Less common (<10%) are blocks of rock eroded directly from the substratum (calcareous concretions bearing Tertiary and also Cretaceous fossils). A few fragments of typical but uncommon rocks occurring in the Antarctic Peninsula were also recognized. The matrix of the glacial drift was derived mainly from the underlying fossiliferous Tertiary and Cretaceous sedimentary rocks.
The climatic conditions of the area, with an annual mean air temperature of -10°C, are favourable for the existence and formation of permafrost, the maximum thickness of the active layer being about 60 cm (Fukuda et al. Reference Fukuda, Strelin, Shimokawa, Takahashi, Sone, Trombotto, Yoshida, Kaminuma and Shiraishi1992); below this depth the soil is still frozen, even during the summer. The soils solifluction and surface gravity flows during the summer thaw cause erosion that leads to exposure of sandy bedrock at isolated places on the plateau. Outcrops along the north-west edge of the meseta are relatively well preserved and not totally covered by muddy flows (Gazdzicki et al. Reference Gazdzicki, Tatur, Hara and Del Valle2004).
The occurrence of the glacial drift on the plateau precludes a marine origin, at least for the Early–Late Quaternary time. Moreover, striae on the concretions scattered on the substratum surface, structures at the contact line with underlying sediments and the occurrence of rocks eroded from the lower part of La Meseta Formation suggest a terrestrial origin for the Weddell Sea Formation and its morphology suggests inner-morainic depositions (Gazdzicki et al. Reference Gazdzicki, Tatur, Hara and Del Valle2004).
The “Pristine Area” is an undisturbed place on the plateau, and it is specially protected from the station activity to keep the anthropogenic contamination as low as possible. This area can be considered unspoilt from the human point of view, allowing a comparison with the area with suspected human impact.
Sampling
The area under study involved soils in Marambio Station (Seymour Island, 64º14′S; 56º37′W, Fig. 1) and its surrounding area. Fieldwork was carried out in two campaigns, Summer Antarctic Campaign (SAC) 2003–2004 and SAC 2004–2005.
In SAC 2003–2004, 46 topsoil (0–10 cm depth) samples were collected at selected sites in Marambio Station (sites M10–M99, Fig. 1 and Table I), and in a reference “Pristine Area” or control site (sites M44–M48, see Table I). Each sampling site was geographically pinpointed using a Global Positioning System (GPS), eTrex Vista Garmin Ltd. Each soil sample (∼300 g) was packed in a plastic bag in the field. Then in the laboratory, after taking out debris and small rocks, from each sample, two subsamples were obtained; one of them was kept in a plastic box (8 cm3) and fixed using a solution of sodium silicate for magnetic measurements; the other one was preserved in a small bag (∼30–70 g) for chemical measurements.
Samples and description of sites in Marambio Station and “Pristine Area”.

In SAC 2004–2005, in situ magnetic susceptibility (κis) measurements were performed in 305 sites in Marambio Station (Fig. 1). Each site was also geographically pinpointed using the above mentioned GPS. Measurements of κis in various kinds of rocks (plutonic, volcanic, metamorphic, and sedimentary) were analysed and discussed in Chaparro (Reference Chaparro2006) in order to know the possible lithologic contribution in this soil.
Magnetic methods
Magnetic susceptibility measurements were carried out using a magnetic susceptibility meter MS2, Bartington Instruments Ltd, connected to two sensors: MS2D (for fieldwork) or MS2B (for laboratory work) dual frequency sensor (470 and 4700 Hz). In situ magnetic susceptibility (κis) was measured in the field; at each waypoint six measurements were performed and then averaged. The volumetric magnetic susceptibility in the laboratory (κ) and mass-specific susceptibility (χ) were also computed.
Anhysteric remanent magnetization (ARM) was imparted superimposing a DC field of 90 µT to an AF of 100 mT, using a partial ARM (pARM) device attached to a shielded demagnetizer Molspin Ltd. Related parameters, such as, the anhysteric susceptibility (κARM), King's plot (κARM versus κ, King et al. Reference King, Banerjee, Marvin and Özdemir1982) and the κARM/κ-ratio (Dunlop & Özdemir Reference Dunlop and Özdemir1997) were also calculated.
Isothermal remanent magnetization acquisition (IRM) studies were carried out by using an ASC Scientific model IM-10-30 pulse magnetizer. Each sample was magnetized by exposing it to growing stepwise DC fields, from 4.3 mT to 2470 mT. From these measurements, IRM acquisition curves, saturation IRM (SIRM), and SIRM/χ ratios were determined using forward DC fields. Remanent coercivity (HCR) and S-ratio (= -IRM-300/SIRM, being IRM-300 the acquired IRM at a backfield of 300 mT) were also calculated from IRM measurements, using backfield once the SIRM was reached.
The remanent magnetization after each step for ARM and IRM studies was measured by a Molspin Ltd Minispin fluxgate spinner magnetometer.
An experimental method to discriminate magnetic phases (Chaparro & Sinito Reference Chaparro and Sinito2004, Chaparro et al. Reference Chaparro, Lirio, Nuñez, Gogorza and Sinito2005) was performed. The method is based on the responses of different assemblages of magnetic materials when they are subject to a pulse magnetizing field (H) and a demagnetizing alternating field (AF). For details and discussion about the method see Chaparro et al. (Reference Chaparro, Lirio, Nuñez, Gogorza and Sinito2005). In this work, only bulk curves of backfield IRM were specially separated and discriminated.
Finally, thermal demagnetization was done for selected samples with an ASC Scientific model TD-48 thermal specimen demagnetizer. Samples were heated in increasing stepwise temperatures in air, from room temperature (RT) up to 700°C. After each step, remanent magnetization and magnetic susceptibility were measured for cooled samples. Stepwise thermal demagnetization and susceptibility curves were represented and critical temperatures (TC) were estimated.
Chemical methods
Each sample was prepared using standard protocols according to the EU standards; the Central Laboratory (Czech Geological Survey) is the laboratory no. 1049.1 accredited by the Czech institute for accreditation (ČIA) in conformity with the Czech technical standard (ČIA) ISO/IEC 17025. The samples were dried at 105°C and prepared by acid digestion for trace metal analyses. On the other hand, the organic matter content was determined by ignition loss method at 550°C. Analysis of trace metals and silicates were determined by the method of Flame Atomic Absorption Spectroscopy (FAAS) on twenty selected samples. These 20 samples were selected taking into account concentration-dependent magnetic measurements that might indicate possible more and/or less affected sites; moreover, samples near the possible pollution sources (e.g. the power plant, the incinerator, tool stores, the waste disposal area, etc) were also selected. Trace elements individual determination of solid samples was carried out using the Code 350 that contains accredited testing methods A32 (Cr, Cu, Zn, Ni, Pb) and non-accredited element (Cd) (Weiss Reference Weiss1983). Besides, total analyses of silicates were determined using the Code 301 that contains accredited testing methods A14-7 (Fe, Weiss Reference Weiss1983).
On the other hand, the Tomlinson pollution load index (PLI, Angulo Reference Angulo1996) was calculated regarding the results of various heavy metals. PLI is defined as the nth root of the multiplication of the concentration factors (CF k),
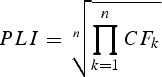
where CF k is the ratio of the content of each heavy metal (CHM,k) to the baseline value (Cbaseline,k) or the lowest concentration values detected for each heavy metal in the area under study,

Statistical methods
Spatial distribution of magnetic and chemical data was performed by using the Origin® v. 6.0, Microcal Software, Inc. Data were converted into a regular grid (a matrix), i.e. a gridding procedure, using correlation (or Kriging) method (Microcal Software Inc 1999, Davis Reference Davis1986). After applying the gridding procedure, the matrix was used for generating contour graphs.
Results
Firstly, magnetic susceptibility measurements in the laboratory in some selected samples were carried out to discover the orders of magnitude of magnetic parameters in these soils; χ ranged from 9.0 to 339.6 × 10⁻⁸ mReference Angulo3 kg-1. Such preliminary magnetic values allow us to evaluate qualitatively the presence of magnetic carriers and identify the main zones of interest.
Subsequently, in situ magnetic susceptibility measurements were carried out in Marambio Station as a first-order approach. κis measurements varied widely from 15.5 to 6800 × 10-5 SI. As mentioned, in situ measurements at each site were averaged and their standard deviations (SD) calculated in order to evaluate the data scatter. Although some sites showed high SD, the median relative SD (SD%) was 13.9% and the mean SD% was 18.4% for these dataset (n = 305). Such deviations are similar to SD% obtained in mapping studies in European countries, e.g. in Schibler et al. (Reference Schibler, Boyko, Ferdyn, Gajda, Höll, Jordanova and Rösler2002), where the median SD% varied from 2.9 to 10.2%, and the mean SD% from 4.9 to 14.8%. In the present work, the data scatter can be attributed to different factors, among them, surface roughness, and the presence of metallic waste and small (volcanic) rocks. The latter factor was significantly minimized because these massive and visible rocks were avoided as far as possible.
On the other hand, measurements of κ in various kinds of rocks revealed clear differences among them. The natural magnetic range of drift was investigated in order to know its influence and minimise the heterogeneous magnetic signal of glacial deposit in soils. A magnetic survey covering an area, as big as possible, of undisturbed drift was performed. The median κis values of plutonic and volcanic rocks are higher (168 and 590 × 10-5 SI, respectively) than metamorphic and sedimentary rocks (16.4 and 20 × 10-5 SI, respectively).
Detailed results of magnetic parameters, chemical determinations and PLI calculations - using Eqs 1 & 2, and considering Cr, Ni, Cu, Zn and Pb - of some particular samples (20 samples) are displayed in Table II. In Table II, maximum, minimum, mean and SD values for all samples (46 samples: 41 samples belonging to Marambio Station soils and five samples belonging to a control or “Pristine” soil on the outskirts of the station) are also displayed.
Magnetic parameters and chemical determinations of twenty samples. Minimum, maximum, mean and SD values for all samples are listed.

According to extreme and distinctive values, some samples were selected for more detailed studies. The samples M44, M99, M25 and M134 were studied by performing an experimental method for separation of magnetic phases presented by Chaparro et al. (Reference Chaparro, Lirio, Nuñez, Gogorza and Sinito2005).
Discussion
In situ magnetic susceptibility measurements
Although the range of κis reached values up to 6800 × 10-5 SI, it can be reduced taking out some extreme values. Such extreme values (between 1000 and 6800 × 10-5 SI), belonging to samples from the solid waste disposal area, can be related to iron-rich materials degraded and incorporated into the soil and they were not computed in the contour map (see Fig. 2).
Contour map of in situ magnetic susceptibility measurements (n = 305). Some sampling sites are displayed as reference.

In Fig. 2, the main areas of interest were identified from high values of κis. They include the warehouse and solid waste disposal (around sites M88 and M86), the area from the main accommodation blocks (site M40) to the balloon launch pad (site M25), the tool store (site M258), the power plant (site M134), and the incinerator (site M10). Such sites showed high κis values related to anthropogenic contamination, whether by solid wastes (they can be on the surface, semi-buried or buried in the soil) or by atmospheric pollutants. The latter can be produced by local traffic or by the power plant, and high values are observed in the airstrip and site M134.
Since metallic wastes were thrown in several station sites from 1969 onwards, they could be contributing to the magnetic signal in different places. In some places, wastes are clearly visible, such as the area of solid waste disposal and warehouses; whereas they are not so clearly spotted in other sites, e.g. in surrounding of the main accommodation block.
According to the κis values in local rocks, lithologic contribution is not discarded in these soils. Although rocks were frequently avoided, small fragments and buried rocks (and/or boulders) could not always be kept away. Glacial deposits as the glacial drift of Weddell Sea Formation, are naturally heterogeneous (very poor grain size selection, varied mineralogical composition, local sedimentary or erosional changes and permafrost behaviour differences could be possible as well), even without anthropogenic perturbation, an in-homogeneous magnetic behaviour could be expected and should be kept in mind for comparison between the “Pristine Area” and the station area.
So, in critical sites, χ measurements for sieved hand samples were used for comparison. This procedure allows us to minimise lithogenic contribution to the magnetic signal and investigate the anthropogenic contribution.
In spite of the useful information about these in situ measurements, other magnetic maps in the station were carried out by using magnetic and chemical measurements in the laboratory on hand samples.
Magnetic enhancement and pollution sources
Magnetic concentration dependent parameters (χ, ARM and SIRM) show higher values (one order of magnitude, see Table II) in Marambio sites than in control sites.
The magnetic concentration values from the control sites are regarded as background or baseline magnetic values. Such sites were selected far from the station (∼1.2–1.7 km) in order to rule out the influence of anthropogenic contamination sources. Mean values are 14.2 ± 1.9 × 10⁻⁸ mReference Angulo3 kg-1 for χ; 37.8 ± 10.8 × 10⁻⁶ A mReference Andersson2 kg-1 for ARM; and 2.1 ± 0.8 × 10⁻³ A mReference Andersson2 kg-1 for SIRM. Although the pedological characteristics of these Antarctic soils are different from Argentinean soils, their background values are similar to the ones found in Chaparro et al. (Reference Chaparro, Bidegain, Sinito, Jurado and Gogorza2004). Baseline or minimum values for heavy metal contents in the study area were chosen from these control sites as well.
Magnetic enhancement can be observed in the contour maps for χ, ARM and SIRM based on 41 samples from the station (Fig. 3a–c). Although control site measurements were not considered in them, background values are seen in all three maps. As can be observed in Table II, magnetic enhancement of station samples reaches 5, 3 and 4 times increases in average for parameters χ, ARM and SIRM. Nevertheless, the enhancement is much higher (up to 29, 15 and 26 times, respectively) when maximum values are considered. Although these values correspond to a reduced number of samples, most of them seem to belong to group of polluted samples.
Contour map of magnetic concentration-dependent and grain-size parameters (n = 41). Some sampling sites are displayed for reference. a. Mass-specific magnetic susceptibility, b. anhysteric remanent magnetization, c. saturation of isothermal remanent magnetization, and d. anhysteric susceptibility/magnetic susceptibility ratio.

Some areas and their influence can be noted in Fig. 3a–c around the pinpointed sites M10, M25, M99, M258 and M134. As will be discussed in the next section, these samples (except M99) seem to contain similar magnetic carriers as group P (see Magnetic carriers, features). Such areas comprise different buildings from the station, which are potential pollution sources: an incinerator, a meteorological station and balloon launch pad, a diesel fuel battery, a tool store, and a power plant respectively (see Fig. 1). Three well defined areas with high values are observed in these maps (Fig. 3a–c). Another particularly dark zone is only observed in the SIRM map. According to the analyses of magnetic parameters, magnetic carriers in this site (M99) are different from the other affected sites. So, a high SIRM value might not necessarily be related to strong pollution.
A similar behaviour is seen in the distribution of the grain size parameter κARM/κ-ratio (Fig. 3d): lower values, corresponding to larger magnetic grains, often coincide with areas of high magnetic particle concentrations (Fig. 3a–c).
On the other hand, contour maps of PLI and contents of some heavy metal can be appreciated in Fig. 4. Such maps are qualitatively in agreement with the magnetic maps (Fig. 3). A central dark (the highest values) zone is observed in PLI, Zn, Ni and Cu maps; such area comprises site M134 (the power plant) and site M258 (the tool store). A secondary light dark zone, around site M25, is only noted in PLI, Zn, Cr, Ni and Cu maps. The dark zone on the left of site M134 (the power plant) is well defined for Pb and Cr. Finally, a dark zone in site M99 (end of the diesel fuel battery) is only observed in Ni map. The latter result only matches the ones in SIRM map, being a particular coincidence that should be investigated in more detail in the future.
Contour map of PLI and heavy metals (lead, zinc, chromium, nickel and cooper); n = 18. Some sampling sites are displayed for reference.

Pollution around site M258 and M134 seems to influence a larger area than that close to sites M25 and M10. Thus, the area comprising these sites could behave as a potential sink of anthropogenic pollutant sources. Such activities have spanned ∼30 years, since the Marambio foundation in 1969. Possible sources include fly ashes generated by a power plant (site M134) and solid metallic waste thrown out by daily work at the tool store (site M258).
Magnetic carriers, features
According to S-ratio values, ferrimagnetic materials are dominant in almost every sample. Nevertheless, differences between control samples (from 0.819 to 0.871, mean = 0.841) and station samples (from 0.815 to 0.985, mean = 0.900) qualitatively discriminate them. Higher S-ratio values in station samples are indicative of softer ferrimagnetic phases (e.g. (titano-) magnetite or magnetite-like phases) that can be related to anthropogenic activities and sources in Marambio Station. The overlapping of S-ratio ranges between station data and control data could be indicative of the presence of samples in station sites, which are less or not affected by pollution. So, mean S-ratio of station samples (0.900) can be used as a filter to identify samples dominated by anthropogenic contribution. Thus, a contour map of S-ratio (n = 41) was calculated, but it is not shown; the analysis of this map revealed similar areas that were obtained in Fig. 3. The filtered areas include sites M10, M25, M86, M88, M97, M134 and M258, comprising buildings from the station that are potential pollution sources in agreement with conclusions obtained in Sect. Magnetic enhancement and pollution sources.
HCR analysis is in agreement with conclusions of S-ratio and in most of the station sites values lower than the ones in control sites have been found (Table II). The remanent coercivity varies widely from 14.8 to 142.3 mT; however, some values can be identified as extreme data (samples M99 and M134) and have been further studied. If such values are considered separately, the range is reduced (from 25.9 to 66.4 mT). This is coherent with the (titano)magnetite range according to Dankers (Reference Dankers1981) and Peters & Dekkers (Reference Peters and Dekkers2003); so magnetite and/or titanomagnetite are the main magnetic carriers observed in this soil. Higher HCR values are similar to the ones belonging to the control samples and they can be interpreted as harder magnetite, titanomagnetite, or an additional hard phase of iron oxyhydroxide and/or hematite mineral. The latter is possible in this area according to Santos et al. (Reference Santos, Silva-Filho, Schaefer, Albuquerque-Filho and Campos2005), where such minerals were taken into account as a product of redox processes in these soils. On the other hand, high HCR values can also be interpreted in terms of finer magnetic grain sizes. It is worth mentioning that the lowest HCR values (up to 45 mT) belonged to the possibly polluted station samples. Such low values are different from possibly unpolluted and control sites, and they can be indicative of an extra input, coming from anthropogenic sources.
SIRM/χ values belong to (titano)magnetite ranges, and the increase up to 25.9 kA/m (excepting the sample M99) can be interpreted as a decrease of magnetic grain size. This is especially valid regarding homogeneous magnetomineralogy. Since SIRM/χ parameter can be interpreted either as magnetic mineralogy or as magnetic grain size, it could be a useful parameter for assessing qualitatively magnetic mineralogy if it is combined with HCR parameter (Thompson & Oldfield Reference Thompson and Oldfield1986). This kind of biplot was made for some samples and it is displayed in Fig. 5. From this, three groupings are observed and have been labelled as polluted (P), intermediate (I), and unpolluted (U) cases.
Biplot of SIRM/χ versus remanent coercivity of twenty samples from station site and control site. Three groupings are identified as polluted (P), intermediate (I) and unpolluted (U) cases.

The κARM/κ-ratio and ARM/SIRM parameters are grain size-related parameters, especially sensitive to magnetite grain sizes. Although κARM/κ-ratio values (see Table II) are coherent with SIRM/χ values, their increase indicates finer magnetic grain sizes; ARM/SIRM parameter seems to behave differently. According to Sugiura (Reference Sugiura1979) and Maher et al. (Reference Maher, Thompson, Hounslow, Maher and Thompson1999), the latter behaviour could be due to the effect of the strength of magnetic grain interaction.
Quantitative magnetic grain size estimations were made from Thompson's plot (Fig. 6) and King's plot (Fig. 6b). Both estimations are coherent for most samples of high magnetic concentration, giving as a result magnetic grain sizes ranging from 8 to 25 µm for group P, and from 1 to 8 µm for group I. Samples of lower magnetic concentration show a wide range of sizes for Thompson's plot and sizes <1 µm for King's plot. Differences between both estimations can arise from the low concentration of magnetite, e.g. Tauxe (Reference Tauxe1993) found grain size differences between King's plot and Day's plot attributed to magnetic concentration.
Determination of magnetic grain size and magnetic concentration from a. Thompson's plot, and b. King's plot. All samples from station site and control site are shown.

Assuming the dominance of magnetite, its concentration can be estimated from Thompson's plot (Fig. 6a). The lowest values, between 0.0033 and 0.01%, belong to unpolluted and control samples (group U). Intermediate values are between 0.013 and 0.03%; on the other hand, the highest values are found for group P, ranging between 0.033 and 0.2%.
Stepwise thermal demagnetization curves of SIRM are displayed in Fig. 7. Such measurements support the above magnetomineralogy inferences. Changes in the slope of remanent magnetization allow identify three unblocking temperatures (TU), 188/236°C, 580°C and 685°C for most of samples (Fig. 7).
Stepwise thermal demagnetization curves of SIRM and normalised magnetic susceptibility measured at room temperature (after each step). a. Control samples, b. polluted samples from station sites, c. extreme samples from station sites. Inset displays thermal demagnetization curves in detail for the range 570–710°C.

The first phase, between RT and 188/236°C, corresponds to titanomagnetite carriers (Dankers Reference Dankers1978), although such phase can be observed for most samples, it is especially noticeable in samples M44, M47, M10, M25, M99. The second magnetic phase shows a TU of 580°C that indicates the presence of magnetite (Dankers Reference Dankers1978, Dunlop & Özdemir Reference Dunlop and Özdemir1997). Every sample evidenced this magnetic phase that could be associated to the presence of genetically common sediments of these soils. Since remanent magnetization just vanishes for most samples, magnetite seems to dominate the magnetic signal.
Susceptibility measurement at RT in thermal demagnetization studies is used as a tool for monitoring magnetic mineral changes. If changes take place, they can be associated to different magnetic mineral end products: magnetite, maghemite, and hematite. According to curves of susceptibility, neoformation of magnetite and possibly hematite from ferric minerals (paramagnetic and/or ferromagnetic minerals, Dunlop & Özdemir (Reference Dunlop and Özdemir1997)) has taken place to a different extent for samples M44, M47, M25, M259 and M134 (Fig. 7).
The third phase involves the highest temperatures (685°C) that correspond to hematite carriers. Although such phase shows low values of remanent magnetization, it seems to be still present from 580°C up to 685°C as can be noted in detail for samples M44, M47, M10, M258, M259 and M99 inset in Fig. 7.
Extreme data, discrimination of magnetic phases
As was pointed out before, extreme data (samples M99 and M134) were analysed in more detail by a recently published experimental method to discriminate magnetic phases (Chaparro & Sinito Reference Chaparro and Sinito2004, Chaparro et al. Reference Chaparro, Lirio, Nuñez, Gogorza and Sinito2005). Other samples of interest (sample M44 and M25) were studied as well. Backfield IRM curves (Total and Phase1 and 2) are shown in Fig. 8 where a main and a secondary phase are visible.
Discrimination of IRM backfield for two magnetic phases by performing an experimental method presented by Chaparro & Sinito (Reference Chaparro and Sinito2004) and Chaparro et al. (Reference Chaparro, Lirio, Nuñez, Gogorza and Sinito2005). Curves of Total backIRM, phases and remanent coercivities are shown for selected samples.

The main phase (Phase1) for the control sample M44 corresponds to (titano)magnetite; HCR value (55.5 mT) corresponds to the maximum values obtained for magnetite (Peters & Dekkers Reference Peters and Dekkers2003). This high value may also be related to smaller grain sizes or different oxidation states for this iron oxide. Samples M134 and M25 evidenced softer magnetic characteristic and coarser grained (titano-) magnetite is expected according to lower HCR values (14.0 and 25.8 mT, respectively). The latter samples show characteristics of mono-phase or mono-carrier, and their magnetic carriers are clearly different from the control sample. Such a feature can be associated to the production (pollution) sources. Stepwise thermal demagnetization measurements of SIRM support this interpretation. Remanent magnetization of sample M134 decreases almost linearly accompanied by a large increase of susceptibility. Remanence vanishes at 580°C (Fig. 7c), the Curie temperature of magnetite, so hematite is not present. Remanent magnetization of sample M25 also vanishes at 580°C (Fig. 7b), excluding hematite minerals.
Although, the dominant magnetic phase for sample M99 showed a relatively high HCR value (122.5 mT), it may be associated to titanomagnetite according to Peters & Dekkers (Reference Peters and Dekkers2003). Pyrrhotite may be another possibility to take into account; the remanent coercivity of Phase1 belongs to the pyrrhotite range. According to thermal studies (see Fig. 7c), both minerals are expected from the low temperature phase; ∼90% of remanent magnetization decayed at 300°C, being such unblocking temperature indicative of pyrrhotite mineral (Dunlop & Özdemir Reference Dunlop and Özdemir1997). The presence of pyrrhotite is suggested in surrounding areas by Santos et al. (Reference Santos, Silva-Filho, Schaefer, Albuquerque-Filho and Campos2005), Pride et al. (Reference Pride, Cox, Moody, Conelea and Rosen1990), and Schaefer et al. (Reference Schaefer, Francelino, Simas, Costa, Schaefer, Francelino, Simas and Albuquerque-Filho2004).
The contribution of the secondary phase is especially important for samples M44 (17.3%) and M99 (23.4%); such phases are magnetically hard according to their HCR values (261.9 and 215.9 mT, respectively), suggesting the presence of hematite according to Dankers (Reference Dankers1981) and Peters & Dekkers (Reference Peters and Dekkers2003). Thermal studies indicate that a small high blocking temperature phase is present above 580°C for samples M44 and M99 (Fig. 7a & c). Although normalised values of remanent magnetization are around 0.01, measured values were 13.7 and 99.2 mA/m respectively. Although sample M134 showed a contribution of hematite as well, this secondary phase is very low, ∼3%, whereas an irrelevant (0.7%) hard phase was obtained for sample M25. Also in this case, thermal studies support, for both samples, the phase discrimination obtained by this experimental method.
Heavy metals and PLI
Baseline or minimum values for heavy metal contents in the area under study (Marambio Station, Seymour Island) were chosen from the control sites. This baseline values have been considered as natural trace metal values in Seymour Island, taking into account that the above-mentioned pristine area is an undisturbed place on the plateau, and it is poorly influenced by the station anthropogenic contamination. Baseline values are listed in Table III, among them, 6.1 ± 0.5 mg kg-1 for Cu, 10.2 ± 2.5 mg kg-1 for Pb, and 36 ± 4 mg kg-1 for Zn. These values are also similar to the baseline ones found in Argentinean unpolluted soils by Chaparro et al. (Reference Chaparro, Bidegain, Sinito, Jurado and Gogorza2004). Furthermore, these results are in the range of the values of other sites in Antarctica (see Table III). Values of the control area (this study) and other ones of soils, sediments and volcanic rocks are listed in Table III for purposes of comparison. Soils include areas from southern Victoria Land (Webster et al. Reference Webster, Webster, Nelson and Waterhouse2003), Ross Island (Sheppard et al. Reference Sheppard, Claridge and Campbell2000), and King George Island (Santos et al. Reference Santos, Silva-Filho, Schaefer, Albuquerque-Filho and Campos2005, 2006). Moreover, marine and lagoon sediments belong to areas from King George Island (Vodopivez et al. Reference Vodopivez, Smichowski, Marcovecchio, Caroli, Cescon and Walton2001), Terra Nova Bay (Ciaralli et al. Reference Ciaralli, Giordano, Lombardi, Beccaloni, Sepe and Costantini1998), King George Island (Santos et al. Reference Santos, Silva-Filho, Schaefer, Sella, Silva, Gomes, Passos and Van Ngan2006) and Ross Island (Lenihan et al. Reference Lenihan, Oliver, Oakden and Stephenson1990).
Chemical determinations of soils from Antarctica obtained in this and other studies are summarized. Data from sediments and rocks are listed as well for comparison.

n.d: no data
aThis study
bWebster et al. (Reference Webster, Webster, Nelson and Waterhouse2003)
cSheppard et al. (Reference Sheppard, Claridge and Campbell2000)
dSantos et al. (Reference Santos, Silva-Filho, Schaefer, Sella, Silva, Gomes, Passos and Van Ngan2006)
fVodopivez et al. (Reference Vodopivez, Smichowski, Marcovecchio, Caroli, Cescon and Walton2001)
gCiaralli et al. (Reference Ciaralli, Giordano, Lombardi, Beccaloni, Sepe and Costantini1998)
hLenihan et al. (Reference Lenihan, Oliver, Oakden and Stephenson1990)
iGroeneweg & Beunk (Reference Groeneweg, Beunk and López-Martinez1992)
On the other hand, levels of Zn and Pb for Marambio Station samples largely surpassed their baseline values, up to 14 and 23 times respectively for maximum values; and up to 3 and 5 times for mean values (Table II). This observation together with the known human activity and presence of pollution sources at this station suggest an anthropogenic input for these trace elements. Such activities and sources involve traffic of motor vehicles, planes and helicopters, fuel combustion at a power plant, fuel residues, solid waste disposal, paints, construction material used in the station, galvanised material and their potential incineration. Sheppard et al. (Reference Sheppard, Claridge and Campbell2000), Webster et al. (Reference Webster, Webster, Nelson and Waterhouse2003), and other authors also mentioned some of these activities as sources of pollution in Antarctica.
Levels of Cr, Cu and Ni are moderately higher than the baseline values. Anthropogenic input of Cr may be linked to early use of orange chromium-rich paints, such as splashes in the surroundings of buildings as well as fine particles, or end products of erosion, such as paint flakes. Cu input could have been due to corrosion products of copper from electrical wires or other Cu-rich materials scattered on the ground. Ni contents are low and similar to natural values in other Antarctic areas (see Table III). According to Sheppard et al. (Reference Sheppard, Claridge and Campbell2000), anthropogenic input of nickel may come from the diesel discharge of exhausts or other sources, representing an airborne contamination. Since station values are slightly higher than control values (Table II), anthropogenic Ni input might have influenced at low level these soils.
According to PLI definition (Eqs 1 & 2, computing Cr, Ni, Cu, Zn and Pb), this index gives an assessment of the overall toxicity (only heavy metals) status for a sample being the result of the contribution of several heavy metals. In control samples (M44–47), PLI values close to 1 indicate an unpolluted status due to Pb, Zn, Cr, Ni and Cu. The highest value (4.10, see Table II) was found for sample M134 (in the power plant). The mean value in the station doubled (2.25 ± 0.80) the control mean value; and according to its range, from 1.21 to 4.10, less affected and highly affected areas can be discriminated in the station.
Correlation between magnetic parameters and heavy metals contents
Correlation between some magnetic parameter (χ, ARM, SIRM, κARM/κ-ratio and S-ratio) and heavy metals (Cr, Ni, Cu, Zn, Pb, Fe, and the PLI) for 20 samples was investigated using linear regression. The correlation factors (R) and their corresponding P-values were calculated using Analysis of Variance (ANOVA).
In particular, the correlation of χ is moderate with Fe (R = 0.559, P = 0.010), strong with Cu (R = 0.663, P = 0.001), and moderate with PLI (R = 0.409, P = 0.073). Correlation of ARM is very strong with Fe (R = 0.857, P < 0.0001), moderate with Cu (R = 0.410, P = 0.073); and SIRM is very strong with Fe (R = 0.818, P < 0.0001) and moderate with Ni (R = 0.465, P = 0.039). On the other hand, correlations of feature-dependent parameters are statistically significant with Cu, PLI, and Cr (only κARM/κ-ratio). The correlations of κARM/κ-ratio is moderate with Cu (R = -0.501, P = 0.024), with PLI (R = -0.492, P = 0.028), and with Cr (R = -0.547, P = 0.012); whereas the correlations of S-ratio is moderate with Cu (R = 0.503, P = 0.024) and with PLI (R = 0.449, P = 0.047).
These results show the existence of a moderate relationship between some magnetic and chemical parameters, allowing the use of magnetic parameters mapping for pollution monitoring. Although different heavy metals can be mapped by different magnetic parameters as can be noted from correlations; χ, κARM/κ-ratio and S-ratio can be used to assess the overall heavy metal status through the PLI. However, further statistical studies should be carried out in order to deeply investigate the relationship between sets of magnetic and chemical variables for this particular study area.
Conclusions
After preliminary lab measurements on hand samples, the magnetic signal was strong enough in some sites to justify further studies. Thus, from in situ measurements, main areas of interest were identified as a first-order approach from high values of κis that were related to anthropogenic contamination, whether by solid wastes or by atmospheric pollutants.
Laboratory measurements provided relevant magnetic parameters, so it allows us to improve the magnetic screening in Antarctica. Remanence parameters and thermal measurements indicate the predominance of ferrimagnetic materials in most samples, but differences between control samples and station samples discriminate them. Magnetite, titanomagnetite, pyrrhotite and hematite mineral are identified; with magnetite and titanomagnetite being the main magnetic carriers. Furthermore, the separation of backfield IRM curves into magnetic phases is in agreement with the presence of dominant and subordinate magnetic carriers. Coarser magnetic grain sizes and higher magnetic concentration of carrier were found in polluted samples. Moreover, biplot of SIRM/χ vs. HCR allowed discriminating three groupings identified as polluted (P), intermediate (I), and unpolluted (U) cases.
Heavy metal contents in a control site are similar to other areas in Antarctica. However, levels of Zn and Pb and PLI values for Marambio Station samples highly surpassed their baseline values. Mean PLI value in the station doubled the control mean value; and less and high influenced areas could be discriminated. Anthropogenic input for trace elements involves traffic, fuel combustion at a power plant, fuel residues, solid waste disposal, paints, construction material used in the station, galvanised material and their potential incineration.
Magnetic enhancement was observed in contour maps for χ, ARM and SIRM. The distribution of magnetic grain size parameter (κARM/κ-ratio) and the S-ratio also showed differences in station sites that allowed to identify less/more polluted sites. On the other hand, contour maps of PLI and contents of some heavy metal are qualitatively in agreement with magnetic maps.
Simple correlation analysis showed the existence of relationships and moderate correlations between some magnetic and chemical parameters. Especially, χ, κARM/κ-ratio and S-ratio can be used to assess the overall heavy metal status through their moderate correlations (0.409–0.492) with PLI. Therefore, contamination in this area could be monitored by using a cost-effective and less time consuming approach; so the magnetic method should be continued in the future.
Acknowledgements
The authors thank the Dirección Nacional del Antártico (DNA, Argentina) for their logistic support in Marambio station; the Universidad Nacional del Centro de la Provincia de Buenos Aires (UNCPBA), the Agencia Nacional de Promoción Científica y Tecnológica (ANCyT) and the National Council for Scientific Technological Research (CONICET) for their financial support. The authors are grateful to the Czech Geological Survey (Central Laboratory), V. Zoulková, M. Miksovský, H. Hanusová and Dr Mlcoch Bedrich for chemical measurements. They are also indebted to Mauro Chaparro, Claudia Marinelli and C. Marié for their assistance. The authors really appreciate the contribution of reviewers: Drs H. Böhnel, M. Hanesch, E. Petrovský and A. Vaughan, in particular, for their detailed revisions and valuable comments.



