





Introduction
Despite government and public support for rural infrastructure improvement following the Second World War, within less than a decade, rural England saw positive intentions clawed back. For sewerage, national governments deliberately delayed investment and watered-down commitments, thereby perpetuating rural deprivations. Embedded in slow national actions were the underpinnings for processes leading to a more socially exclusive middle-class countryside, with an accompanying increased threat to environmental quality.
That rural England had inferior infrastructure in 1945 is widely recognised, but this was not ordained. For electricity, for example, rural residents in England were themselves complicit in the poor provision by resisting the modernising possibilities of electrical supplies.Footnote 1 Such tendencies were not general, as exemplified by Belgium and Japan. These nations run counter to the regularly cited view – as expressed for early-nineteenth-century water supply in EnglandFootnote 2 – that private services shadow the geography of wealth, thereby enhancing access inequities and promoting socially exclusive landscapes.Footnote 3 In Belgium and Japan, electrification was privately driven initially, with rural supplies approximating their arrival in towns.Footnote 4 In Britain (and Spain), rural–urban contrasts were significantly sharper.Footnote 5 In 1958, for instance, while only 70.3% of UK farms had electricity, this paled in comparison to Belgium at 99.6%, Sweden at 99%, France at 97.6%, Germany at 97%, the United States at 95.5% and Switzerland at 95%.Footnote 6 Regional inequalities were also stark, with 1953 farm divergence ranging from 17.4% (South Wales) to 69.4% (Southern Region).Footnote 7 Why did Britain lag behind, and why were its internal differences so great? For piped water and mains sewers, these questions are poignant, as Britain provided these facilities early and soon reset their provision to state agencies to garner wider societal benefits (such as fire protection, healthier citizens and manufacturing growth).Footnote 8 Yet, rural delivery trailed far behind. Thus, while 1880 saw sewerage systems in 95% of English and Welsh towns above 10,000 population,Footnote 9 by 1939, 30.7% of rural parishes lacked piped water and 46.4% lacked sewerage.Footnote 10 Even in 1971, 25% of English and Welsh rural inhabitants had no mains sewer connection, with 15% in the rural South-West still not linked by the late 1980s.Footnote 11
It might be suggested that England represents a rural ‘norm’, given that lower population densities increase costs and slimmer wages weaken consumer demand. Hence, even during the interwar period, when rural infrastructural investment was sought, suppliers were reluctant to comply unless amply compensated beforehand.Footnote 12 In contrast, Belgian state agencies underpinned rural incursions by private firms, while Japanese companies saw profit in countryside investment, thereby giving both nations high supply densities prior to 1939. A contrast with Britain was apparent generally in its dissimilar approach to state intervention, as captured in Taylor’s conclusion that soon after 1918: ‘The British government jettisoned their economic responsibilities helter-skelter’.Footnote 13 Other commentators articulate how interwar governments were convinced that little was gained from state intervention, while resource constraints forbade action.Footnote 14 But this reticence was directed only at particular social groups, as seen in energetic interventions to support elite rural activities: ‘That the national economy could “afford” to divert so many resources to elite [‘blood’] sports contradicts the dominant view that England came up against a resources barrier’.Footnote 15
Official 1940s messaging that lamented rural deficiencies provoked expectations of significant improvement over the 1945–1974 period explored here. These decades saw the old ‘rural order’ challenged as landowner ties to localities weakened, urban middle-class inflows grew and the rural economy diversified and expanded.Footnote 16 Yet some tendencies reinforced the past, as with early postwar policies favouring traditional views of rural society.Footnote 17 Furthermore, until local government reorganisation in 1974 abolished rural district councils (RDCs) in favour of larger urban-centred authorities, local government arrangements helped sustain ‘traditional’ power structures.Footnote 18 Hence, as the Armistice approached, internal Whitehall papers and official statements warned that rural councils were likely to make slow progress in implementing improvement policies, given their staff shortages and reluctance to increase local property taxes (the rates).Footnote 19 Yet, when explored through the lens of postwar improvements in rural sewerage, this investigation concludes that hesitant, risk-averse action came not from rural councils, but from the corridors of Westminster and Whitehall.
Context
Peacetime in 1945 occurred against a backdrop of interwar social division.Footnote 20 This was expressed in patterns of unemployment, house-building, and regional inequality, with rural–urban divergence sharpening in actuality and official messaging.Footnote 21 Illustratively, the rural share of housing in England and Wales fell from 21.9% to 19.0% between 1919 and 1939. While densely settled areas, like the rural Southeast, benefitted from middle-class in-migration, ‘peripheral’ countrysides ‘… lived and worked in conditions which were coming to seem unbelievably primitive’.Footnote 22 Fuelling demand for change, ‘the social radicalism of wartime’ shrank social class divisions, generating official calls for remedial action to reinvigorate the countryside.Footnote 23 As the Scott Report put it: ‘The drift from the country was continuing right up to the outbreak of war in 1939. There is no doubt that the main causes of this exodus have been the lower wage received by agricultural workers, the bad standard of housing and the lack in many districts of a proper water supply, of sewerage and of electricity’.Footnote 24 The interwar years reinforced deprivation for the less advantaged, as seen with English and Welsh RDCs securing 23.1% of new private houses but only 13.9% of council-built homes.Footnote 25 The urgency to improve rural fortunes was exacerbated by balance of payments deficits, as poor worker conditions were believed to damage farm output. Promises followed, including more secure farm incomes, higher farm-worker wages, and a ‘… radical improvement of rural housing conditions … [with] the extension of public services such as water, sewage disposal, electricity and gas in rural areas’.Footnote 26
On sewerage, rural leaders had contributed to poor interwar provision, as infrastructure schemes were often resisted. Some councils argued that the longevity of residents made improvements ‘unnecessary’, others that villagers feared rates increases.Footnote 27 Capturing how these sentiments affected supply is not straightforward, for, compared to water or electricity, information on sewerage provision was poor. Hence, while the 1951 UK Census enumerated household availability of baths, piped water, and water closets, waste from these facilities was ignored, even in later Censuses. Official publications, and Hansard, periodically reported on water and electricity provision, but authoritative figures on sewerage were rare.Footnote 28 The same applied cross-nationally, with piped water tabulated regularly by country, but not sewerage.Footnote 29 To capture how sewerage services changed, reliance here primarily targeted 17 English RDCs. These were selected in two tranches: the first stretched outward from London, over Bedfordshire, Hertfordshire, and Norfolk, so impacts from expected middle-class in-migration varied, while farmer control of rural councils was uneven; the second searched across England to identify RDCs with high or low council new-build rates relative to local manual workforces, which yielded study districts in Dorset, Kent, Surrey, Worcestershire, and today’s North Yorkshire.Footnote 30 Indicative of how these 17 stand amongst all 410 English RDCs, their average rank for new dwellings per 1,000 households over 1945–73 was 223rd for council homes and 213th for private; near the mid-rank for both. Of course, selecting districts on house-building grounds alone did not directly pinpoint sewerage conditions. Nevertheless, without further information, it aligned with demand for new sewerage investment.
To assess sewerage gains ideally required data for (say) 1945/46. Unfortunately, even RDC medical officer of health (MOH) annual reports largely omitted such insight. Reportage increased into the 1950s, but accounts were often ephemeral or absent, although council minutes and newspapers deepened coverage. Even without precise numbers, it was clear sewerage provision was low. While cities had the resources to self-fund sanitation schemes and sponsored Parliamentary Bills to approve them,Footnote 31 before 1929 RDCs had to levy project charges on single parishes. Only in 1934 was a Treasury subsidy introduced for rural sanitation, with a meagre £1 million budget. This was feeble support, as rural councils (let alone parishes) generally could not afford capital outlays for sewers; often, even with grant aid. Indeed, it was well known in the ministry that small RDCs were ‘… too poor to tackle rural housing and its necessary water supplies and sewerage with reasonable efficiency’.Footnote 32 That small, inadequately resourced units administered sewerage is epitomised in there being 1,400 water and sewerage authorities in England and Wales in 1945. The 1963 Water Resources Act consolidated water undertakings into 198, but sewerage was left with 1,393.Footnote 33
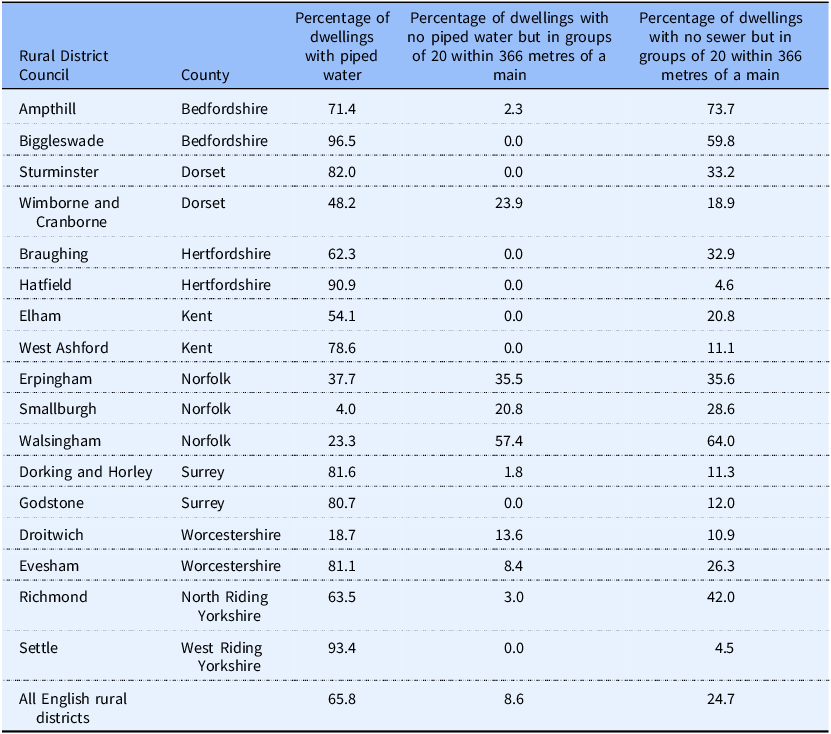
Not surprisingly, many new prewar country homes were built without drainage. Waste was expected to be thrown onto gardens. Council homes commonly had large gardens to enable the practice, with lamenting if homes lacked space to bury nightsoil.Footnote 34 For cost and demand reasons, prospects of sewer provision were higher in larger villages. An intra-district geography began to emerge, as in Hatfield, where 1920s piped water and mains sewers arrived alongside new builds in densely settled areas, but not in smaller or dispersed settlements.Footnote 35 This pattern also occurred across districts, with sewerage more likely where populations were concentrated into few settlements, in wealthier areas and in districts abutting urban centres, as extensions might be feasible as private development tracked main roads and urban edges to reduce costs,Footnote 36 while certain town councils embraced revenue and prestige gains from expanding into nearby villages.Footnote 37 Table 1 presents a sense of resulting patterns. By 1940, diversity of supply was seen in only 4.0% of Smallburgh dwellings having piped water, compared with 95.6% in Biggleswade, while, in Worcestershire, Droitwich recorded 18.7% but adjacent Evesham 81.1%. That Table 1 highlights dwelling clusters of 20 is significant, for Whitehall thinking at the time reiterated that ‘For groups of more than 20 houses sewage disposal facilities providing full treatment are essential’;Footnote 38 and, as ‘It is generally uneconomical to provide centralised sewage disposal works in rural areas unless the properties to be drained lie fairly close together … Grants will be limited for the time being to proposals that meet the criteria’ [groups of 20 plus].Footnote 39 Hence, Table 1 suggests that some RDCs would struggle to secure permission for mains sewers (e.g., Droitwich, Smallburgh), given more dispersed populations and limited existing piped water, whereas others (Godstone, Settle) had water provision that would encourage sewer investment. Districts with numerous dwellings in small clusters away from sewers generally reported few parishes with sewers, such as with three each in Ampthill (out of 29) and Biggleswade (out of 25), while Dorking and Horley had sewers in six of 12. Early postwar, this translated into 55.4% of Dorking and Horley dwellings being mains-linked, with 32.6% using cesspools, 3.0% septic tanks, and 8.9% without drainage.Footnote 40 By contrast, Walsingham had around 46% of dwellings without drainage or with unsatisfactory drainage, while Elham, with just one parish sewered by 1953, had 9.3% of private homes mains-connected, 56.7% on cesspools or septic tanks, and a non-attributed breakdown across pail closets, earth closets, or no drainage totalling 34.0%.Footnote 41 The contrast with Gallardo-Albarrán’s message that 95% of English and Welsh towns possessed sewer systems as early as 1880 is not a positive one.Footnote 42
Indicators of sanitation provision in 17 investigated rural districts in 1940

Table 1. Long description
A table comparing sanitation provision in rural districts in 1940. The table has 18 rows and 4 columns. The columns are labeled Rural District Council, County, Percentage of dwellings with piped water, Percentage of dwellings with no piped water but in groups of 20 within 366 metres of a main, and Percentage of dwellings with no sewer but in groups of 20 within 366 metres of a main. The rows list various rural district councils and their respective counties, along with the percentages of dwellings with piped water, dwellings with no piped water but in groups of 20 within 366 metres of a main, and dwellings with no sewer but in groups of 20 within 366 metres of a main. Notable trends include a wide range of percentages for dwellings with piped water, from as low as 4.0 percent in Smallburgh to as high as 96.5 percent in Biggleswade. Similarly, the percentage of dwellings with no sewer but in groups of 20 within 366 metres of a main varies significantly, with Walsingham having the highest at 64.0 percent and Sturminster the lowest at 33.2 percent.
Source: Computed from TNA HLG50/2152 Rural Districts. Numbers at 1 January 1940.
National policy and rural sewerage
Parliamentarians commenting on the lamentable state of countryside drainage just after Armistice provided vivid accounts, such as Cambridgeshire MP Arthur Stubbs characterising villagers near Newmarket as having to ‘… pick up their children and carry them to school across puddles of water from the cesspool in the garden’.Footnote 43 Such accounts were informed by incidents during the interwar private housing boom, when contaminated drinking water invoked gastro-enteritis and typhoid outbreaks.Footnote 44 In a political milieu favouring redress for interwar neglect, little surprise that Horsham MP Frederick Gough emphasised that: ‘… many parts of my constituency depend entirely on shallow wells’.Footnote 45 The threat posed was real. Thus, 65.1% of tested samples from 1950 wells in Walsingham were deemed unfit for human consumption, as were 84.2% in 1948 Droitwich, where 66.7% were still deficient two decades later.Footnote 46 The danger was not restricted to wells, for up and down the urban hierarchy local authorities extracted drinking water from rivers, so pollution of any origin was troubling.Footnote 47 Failure to address poor facilities also raised fears of retaining farm workers. Women’s organisations actively lobbied for improved country conditions, which did yield some positive RDC responses, including widening sewer investment plans, accepting design proposals for new homes, and prioritising favoured house types.Footnote 48 But any action was handicapped by previous interwar ‘penny-pinching’, which saw short-term thinking over trunk sewer costs, limiting extensions to mains networks.Footnote 49 This mindset stretched into investing in sewage treatment plants. Payback was early, with many small treatment units overloaded in the late 1930s. Richmond captured a common theme, illustrated in examples below, wherein early postwar: ‘The majority of the existing sewage disposal works are inadequate and defective’.Footnote 50 With Whitehall reluctant to approve cesspool or septic tanks for new council homes,: ‘… the only really satisfactory method of dealing with sewage is by the provision of proper facilities [viz. mains sewers]’.Footnote 51 The 1944 Rural Water Supplies and Sewerage Act raised the prospect of better outcomes, with the £1 million grant cap of 1934 raised to £15 million, which increased again to £45 million in 1951. But postwar shortages of labour and materials initially limited mains construction, with councils informed that the ministry ‘… would insist on the provision of [local] sewage disposal plants as recommended in the Housing Manual’.Footnote 52
Of course, labour and materials also handicapped house-building, but ‘… housing was just about the most politically sensitive portfolio in the Cabinet’ up to 1954.Footnote 53 It was prioritised. The implication for sewer building was less funding. National policy: ‘… tended to give priority to rural water schemes, partly because country people are no longer content to drink well-water of dubious quality and partly because, as part of the Government’s agricultural policy, it was thought proper to make at least a modest effort towards enabling farms and farm workers to have piped water supplies’.Footnote 54 Before this emphasis played out, there was already a mismatch between sewerage and water services. Godstone exemplified well-supplied districts, with 80.7% of 1940 dwellings with piped water, but only 61.2% sewer connected by 1945.Footnote 55 The consequences were clear: ‘The provision of a piped water supply results inevitably in a large per capita increase in the consumption of water, and may render inadequate many local sewerage systems previously both efficient and adequate’.Footnote 56 The prioritisation of water occurred despite environmental and health gains accruing if efficient waste removal accompanied piped waterFootnote 57 and ran counter to 1944 Act expectations, which envisaged contemporaneous provision.Footnote 58
For house-building, councils often faced a near blank sheet for sewerage services. Hence: ‘A very serious limiting factor in the provision of new houses in the district and one which added considerably to the cost per house is the absence of water and sewer services’.Footnote 59 Extra costs, which threatened ministry loan sanction at a time of restricted resources, highlighted how successful rural councils were in erecting new homes. For 1945–51, RDCs secured an annual council-build rate per 1,000 households of 9.3, compared with an all-England score of 8.0.Footnote 60 The return of a Conservative government in 1951 dimmed this over-achievement, but only marginally, with RDC completions of 16.7 against England’s 14.4 for 1952–54. But the 1951 Conservatives were electorally insecure.Footnote 61 With private builders ill-prepared for a large housing programme,Footnote 62 electoral promises of 300,000 new homes a year saw the Conservatives ‘… publicly espousing the efficiency of the private sector, while it meanwhile was increasing the level of state provision to meet its goals’.Footnote 63 The paradox was transparent in early Cabinet papers promoting owner-occupation.Footnote 64 Shoring up electoral support through public sector building, while yearning to accelerate private construction, saw the Treasury squeeze non-housing public services. Amongst other cuts, 1952 investment plans shrank ‘non-essential’ water and sewerage projects.Footnote 65 Likewise, when a further £100 million in capital savings was sought in 1954,Footnote 66 the penalty for rural water and sewerage was that: ‘After six years of war (during which annual expenditure dropped to less than a fifth of the pre-war amount) and eight years of postwar restriction (during which the annual volume of work was always less than two-thirds of prewar), we are proposing to try, in 1954–5, to keep local authorities down to a volume of work very considerably less than that allowed in 1938-9’.Footnote 67 For the Dorking and Horley MOH, this meant ‘… the virtual exclusion of other matters of urgent public health importance notably in questions of main drainage’.Footnote 68 High demand for rural sewerage had seen late 1940s limits on approvals, as shortages threatened to over-heat the construction industry: ‘The problem is how to keep the machine sufficiently fed without gorging it’.Footnote 69 Hence, by mid-1950, the ministry was only approving projects addressing urgent health issues or where new houses would be unoccupied. This meant 250 rural schemes ‘stand postponed although otherwise ready to proceed’.Footnote 70
In the 1950s, the squeeze stiffened. For the 1951 Conservatives ‘… it was politically important not to reduce the number of local authority houses built below the number built by the previous government’,Footnote 71 which view Winston Churchill embraced with the proviso: ‘The great thing is to begin as few public buildings as possible’.Footnote 72 Initially, however, council-build was essential to attain electorally sensitive targets. As the economy improved, emphasis shifted toward private construction. This adjustment embedded a trend, subdued until 1954 then more aggressively, of prioritising cities. For house-building, the change was evinced in 1945–54 RDC to England ratios in council-build rates of 113.7 (England = 100), compared with 75.0 for 1955–73. Urban advantage was aided by electoral worries over housing shortage and slum concentrations in cities, alongside construction company lobbying for large-scale building projects.Footnote 73 With dwindling non-housing public investment, more prosaic reasons targeted sewerage cuts: ‘The fact is that with the expanding housing programme on the one hand, and our capital investment limits on the other, we have had to concentrate on schemes which will benefit the greatest number of people – mainly water and sewerage for urban housing schemes’.Footnote 74 Treasury commitments fell as: ‘Urban water schemes by and large pay for themselves through the water charges. Charges contribute to the cost of rural schemes but do not cover them’.Footnote 75 Economic benefits from rural schemes, like improved farm production, encouraging house-building or widening rural economic prospects, were downplayed. Rural sanitation was deemed ‘social’ investment, not ‘economic’, which meant: ‘The Ministry does not put this very high on its own agenda’.Footnote 76 In consequence: ‘The law against pollution, the efforts to end insanitary living conditions, and the national policy of encouraging agricultural development through better rural housing and better farming techniques, are all being frustrated by lack of piped water supplies in some areas and lack of proper drainage in others’.Footnote 77 Rationalising limited rural investment could be flippant, as a Treasury letter demonstrated: ‘We appreciate that many rural communities lack the standard of water supplies to which town dwellers have long been accustomed; but at a time when it is vital to ease the burden of Government spending we must surely consider whether rural areas which have been without piped water for centuries cannot wait a little longer for this amenity’.Footnote 78 And wait they did. To give three examples of regular messages in council minutes, Biggleswade was informed there was no prospect of changing a decision to defer its scheme, Evesham that the Ministry was unable to say when a scheme could start, and Wimborne and Cranborne, while initially delighted the minister approved its plans, was ‘… dismayed to learn that the Minister was reluctant to afford the appropriate grant to which the Council was entitled’.Footnote 79 Delays were not short-lived.
Over time, postponements fed Whitehall qualms: ‘… we have done all we can to discourage [Local] Authorities from putting schemes forward to us at all, there is at present about £35 million of rural sewerage schemes held up in the Ministry, of which at least £10 million are really urgent’. Illustrating internal Whitehall frustrations, a 1954 ministry report highlighted the 1949 Conservative proclamation that: ‘A Conservative Government will give rural water supplies and sewerage the highest possible priority … a Conservative Government will cut drastically the administrative delays by which so many schemes for water supplies and sewerage are held up …’, followed by listing total rural water and sewerage commitments since 1951: £10 million (1950/51), £7.6 million (1951/52), £6.9 million (1952/53) and £6.8 million (1953/54).Footnote 80 By 1954, ministry officials feared that: ‘… our larder of excuses is just about bare’.Footnote 81 The situation was to worsen. Policy aims and rationales confused councils and Whitehall alike. The ministry was accused of arbitrary decisions, as with agreeing schemes without Treasury support when resulting rate-burdens were deemed ‘insufficient’, restricting sewer funding to new housing only, despite locally overloaded processing plants, or changing the practice of funding schemes where piped water was available to only approving awards if pipes were added after 1934. Whitehall officials knew criteria were arbitrary,Footnote 82 with transparent irritation over their implementation: ‘Our present difficulty is clearly the result of turning into a general dogma something which began as a small commonsense rule for the avoidance of unnecessary work!’ Levels of exasperation were matched by RDC taunts that grants criteria were shrouded by ministry ‘hole in the corner methods’.Footnote 83 Indeed, when the Rural District Councils’ Association complained of rural discrimination, the internal response was blunt: ‘No one in Grants Section knows the reason for this [decision on criteria] and I can trace nothing in papers showing when the decision was made. I see no logical grounds for defending this decision …’.Footnote 84
Delay and obfuscation characterised rural experiences. In Godstone, for example, a new sewage treatment unit was opened at Felbridge in 1962, but from a 1939 proposal, revived in 1949, but only afforded a public inquiry in 1958, followed by ministry demands for alternative proposals, which delayed site agreement until 1961.Footnote 85 Of longer duration, the Brotherton, Bryam and Fairburn scheme in Osgoldcross had been held up for 18 years by 1963, with rejoicing over its 1970 completion tempered when faults in new sewers required improvement plans. Such delays saw only three of 19 Osgoldcross parishes with mains sewers in 1966. These covered just 39.8% of dwellings, although this rose to 74.3% in 1973.Footnote 86 How representative these numbers are can only be estimated, as MOH reports often list past year connections only (and then intermittently) or parishes sewered (often partially). Parish counts underestimate dwelling connections because larger settlements were favoured. Hence, when Settle reported 16 of 30 parishes sewered (53.3%), this covered about 86% of dwellings, with Ampthill figures of 79.3% and 87.8%.Footnote 87 For the districts examined, toward 1974, dwelling connections were also listed for Elham (72.2%), but, if at all, by parishes only for others; as with Biggleswade, Braughing, Dorking and Horley, and Richmond, at 63.6%, 57.9%, 58.3% and 32.5%, respectively.Footnote 88 Potentially, these suggest 70%–90% dwellings coverage by the early-1970s; a remarkable improvement on 1945 but shabby beside near 100% coverage in London a century earlier.Footnote 89 While some improvement did accompany Labour’s return to government in 1964, investment remained constrained. Faced with severe housing shortages, the new government was convinced the worst conditions were in cities, which worldview saw continued constraint on rural sewerage investment, with loan sanctions deferred unless projects were urgent.Footnote 90
House-building and sewerage supply
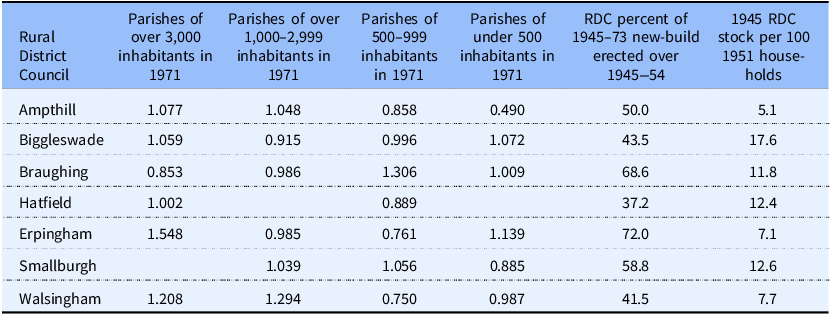
In 1942, improving rural housing was deemed the second most important national housing priority, after repairing war-damaged homes.Footnote 91 With mains sewer availability deemed ‘non-existent’ or a constraint on rural construction,Footnote 92 most new council homes were linked through drainage networks to local treatment plants. As this raised costs, RDCs proposed omitting treatment works from housing schemes,Footnote 93 which generally induced ministry refusals,Footnote 94 or sought lower per unit costs by connecting to existing homes, which contravened government regulations.Footnote 95 The ministry even blocked developments without mains sewers; telling authorities not to build (or occupy if built) until mains arrivedFootnote 96 or to ignore local housing need and build only where sewers existed.Footnote 97 These instructions extended to modernising older council homes, for which upgrades were limited unless sewer connected.Footnote 98 The rationale was grudgingly understood by councils, as piped water could overwhelm treatment facilities, but unwillingness to support treatment plants was criticised.Footnote 99 Moreover, as small plants required at least 20 (usually more) new homes for approval, council-build gravitated toward larger settlements. Table 2 offers a cautious glimpse of outcomes, with larger settlements generally the foci of council building. This message requires teasing out because Table 2 disguises tendencies somewhat, for council home distributions in 1971 were composites of homes built prewar, between 1945 and 1954, with centralisation forces weaker in both eras, and after 1954, when they were stronger. Hence, places like Ampthill, with low interwar building rates and a less pronounced 1945–54 building phase, had poorer provision in smaller parishes, compared with adjacent Biggleswade, which had significant interwar construction. Despite limited housing data by parish, available evidence confirms centralising outcomes. Thus, over 1943–73 in Braughing, the share of total RDC dwellings in parishes of over 1,000 inhabitants increased by 15.3%, while in West Ashford, over the shorter span of 1964–69, council dwellings rose by 18.7% in places with 1,000 plus residents but by 3.1% elsewhere.Footnote 100 Despite many councils wanting to build in all parishes;Footnote 101 poor sewerage constrained construction in smaller villages.Footnote 102 Even in larger villages, ‘peripheral’ zones were often omitted from schemes as ‘unremunerative’.Footnote 103 Restraint even impacted whole settlement system planning, as in Devon, where half of planned ‘growth villages’ could accept no new housing due to sewerage inadequacies.Footnote 104 Poor sewerage disrupted land-use plans, although this came with a lighter touch for private-build.
Ratio public sector tenancies per 100 dwellings compared to RDC as a whole by 1971 parish population

Table 2. Long description
A table comparing public sector home tenancies per 100 dwellings by parish populations in 1971. The table has 8 rows and 6 columns. The columns are labeled as follows: Rural district council, Parishes of over 3,000 inhabitants in 1971, Parishes of 1,000-2,999 inhabitants in 1971, Parishes of 500-999 inhabitants in 1971, Parishes of under 500 inhabitants in 1971, RDC percent of 1945-73 new-build erected over 1945-54, and 1945 RDC stock per 100 1951 households. The rows are labeled with different parishes: Ampthill, Biggleswade, Braughing, Hatfield, Erpingham, Smallburgh, and Walsingham. Each row contains values corresponding to the columns. For example, Ampthill has values 1.077, 1.048, 0.858, 0.490, 50.0, and 5.1. The table provides a detailed comparison of public sector tenancies across different parish populations and highlights the percentage of new-build erected and the RDC stock per 100 households in 1945.
Note: The RDCs shown were the only ones for which data were acquired at parish level. That the Census provides numbers for ‘public sector’ not ‘council’ tenants only impacted on Hatfield here, due to its associated new town, although tenancies exchanged both ways between the RDC and the New Town Development Corporation.
Source: Computed from 1971 Census parish tabulations.
Private building was controlled by license until 1954, with tight limits on numbers pre-1951 as Labour believed owner-occupation was favoured interwar to the detriment of rented accommodation.Footnote 105 After 1951, more private construction was sanctioned, with restrictions further diluted from 1954.Footnote 106 Post-1954, council-build fell, with ‘general needs’ Treasury subsidies removed in 1956, while ministry new-build allocations shifted toward towns and cities. This occurred despite most rural areas experiencing population growth.Footnote 107 For 1951–61, six of the 17 investigated RDCs lost population, but only one did for 1961–71, leaving four declining over 1951–71; two in moorland Yorkshire (Richmond, Settle) and two in north Norfolk (Erpingham, Walsingham). Excluding institutional residents (like the military), reduced this number to two. Most striking was Richmond, which had two military camps (Catterick). Its 1951–71 population fell by 21.3% but residents in private households rose by 101.7%; shrinkage came from lost military numbers, not household demand. While the combined population of the 17 districts rose by 27.2% over 1951–71, household numbers grew by 51.0%; slightly below the English RDC figure (54.0%) but well above England’s (26.1%). Nationwide, the ratio for private construction rates in RDCs against all-England was 143.0 for 1945–54 then 162.2 for 1955–73. Rural private construction expanded, while social provision lagged. This sharpened the divide between rural and urban areas, by tenure and by implication social class. This was signalled as government policy in the mid-1950s: ‘… bigger allocations of [council] houses to be started in 1955 were given to local authorities in industrial areas, while reductions were made for those areas where private enterprise builders were undertaking a large house building programme’.Footnote 108
Within districts, a similar segregation emerged. Many studies pinpoint how land-use planning concentrated rural residential development, with a market-driven social exclusivity unfolding, as house prices in smaller villages rose, giving them higher-grade socioeconomic tones.Footnote 109 Yet the directing role of planning was not as compelling as often imagined, as weaker restraint on private-build occurred outside ‘growth villages’.Footnote 110 Although county council planners might reject applications contradicting land-use plans, developers could challenge refusals by appealing to the Minister. Government priorities were signalled by overturning rejections and, for council-build, embargoing or approving drainage schemes.Footnote 111 Soon after 1951, the treatment of owner-occupied and social housing diverged. For councils, new-build without appropriate sewerage was problematical.Footnote 112 The ministry offered fewer constraints on private construction. Wimborne and Cranborne captured local frustrations: ‘Building development along the southern boundary of the district has continued unabated in spite of the lack of main drainage. Although the Local Planning Authority has endeavoured to prevent the use of sites in low-lying wet areas, the efforts have received no support from the Ministry of Housing and Local Government when cases have come to appeal’.Footnote 113 Councils securing new sewer lines found sanitation gains overridden by house-building without drainage elsewhere.Footnote 114 The result was ‘… a multiplicity of cesspools, septic tanks and soakaways which are a continual source of insanitary conditions and nuisances’.Footnote 115 Government acceptance of unsewered private-build continued for decades.Footnote 116 Councils complained regularly about this. Councillors told public audiences too many houses were built because the Minister accepted inadequate drainage.Footnote 117 They supported building bans based on sewerage insufficiencies and system breakdowns.Footnote 118 Ministerial advocacy of more country homes prompted outrage over failed applications for drainage on unsewered sites on which house-building then became permitted.Footnote 119 Reflecting on 1945–74, Osgoldcross captured sentiments: ‘Although it was anticipated that all pails and privies would be eliminated by now, the delay in implementing various village main drainage schemes due to one national financial crisis after another, during the past, has not made this possible’. How far this was due to national crises, rather than failure to invest, is a moot point, as suggested by planned town expansion schemes facing sewer restrictions decades later.Footnote 120
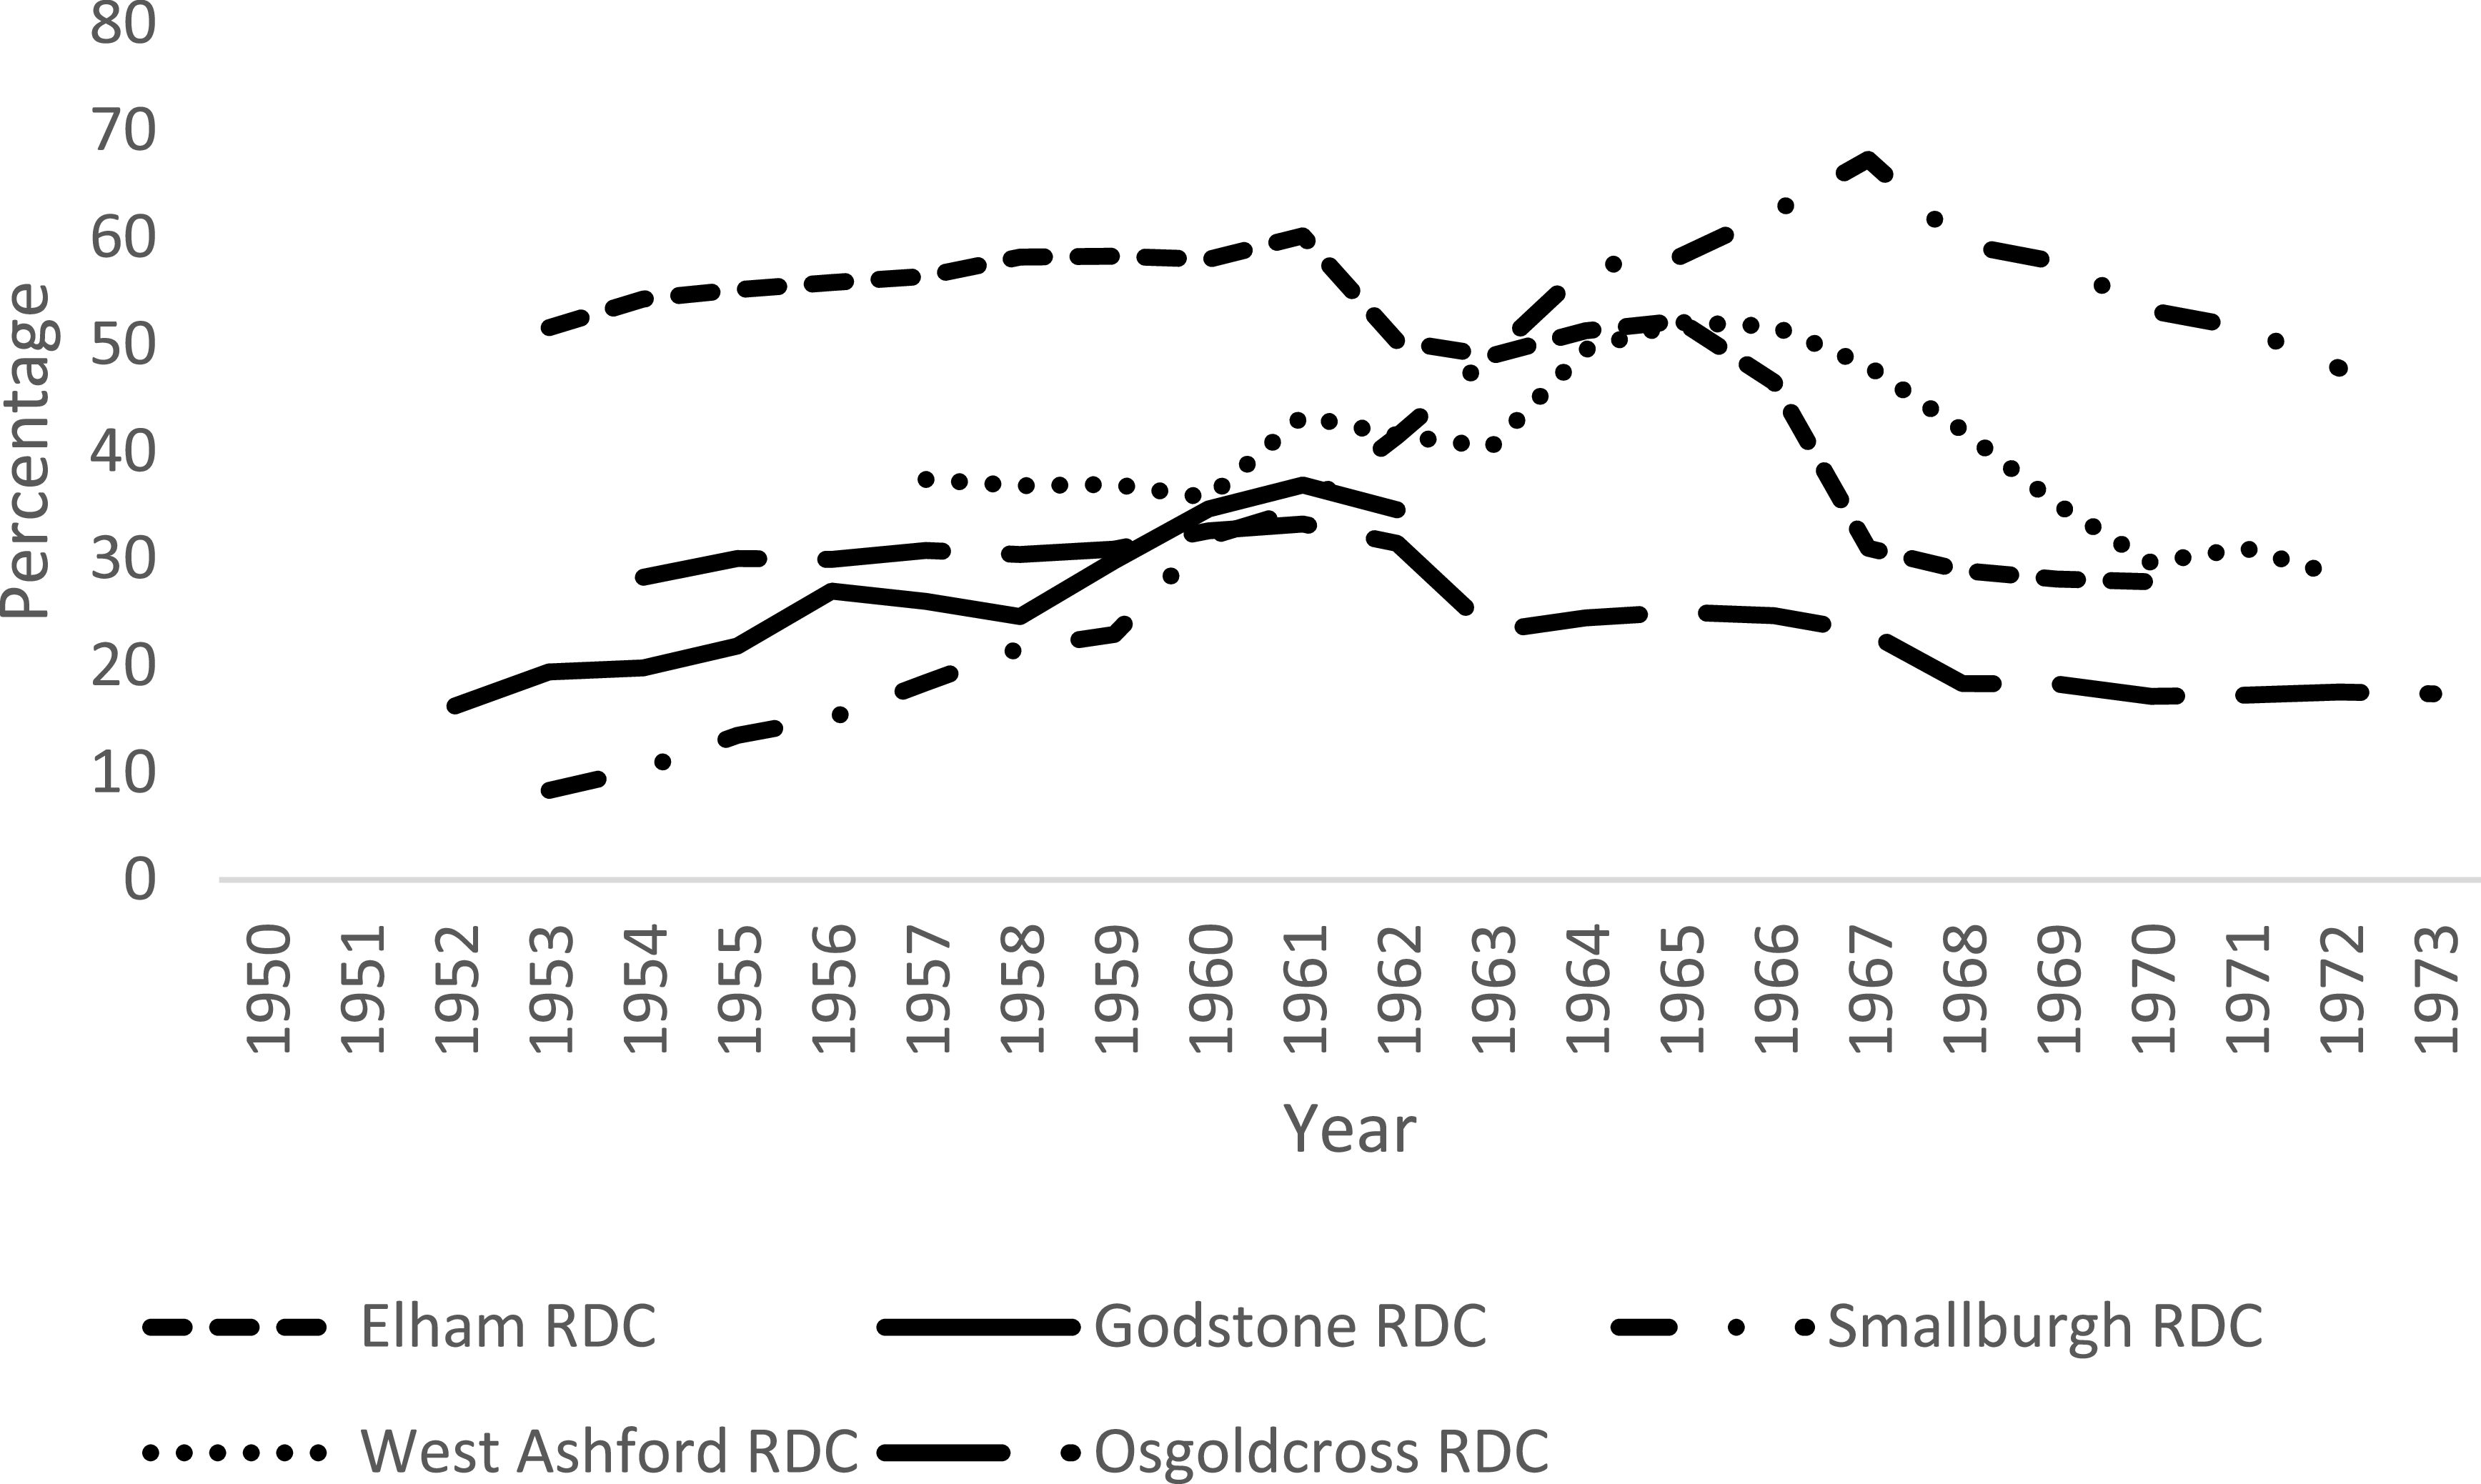
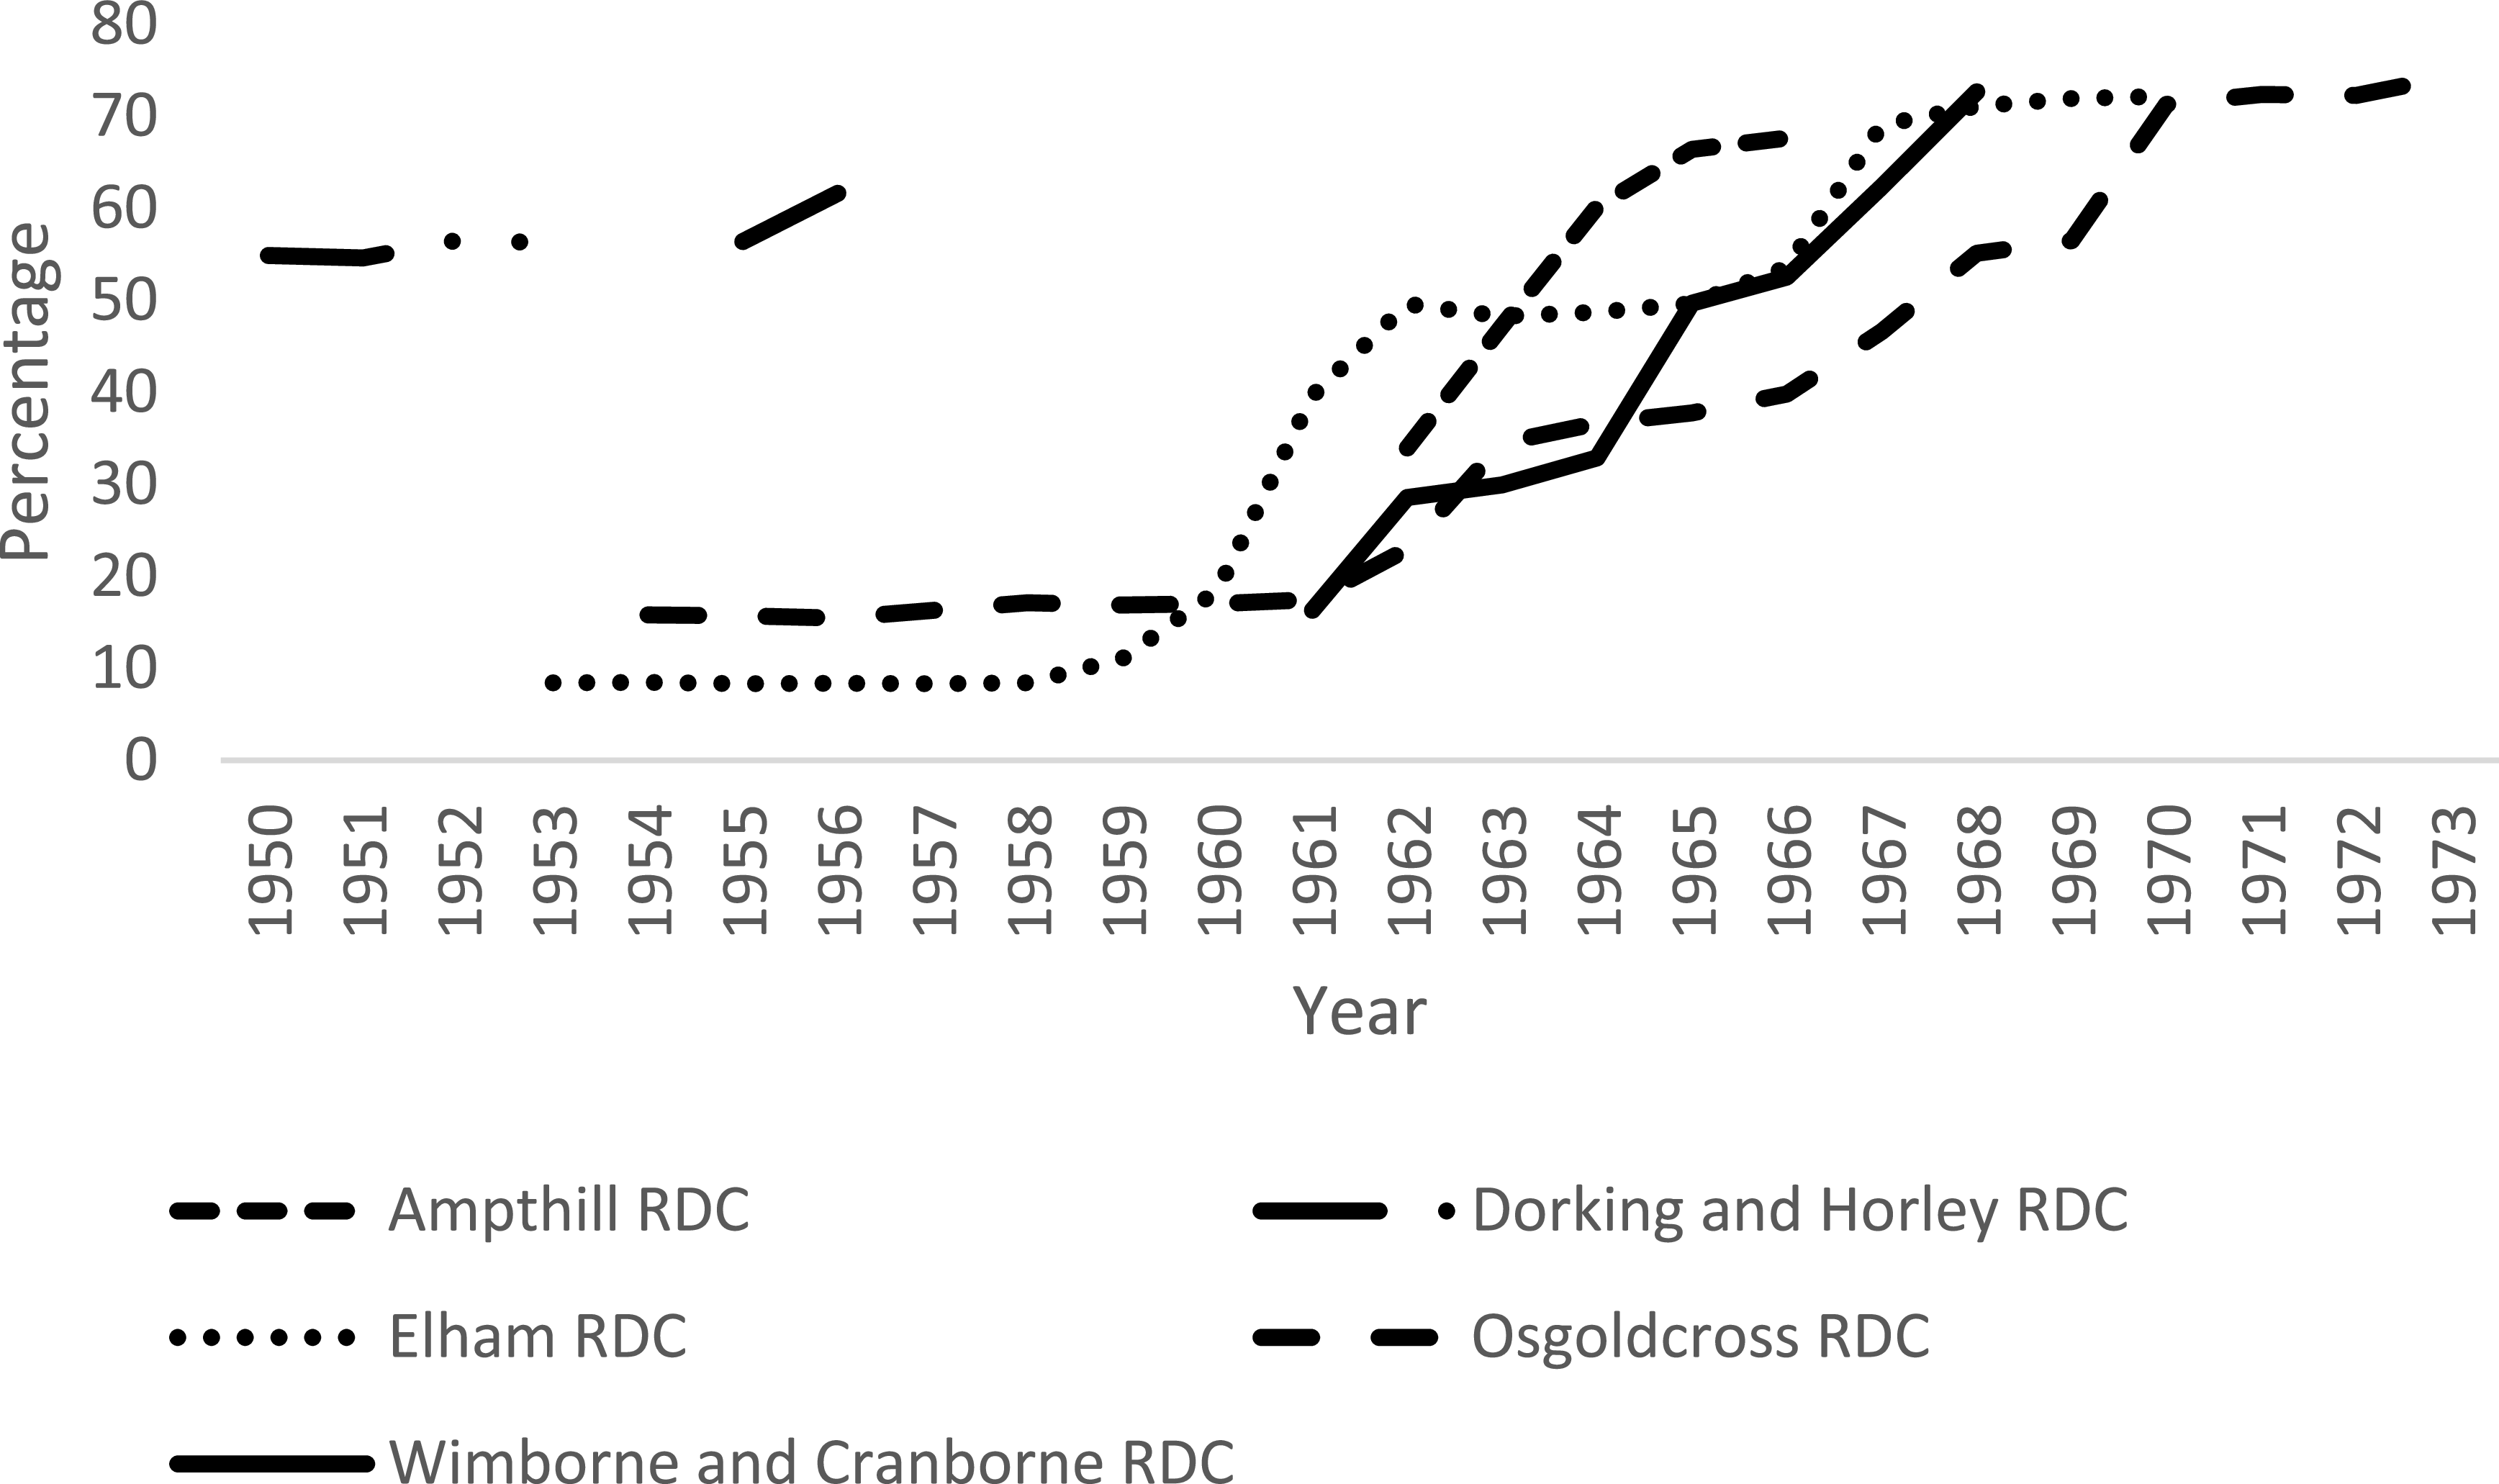
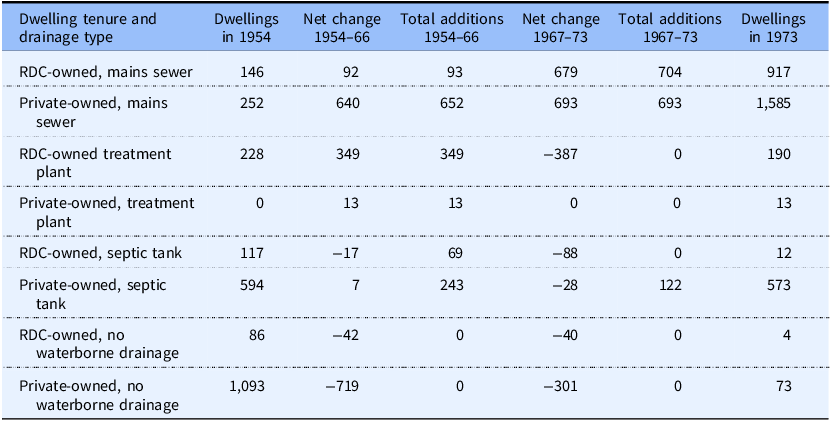
What is uncontroversial is the impact of sewer deficient homes. Few MOH reports provide annual numbers, but patterns are clear (Figure 1). The process was summarised by Godstone as ‘… regrettable that cesspools are still having to be accepted as an alternative to main drainage’.Footnote 121 Indicatively, from first data year to peak year of cesspool reliance in Figure 1, Godstone’s housing stock increased by 35.0% but cesspool numbers by 350.5% (1950–61), Smallburgh 5.4% and 100.9% (1953–67), West Ashford 10.6% and 53.9% (1957–65), and Elham 20.3% and 36.8% (1953–61). Only Osgoldcross distinguished drainage by tenure (for 1954–73). Here, 1954–66 and 1967–73 were viewed as different ‘eras’ (Figure 2). For the MOH securing investment permission over 1954–66 was almost ‘slow torture’,Footnote 122 whereas 1967–73 saw notable connection increases (Table 3). In 1954, 56.4% of Osgoldcross private homes lacked waterborne drainage and a further 30.6% used septic tanks. After 1954, private dwellings without waterborne drainage contracted significantly, but there were only 21 fewer septic tanks by 1973. This was because 365 new private tanks were added. Over the two decades, 1,345 mains connections benefited private homes, while council connections were constrained until the late 1960s (Table 3). As others record, home improvements, planning applications and private completions all increased once rural sewers arrived,Footnote 123 but volume private-build preceded sewers with national encouragement. Adverse environmental impacts followed.
Percentage of housing stock cesspool emptied in five RDCs, 1950–73.
Note: Trends reflect the longest annual runs available across the investigated RDCs. Smallburgh, Godstone, and Osgoldcross values are cesspools emptied each year; Elham, dwellings with a cesspool or septic tank; and, West Ashford, before 1966 cesspools emptied, but post-1966 only data on private dwellings cesspool register were available (shown as percentages of all privately-owned dwellings). For 1964–66 West Ashford values, figures for all dwellings were around 2% higher than for private ones only.
Source: Medical Officer of Health Annual Reports.

Percentage of housing stock with mains sewer connections in five RDCs, 1950–73.
Source: Medical Officer of Health Annual Reports.

Change in dwelling numbers by drainage type and tenure in Osgoldcross RDC, 1954–73

Table 3. Long description
A table comparing dwelling tenure and drainage type from 1954 to 1973. The table has 8 rows and 7 columns. The columns are labeled as follows: Dwelling tenure and drainage type, Dwellings in 1954, Net change 1954-66, Total additions 1954-66, Net change 1967-73, Total additions 1967-73, Dwellings in 1973. The rows are labeled with different dwelling tenures and drainage types: RDC-owned, mains sewer; Private-owned, mains sewer; RDC-owned treatment plant; Private-owned, treatment plant; RDC-owned, septic tank; Private-owned, septic tank; RDC-owned, no waterborne drainage; Private-owned, no waterborne drainage. Each row provides data on the number of dwellings in 1954, net change from 1954-66, total additions from 1954-66, net change from 1967-73, total additions from 1967-73, and the number of dwellings in 1973. Notable trends include significant increases in private-owned mains sewer dwellings and decreases in private-owned dwellings without waterborne drainage.
Note: ‘Total additions’ refer to the number added in the period. ‘Net change’ refers to ‘total additions’ minus removals from a drainage type during the period.
Source: Osgoldcross RDC Annual Reports of the Medical Officer of Health and Chief Public Health Inspector.
Environmental consequences
This paper has centred on the housing implications of sewerage supply (or its absence), but there were other significant consequences of poor drainage. One of these was the detrimental effect of water pollution on farm production, such as adverse fertility and dairy cow output.Footnote 124 Wider economic penalties also accrued. Government thinking in the 1940s was backward looking in expecting few countryside economic changes, with the Scott Report symbolically viewing the countryside as remaining agriculture dominated.Footnote 125 But as the decades moved forward, the limits of this vision grew, with a wider range of economic activities seeking rural bases. Even manufacturing, much maligned in earlier decades as out of keeping with the countryside, showed increased interest in rural locations in the 1960s.Footnote 126 These enterprises put pressures on local authorities to secure sewer (and water) systems matching contemporary requirements. Local studies reveal that sewerage and water failings were detrimental to job creation.Footnote 127
Whether for households or institutions, the most damaging drainage options were no provision or direct outflow into water courses. Few MOH reports tabulated either. Alongside Osgoldcross (Table 3), two that occasionally did were Dorking and Horley, with 8.9% of 1950 dwellings without drainage, and Ampthill, with 7.0% in 1962, plus 18.0% draining into ditches. While septic tanks needed less regular emptying than cesspools: ‘Septic tank drainage is quite useless unless the site is well drained and not in an area of development’.Footnote 128 When such conditions do not pertain, the outcome, as highlighted by the Erpingham MOH, was that: ‘… in times of bad weather the water logged condition of the ground produces what is tantamount to a bog’.Footnote 129 For nine of the 17 investigated districts, council statements indicated that soil impenetrability discouraged reliance on septic tanks. Each area had tracts of low-lying, non-porous soil, with high water tables, so making effluent drainage problematical.Footnote 130 Here, sealed cesspools were preferred, despite their problems: ‘The size of these tanks makes them liable to all kinds of pressure and resultant failures’, with costs to the owner heightened when they not uncommonly found ‘… that when emptied the tank rapidly fills with surface water’.Footnote 131 The Smallburgh MOH spoke for others when cautioning that: ‘… sewers are still urgently needed in the District. Many houses are going up without them, necessitating drainage into the subsoil. This has never been advisable, certainly not in the present century’. Councils protested that drainage and leakage from septic and cesspool tanks ‘fouled the soil’, which could become ‘sewer-sick’.Footnote 132 Then again, if the liquid was not absorbed into the soil, more ‘visible’ public nuisance was created from polluted surface outflows.Footnote 133
Waste removal from tanks created additional problems. These included sites for disposal. Waste or common land was employed, but farmland preferred, despite difficulties when land was cropped or wet, then, when the 1961 Pollution of Rivers Act required river board permission for discharges, many farmers refused further deposits.Footnote 134 Disposal involved long haulages ‘… between cesspool and the point of disposal and this not only increases the cost but also seriously cuts down the number of cesspools which can be cleansed in a day’.Footnote 135 For Osgoldcross, these detriments meant mains sewers and private tanks differed little cost-wise. Such assessments drew less on abstract cost-benefit calculations than on operational realities, for RDCs struggled to attract sufficient (or appropriately skilled) workers, with fluctuating demand requiring irregular calls on costly private contractors, while companies with long-term collection contracts were prone to quit at short notice.Footnote 136 Indicatively, Elham reported a six-week delay between requests for and collections of tank waste. Councils suggested cleansing demand was almost impossible to meet, which suggests one cause of increased soil pollution incidences.Footnote 137
While council homes were commonly serviced by small treatment plants (Table 3), this was a mixed blessing. They were accepted under sufferance. Councils knew they were unlikely to operate efficiently for long and would create nuisance.Footnote 138 Interwar plants were soon overloaded; although failings took years to address. Illustratively, by 1948, Evesham’s Badsey works had been ‘… overloaded for some years and is now grossly overloaded’ due to new housing, yet the ministry only sanctioned improvement plans in principle in 1961, with final completion delayed until 1970.Footnote 139 Overload problems were exacerbated by taking private tank waste.Footnote 140 Treasury economising on capital spending and inadequate RDC resources led to shortcomings of machinery and maintenance in treatment works, with labour deficiencies critical.Footnote 141 Plant effluent flowed via ditches and streams into rivers, raising water pollution issues.Footnote 142 The ministry was well aware of injunctions against councils on this account, with cases, like Ledbury RDC, of councillors under threat of imprisonment over river contamination.Footnote 143 Such problems were aired publicly in Parliamentary debates,Footnote 144 yet the ministry regularly refused treatment plant upgrades, infuriating the Rural District Councils’ Association.Footnote 145 By the late 1960s, river authorities were opposing small treatment plants; threatening building bans if new homes were connected to them.Footnote 146 Some councils resisted, but perspectives could change quickly, as with Droitwich, when polluted effluent was exposed in dead river fish.Footnote 147
Householders added to council difficulties. There was sympathy for elderly residents with pail closets, given their ‘… increasing difficulty, by reason of infirmity, to effect the necessary hygienic disposal …’.Footnote 148 Less charity was afforded elsewhere. Most condemning was Wimborne and Cranborne,Footnote 149 whose council saw considerable in-migration:
We are very familiar with the hackneyed aphorism, ‘The Englishman’s home is his castle’, but it nevertheless conveys a fundamental truism; any factor which assaults the integrity and security of the home is a potent assault upon the equanimity of the householder, and to be surrounded metaphorically, in varying degree, by a moat full of sewage, is such an assault.
Discomfort, health problems, environmental damage and cost implications were all troubling:
An unsuspecting but proud householder, during his [sic] first winter, or wet summer, of occupation, finds that his cesspit continually overflows … The owner can be obliged to have his cesspit emptied whenever it creates a nuisance, but this can easily result in an average weekly charge of one pound, a grievous, unforeseen addition to the weekly budget … The next inevitable development is that your Council has been obliged to insist upon sealed cesspits in some areas, and newcomers do not sufficiently realise that with such an installation, emptying a cistern involves them in a certain prospective charge of one penny, and emptying an average bath, eight pence. Let it be breathed, in high secrecy, that in these circumstances some otherwise law abiding and worthy citizens arrange for a small hole to appear in their sealed tanks …
Such criticisms merit exploring against a backcloth of friction over newcomers in the countryside. Commentaries often associate NIMBY attitudes with new residents, although judgements could benefit from more subtle contextualisation.Footnote 150 But, with some exceptions,Footnote 151 less attention has been devoted to the ‘unexpected’ discomforts newcomers faced when confronted with post-migration realities. ‘Lenient treatment’ for private building eased rural access for households unfamiliar with the constraints and costs of rural living, whose ‘dream country homes’, perhaps acquired on stretched budgets,Footnote 152 could prove more expensive than expected. For councillors and officials, perhaps incomers provided convenient targets to blame, but problems did increase on their arrival in numbers. Reports of hazardous outflows from tanks could be matched against areas of new residences. Accusations of non-serviced facilities could be backed by data, as in West Ashford, where 46.0% of ‘not automatically registered’ private cesspools were not emptied in year over 1961–72.Footnote 153 Not surprisingly, mitigation efforts were made, like Dorking and Horley offering free sewer connections (once available) if deficient cesspools were made watertight.Footnote 154 Others reduced cleansing charges, as with Wimborne and Cranborne’s cut from £1.25p a load in 1949 to £0.50p in 1968.Footnote 155 Few councils tabulated charges, but free collections increased.Footnote 156 However, affordability was critical. Lowering householder costs stretched council budgets, with late 1960s Institute of Municipal Treasurers and Accountants’ Return of Rates data showing the investigated RDCs mostly devoted 30%–50% of net rate and grant borne expenditure on sanitation. RDCs could have charged more, but weighed this against households ‘overlooking’ tank maintenance.
Conclusion
The sorry story of circumscribed rural sewerage improvement should not be divorced from city high-rise programmes. Fuelled locally by city ‘boosterism’, driven by construction company lobbying, aided by the modernisation agendas of architects and other professionals,Footnote 157 high-rise programmes placed enormous strain on city budgets and took disproportionate shares of Treasury housing and ancillary services support.Footnote 158 These imprints magnified 1950s housing cuts, which already came with inbuilt tendencies to favour cities.Footnote 159 Such resource shortfalls owed much to meagre national economic productivity gains, which limited the means available to British householders and governments. Analysts, including Treasury officials at the time, offer damning critiques of 1951–64 Conservative economic management, with stop-go policies prevailing, as the country fell economically behind other European nations.Footnote 160 Amongst other causes, the British state’s deficiencies have been attributed to short-term decision horizons, over-centralisation, poorly specified goals, weak management, and overly optimistic expectations.Footnote 161 These characteristics carry weight in understanding the sluggishness of rural sewerage investment. But they do not drill down to explain why rural areas suffered more. Here, rural sewerage revealed common strands with Sheail’s account of development policy in rural Wales,Footnote 162 wherein national agency mindsets focused on immediate bureau interests, failed to think long-term or coordinate action across agencies, and tended to treat local agents as irritants not informed contributors. Added inputs came from construction contracts prioritising large housing schemes, electoral bias towards city issues, and government encouragement for spatially segregated housing tenures. Overall shortage of resources, consequent on economic failures, added to these housing specific inputs to limit and slow rural provision of sewer systems.
These tendencies accelerated the social and cultural journey of the countryside toward ‘middle-class territory’.Footnote 163 Failure to invest in sewerage militated against achieving the ‘organised’ development land-use planning supposedly promoted. Sewerage deficiencies encouraged limited rural social build, even as sewerage deficient private building increased pollution, with concomitant impacts on agriculture, wildlife, and wider economic prospects. The state’s approach when regulating private construction was similar to that deployed for industrial concerns, for which river boards were instructed to persuade not enforce.Footnote 164 This practice chimes with today’s bias towards ‘self-regulation’ within privatised water companies, about which analysts reach many negative conclusions.Footnote 165
As for rural councils, evidence from the investigated RDCs does not sit comfortably beside studies identifying lack of rural enthusiasm over new infrastructure.Footnote 166 This is not to say all were equally enthusiastic. There were examples of fear that sewerage schemes would raise rate levels,Footnote 167 of householders’ hesitancy over connecting to new sewers,Footnote 168 and even despair that funds would never be available for ‘proper drainage’, so country dwellers should stick with earth closets.Footnote 169 But these were minor rumblings compared to the clamour for sewer investment, expressed in some councils as a desire to see country dwellers receiving services comparable to towns.Footnote 170 Admonishments to ‘make do’ were drowned out by anger, disappointment, and even disgust over ministry delay, obfuscation, and restriction.
Data availability statement
The dataset for this paper, ‘English rural house-building 1919–74, with urban-rural comparative data 1945–74’, is openly available from the King’s College London research data repository, KORDS, at https://doi.org/10.18742/28165628.
Competing interests
The author has no conflicts of interest.
Funding statement
Research costs for travel and accommodation to investigate seven rural districts and files at The National Archives were covered by the British Academy. Other elements of the investigation were self-funded.

 Open access

