Introduction and Background
During the austral summer of 1991–92, the area around UpB camp (82.5° S, 128.7° W) was the site of a concerted scientific effort to understand better the dynamics of Ice Stream B. The UpB camp is at a location on Ice Stream B2 (Fig. 1), where the velocity is about 440 m year−1.
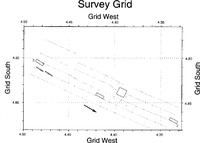
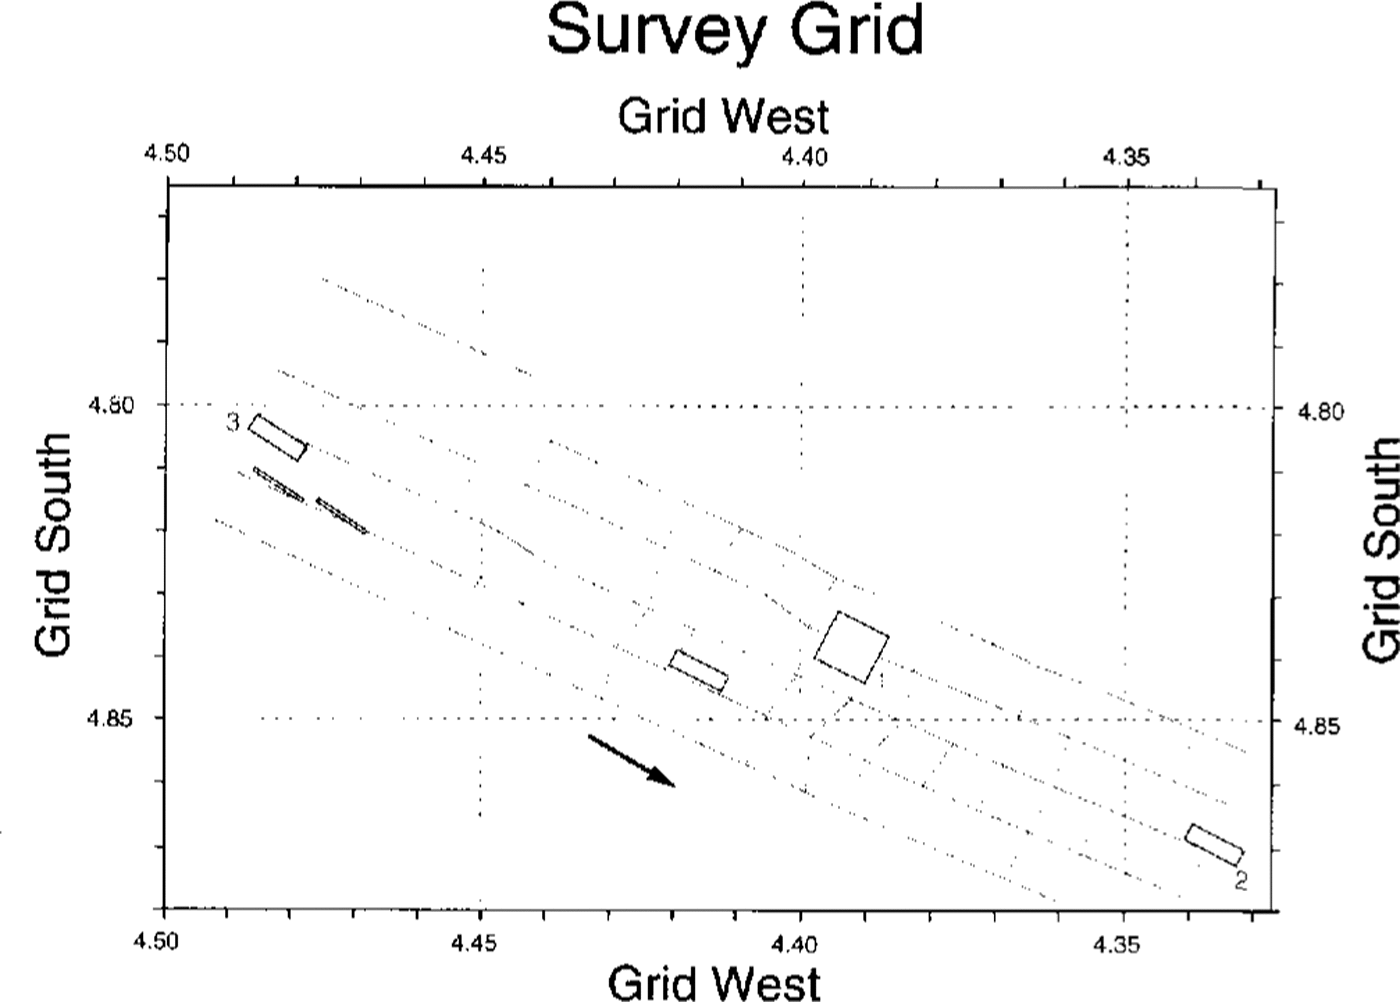
The general area of the experiments was delineated by the strain grid installed and expanded by researchers from The Ohio State University (for a map of the strain grid, see Reference Clarke and BcntlcyClarke and Bentley (1994)). The grid covers approximately 135 km2, mostly upstream of the camp. One aspect of the investigations centered around radar sounding to determine ice thicknesses, subglacial topography and basal-reflection coefficients. Safety considerations limited our radar profiling to the 60% of the strain grid that was most distant from the shear margin, where crevasses were deeply enough buried (Reference Clarke and BcntlcyClarke and Bentley, 1994) not to threaten tracked vehicles. Within that region, profiling was performed along almost all the lines of the strain grid, which are spaced at approximately 1 km intervals (Fig. 2). Shown for reference in Figure 2 and succeeding maps are the locations of several highdensity radar sounding grids (gray or open boxes) that have been discussed by Reference Novick, Bentley and LordNovick and others (1992). UpB camp is immediately grid northcast of high-density grid 2.
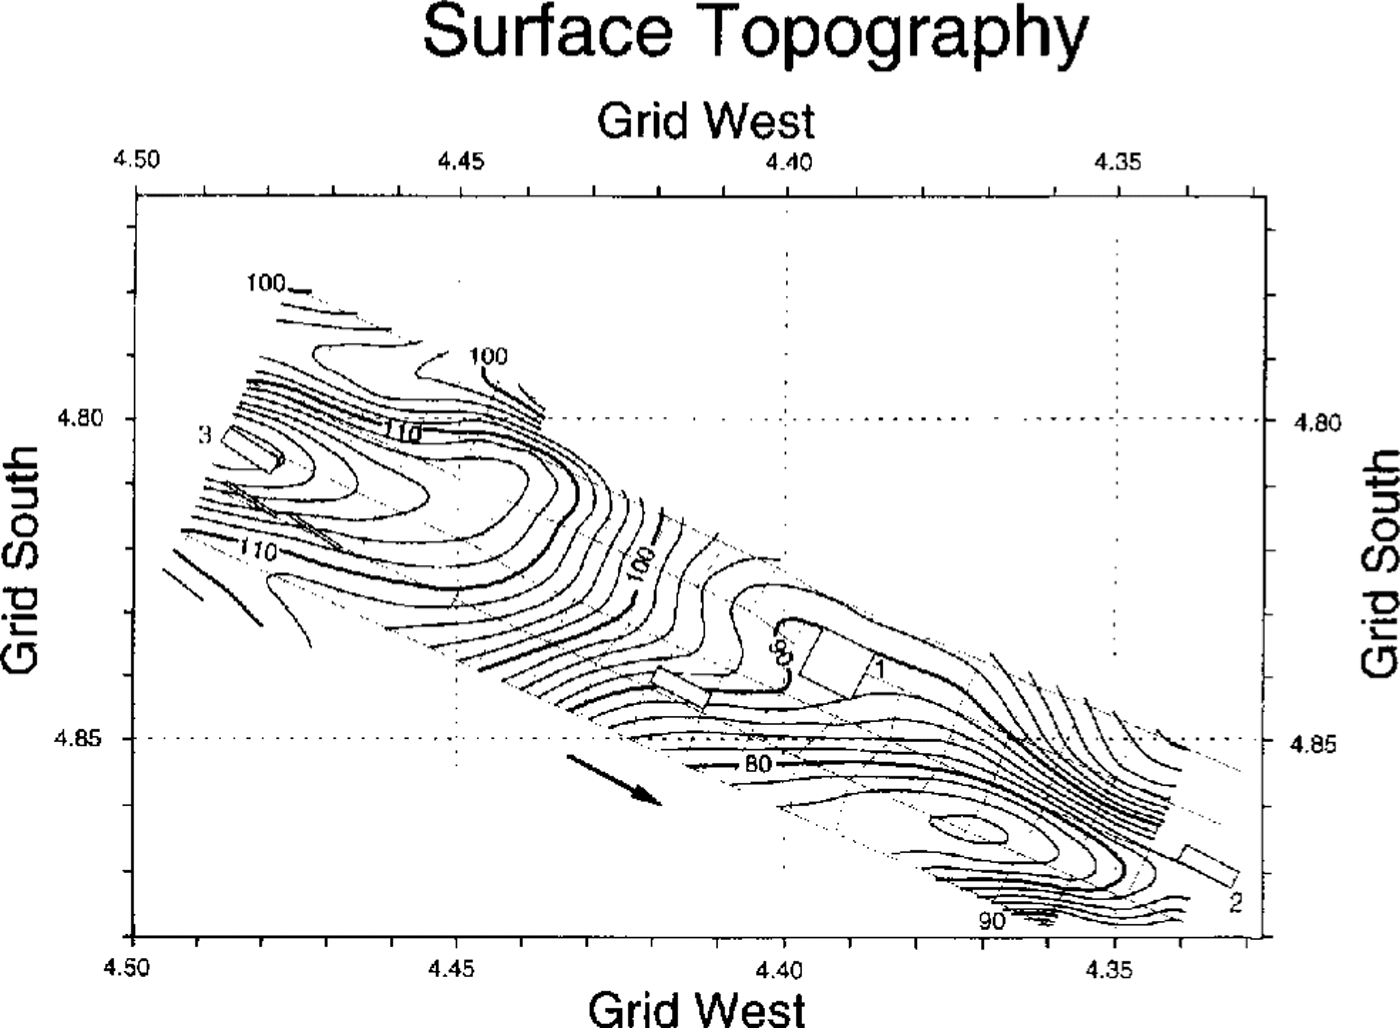
C. Hulbe (personal communication, 1993) provided the locations and relative altitudes of the survey poles from which we constructed a map of the relative surface topography (Fig. 3). Absolute surface heights in this area are now known to be about 293 m higher than the relative heights (Reference Hulbe and WhillansHulbe and Whillans, 1994).
Equipment and Technique
We used our modified SPRI 50 Mz digital radar system (Retzlaff and others, in press) to collect the data. The radar antennas were towed behind a wannigan (the “Hilton”), which housed the radar-control and data acquisition units. The antennas were a pair of folded dipoles mounted on a sled specifically designed to track in the grooves left by the “Hilton”. The entire rig, including a 5 kW generator to provide power, was towed by a Tucker Sno-Cat.
Map of West Antarctic ice streams emptying into the Ross Ice Shelf. Note the location of Upstream B camp (UpB) on Ice Stream B2. The open rectangle shows the location of the survey in this paper. In our rectangular grid system, grid north is parallel to the Greenwich meridian.

Map of our survey lines. Gray boxes here and in succeeding figures denote grids with high-density radarsounding coverage, shown here as reference points. Their long dimension is exactly 1km, which provides a scale. The arrows shows the direction of ice movement. Grid north is toward the top of all maps.
Individual radar returns were stacked to increase the signal-to-noise ratio. We stacked 128 samples per record for all of the data collected. As the antennas were in constant motion during data acquisition, each record represents an average over a distance of approximately 0.4 m. Each individual return was sampled by the digitizer at 40 ns intervals for a period of 20 µs.
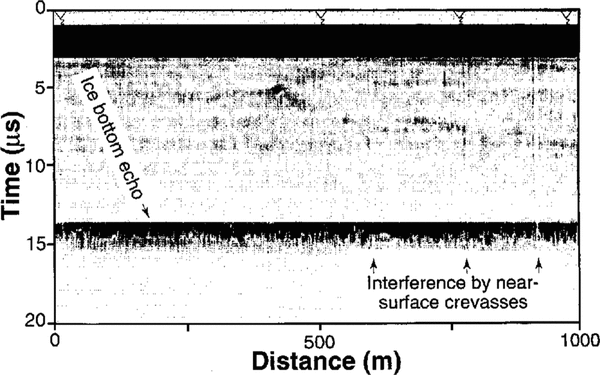
A trigger controlled by a trailing bicycle wheel signaled the unit to begin acquisition of a record at intervals of approximately 0.7 m, varying slightly according to snow conditions and whether the route had been traveled previously, An event button, activated by the driver, marked the positions of the poles of The Ohio State University strain grid on the radar record to provide ground control. Figure 4 shows a sample sounding record.
Relative surface topography in the surveyed area, in meters above a datum of about 293 m above sea level. The contour interval is 2 m.
Sample radar echogram from the longitudinal line through high-density grid 1. Triangles at the top are event markers. Interference by crevasses can be seen by short segments of weak basal echoes and by faint vertical striping between the surface and the bed above the arrows.

Processing the data
The 40 ns sampling interval of the digitizer represents 3.5m of ice thickness. To find an echo time with a higher resolution than 40 ns, we fitted a straight line to the maximum slope of the signal and used the zero intercept as the beginning of the echo (see Retzlaff and others, in press). We estimate the error in the echo time as about half a sampling interval, equivalent to ~2m.
In converting echo times to ice-sheet thicknesses, allowance must be made for faster wave propagation through the firn than through the solid ice. We used a mean electromagnetic wave speed through the ice stream of 171 m µs−1 based on a speed in solid ice of 169m µs−1 (for more details, see Reference Retzlaff, Lord and BentleyRetzlaff and others (1993)). The combined errors in velocity and digitization lead to an uncertainty in ice thickness of about 1%.
For the bottom-reflection strength, we use the equation

where all the quantities are expressed logarithmically (e.g. in dB) and Pr is the received power, Ptx is the transmitted power, Pr is the gain before the system-calibration insertion point, Ptvg is the gain after the system-calibration insertion point, Rg is the geometrical spreading loss, Rt is the loss due to dielectric absorption in the ice column, Ta is the transmission loss at the ice−air boundary, Sv is the loss due to volume-scattering in ice, Sb is the scattering loss due to a rough ice−rock interface and Rb is the power-reflection coefficient at the ice-rock interface (Reference Shabtaie, Whillans and BentleyShabtaie and others, 1987).
The characteristics of the bed, which we would like to examine, are carried by Sb and Rb Another important unknown on an ice stream, however, is Sv , which arises primarily from scattering by buried crevasses. The other quantities in Equation (1) can be accounted for rather easily. Ptx , Prx and Ta can be taken as constant over the surveyed area. Ptvg is given by the calibration data. The geometrical spreading loss Rg (including, by convention, the antenna gain) is given by

where H is the ice thickness, n is the refractive index, λ is the wavelength in air and G is the antenna gain (Reference Shabtaie, Whillans and BentleyShabtaie and others, 1987). The only variable is the ice thickness which is known. The dielectric loss, Rt , is temperaturedependent. Using an average ice-column temperature of −17°C (Reference Shabtaie and BentleyShabtaie and Bentley, 1994) and dielectric-loss measurements on Antarctic ice by Reference Fitzgerald and ParenFitzgerald and Paren (1975), we obtain an absorption loss of about 20dB km−1. There is a large uncertainty in this number (possibly 50%); however, unless the temperature profile varies significantly over the survey area, which is unlikely, the lateral variations in Rt will be small.
Signal scattering by near-surface diffractors, specifically buried crevasses, has a pronounced effect particularly on the magnitude but also on the travel time of the bottom echo. However, the influence of a crevasse or other near-surface diffractor is confined to only a small distance along any particular line. By combining data over a large enough distance (we used 50 m) and then representing that data set by its median rather than by its mean, i.e. employing a “median filter”, the effect of outliers in the data caused by the buried crevasses can be greatly reduced. This reduction was sufficient to eliminate the problem for ice thickness but not for reflection strength, as our results below show.
Error estimates were derived from an analysis of median-filtered differences at the cross-overs between longitudinal (parallel-to-flow) and transverse (normal-to-flow) tracks. For ice thickness, there is a mean difference (longitudinal minus transverse) of 2.9 m with a standard deviation of 1.8 m over 46 intersections. Our adjustment consisted simply of a constant correction equal to half the mean cross-over difference applied, with opposite signs, along the longitudinal tracks and transverse tracks, respectively. The longitudinal-minus-transverse difference for bottom-reflection strength was applied in the same way as for the ice thickness.
For mapping purposes, the area was divided into blocks 50 m on a side. Blocks containing data points (about 4% of the blocks) were again median-filtered to produce one data point for each block. To create an evenly spaced grid of 50 m square blocks throughout the rest of the area, we applied a modified minimumcurvature gridding algorithm (Reference Smith and WesselSmith and Wessel, 1990). The modification is the addition of a “tension”parameter T that weakens the minimum-curvature constraint while still fitting the data exactly. T can be thought of as representing the flexural rigidity of an elastic plate. The algorithm yields a suite of solutions, for values of T from 0 to 1, that fit the data exactly; the larger T the more the curvature for the grid is close to the data points. For the case T = 0, the solution is a minimum-curvature plot. It represents a plate of large flexural rigidity; the curvature of the sheet around the data points is a minimum. For T = 1 (no flexural rigidity), the result is a sheet with maxima or minima only at the data points. A complete explanation of the algorithm may be found in Reference Smith and WesselSmith and Wessel (1990). No “tension” was needed in gridding the surface elevations (Fig. 3), because of their smooth variations (changing the “tension” would have very little effect). The “tension” for gridding the ice-thickness and reflection strengths was varied to minimize unrealistic features in Figures 5 and 8. T = 0.25 seemed to work best and was adopted.
Ice thickness (m) in the surveyed area. The contour interval is 5m.

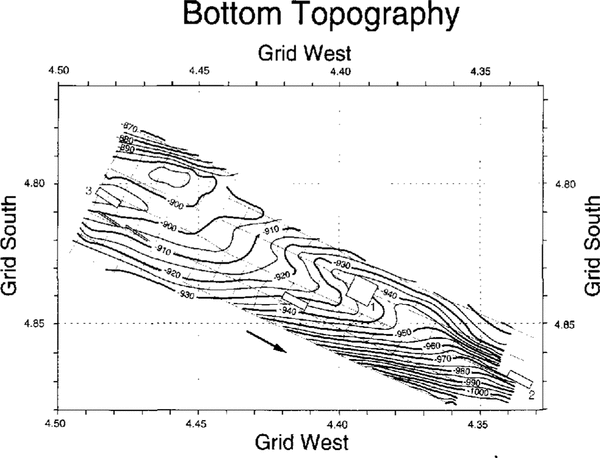
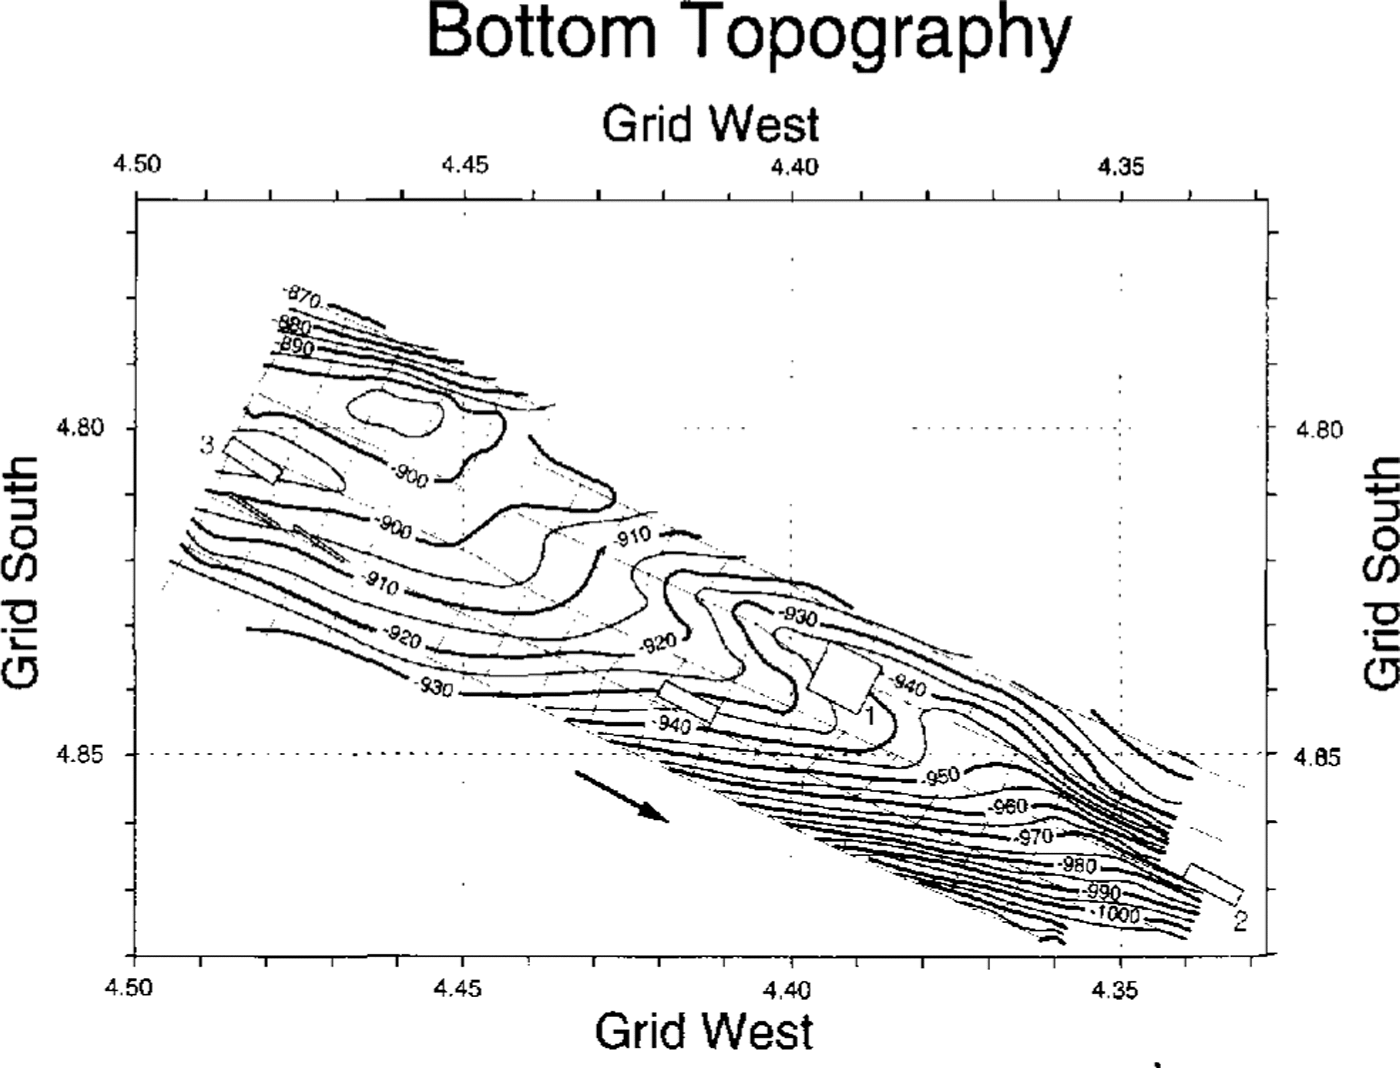
Contour maps of ice thickness (Fig. 5) and subglacial topography (surface height minus ice thickness) (Fig. 6) were produced from the gridded date using the “GMT−SYSTEM” software (Reference Wessel and SmithWessel and Smith, 1991). We used contour intervals of 5 m, more than twice the standard deviation of the cross-over differences. Fairly smooth contour lines result, although some clearly unrealistic scallops and other distortions remain where there are imperfect cross-over matches or where a particular contour line follows a sounding track.
A map of the relative water-equivalent hydrologic head, hp , was created from the surface and bed topographies using the equation (derived from Reference PatersonPaterson, 1981, chapter 8, equation 6), where h and hb are the surface and bed heights, respectively (Fig. 7).

Bottom topography beneath the surveyed area, in meters relative to a datum of about 293 m above sea level. The contour interval is 5m.
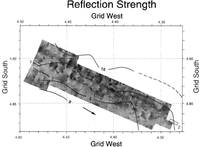
The map of reflection strength (Fig. 8) was produced in the same way as Figures 5 and 6 but is presented here in variable-density-gray form, rather than as a contour map, to bring out some features not readily seen on a contour map.
Discussion
The glacial bed (Fig. 6) slopes generally down to the grid south, with a total relief in the area sampled of 330 m. The bed deepens toward the center of the ice stream; there is also a substantial downstream component to the slope. Between fairly steep slopes (about 2°) in the grid northwestern and grid southeastern corners, the bed flattens into a broad, nearly level or gently sloping  step that extends across the upstream half of the grid. Over this step, the ice thickness is nearly constant (Fig. 5), so the ice-surface topography (Fig. 3) largely reflects the shape of the bed. The surface over the steeper bed in the corners of the grid, however, slopes oppositely to the bed, i.e. down to the grid north in both the grid northwestern and southeastern corners; the longitudinal surface valleys near the corners do not reflect the bed. Neither do they reflect the direction of ice flow, which is rather uniformly along the axis of the ice stream (Reference Hulbe and WhillansHulbe and Whillans, 1994; Reference Whillans, Jackson and TsengWhillans and others, 1993), rather than in the direction of the driving stress, which is essentially down the surface slope. Clearly, there is no simple relation between the surface and basal topographies. An extended discussion of surface topography and strain measurements has been given by Reference Hulbe and WhillansHulbe and Whillans (1994).
Relative hydrologic head calculated from surface topography and ice thickness, in meters above an arbitrary datum. The contour interval is 5m.

Variable-density map of the strength of the basal reflection beneath the survey area. The outline shapes are the gray boxes from previous maps. The gray scale covers a range of about 24 dB; lighter shades denote stronger reflections. The contour lines show the crevasse density, defined as the number of crevasses crossed per kilometer of travel perpendicular to the crevasses. Crevasse-density data were provided by T. S. Clarke (Personal communication, 1993); also, see Reference Clarke and BcntlcyClarke and Bentley (1994).

There is also a valley about 5 m deep in the bed beneath high-density grid #1 along the grid northeastern edge of the survey. Grid # 1 is centered over the spot on the bed where Reference Rooney, Blankenship, Alley and BentleyRooney and others (1987) found a minimum thickness of the subglacial deformable till less than 2 m versus a general average of about 6 m. The association of the 5 m deep valley with a till thinning of about 5 m suggests that the thinning may be due to erosion by thicker ice rather than to the occurrence of a ridge in the substrate.
The hydrological head map (Fig. 7) is dominated by the surface topography, as expected from Equation (2). Even the steep bed slopes in the corners of the survey area cannot overcome the effect of the oppositely directed surface slopes. Consequently, troughs in the head, into which subglacial water will tend to flow, are found near both corners. The trough in the grid southeast corner is particularly notable in that it is elosed downstream; water might tend to pool here, particularly if additional contours close downstream of our survey area. This could affect the hydrologic conditions in high-density grid #2, on the flank of the trough (Fig. 7), where the bed was sampled by holes drilled through the ice (Reference Engelhardt, Humphrey, Kamb and FahnestockEngelhardt and others, 1990). Conversely, water should be driven away from the ridge in head that is centered on high-density grid #3; if poor lubrication can cause a “sticky spot” (Reference AlleyAlley, 1993), this is a likely place for one.
The residual echo strengths (Fig. 8) reflect two principal influences scattering losses in the ice and reflection losses at the bed. Despite the median filtering, the overall pattern is apparently dominated by scattering from buried crevasses, which become increasingly abundant grid northeastward toward the shear margin of the ice stream (Fig. 8; Reference Clarke and BcntlcyClarke and Bentley, 1994), in the same direction that the reflections become weaker, as indicated by overall darkening in Figure 8. On the other hand, there is no apparent correlation between the echo strength and the hydrologic head (Fig. 7). If water is indeed distributed according to Figure 7, the distribution does not have a noticeable effect on the reflectivity, perhaps because the bed is everywhere saturated.
Although Figure 8 primarily shows the effects of crevasses, there are also real variations in reflecrivity. This is shown particularly by the relatively weak echoes in the grid southwestern most part of the survey (around grid 4.83° S, 4.48° W), because in this small region there are no crevasses at all (Fig. 8; Reference Clarke and BcntlcyClarke and Bentley, 1994). The stripes, of greater and lesser reflection strength that extend across the entire region parallel to flow are also notable. (These stripes can be seen best by looking along Figure 8 at a shallow viewing angle parallel to the flow direction.) There is no evidence in the crevasse pattern for such stripes, and the fact that they cross the longitudinal lines at a slight angle precludes their attribution to an artifact of signal processing. We believe they represent real changes in bed characteristics that are dragged along by the ice movement.
The small-scale patchiness that is apparcnt across the whole region we believe is also a real characteristic of the bed, because the amplitude of the variations often reaches 6 dB or more, whereas the standard deviation of residual echo strength at cross-overs was only 3 dB. However, the patchiness must be viewed with considerable caution, particularly where patches are associated with only one survey line, because the degree of connectedness between such patches on the map will depend on the regional “tension” that is applied.
Conclusions
There is no clear correlation between surface and bed topography on the 5–20 km scale. Driving stresses are clearly supported in some complex way. The surface slopes are large enough to dominate the hydrologic head and to lead to regions of pronounced divergence and convergence in the expected subglacial water flowlines. This could lead to sticky spots and local ponding of water beneath the ice. However, differences in echo strength do not correlate with the likely distribution of subglacial water, perhaps because the bed is saturated even where the water diverges. Nevertheless, there are pronounced variations in basal reflectivity, some apparently associated with ice-flow action on the bed and some irregular. We do not know the cause of the reflectivity differences.
Acknowledgements
We wish to thank T. S. Clarke and C. Liu for help in data collection and C. Hulbe, of The Ohio State University, for the information on surface topography and strain-grid pole locations. This work was supported by U.S. National Science Foundation grant DPP–90–l8530. This is contribution No. 544 of the University or Wisconsin Madison Geophysical and Polar Research Center.