Introduction
The correct temporal relationship between timed artificial insemination (TAI) and ovulation is crucial for obtaining high fertility rates in different animal production industries (Leboeuf et al., Reference Leboeuf, Forgerit, Bernelas, Pougnard, Senty and Driancourt2003; Menchaca et al., Reference Menchaca, Miller, Gil, Pinczak, Laca and Rubianes2004; Roelofs et al., Reference Roelofs, Van Eerdenburg, Hazeleger, Soede and Kemp2006). This can be achieved by knowing the time from onset of oestrus to ovulation in natural oestrus and in hormone-induced oestrus.
In goats, several works for determining ovulation time after natural and induced oestrus by serial laparoscopies have been reported over the last two decades (Gonzalez-Stagnaro et al., 1984; Baril and Vallet, Reference Baril and Vallet1990; Leboeuf et al., 1996). However, the serial laparoscopic ovarian examination is a stressful method that is gradually becoming unacceptable (Baril et al., Reference Baril, Touzé, Pignon and Saumande2000). In order to control the laparoscopic stress effect, the number of serial laparoscopies in goats can be restricted (Leboeuf et al., 1996). There is a great deal of proof that the stress can affect reproductive parameters and consequently modify the precise time of ovulation (Dobson et al., 2000). In contrast, ultrasonography is a safe non-invasive technique for ovarian scanning in goats (Baril et al., Reference Baril, Touzé, Pignon and Saumande2000; Simões et al., Reference Simões, Almeida, Valentim, Baril, Azevedo, Fontes and Mascarenhas2006). In cattle, it was already demonstrated that repeated rectal ultrasound does not alter behavioural oestrus and peri-ovulatory hormonal profiles (Roelofs et al., Reference Roelofs, Bouwman, Dieleman, Van Eerdenburg, Kaal-Lansbergen, Soede and Kemp2004).
Ultrasonographic studies on ovulation in goats were first reported by Gonzalez-Bulnes et al. (Reference Gonzalez-Bulnes, Díaz-Delfa, Urrutia, Carrizosa and Lopez-Sebastian2004). The time of ovulation was determined by ultrasonography after oestrus synchronization in goats using oestradiol benzoate, medroxiprogesterone acetate and/or fluorogestone acetate (FGA) (Valenzuela-Jiménez et al., Reference Valenzuela-Jiménez, Hernández-Cerón, Murcia-Mejía, Rodríguez-Maltos and Gutiérrez2004; Martínez-Álvarez et al., Reference Martínez-Álvarez, Hernández-Cerón, González-Padilla, Perera-Marín and Valencia2007). However, for a more ‘clean, green and ethical’ animal production (Martin et al., Reference Martin, Milton, Davidson, Banchero Hunzicker, Lindsay and Blache2004), more in-depth studies of oestrus phenomena, either natural or induced, are necessary.
Fertility rates up to 60% were observed in goat flocks after TAI (Baril et al., Reference Baril, Leboeuf and Saumande1993; Leboeuf et al., Reference Leboeuf, Manfredi, Boue, Piacère, Brice, Baril, Broqua, Humblot and Terqui1998). However, nulliparous goats had poorer fertility after TAI than multiparous goats. Although several factors (weaning age, growth rate, body condition score, age at first TAI) have been included in genetic selection programmes of young goats (Leboeuf et al., Reference Leboeuf, Manfredi, Boue, Piacère, Brice, Baril, Broqua, Humblot and Terqui1998), the cause of that poor fertility remains unclear. Potential differences of peri-ovulatory events between nulliparous and multiparous goats after induced and natural oestrus could contribute towards its understanding. The preovulatory LH peak, the time of ovulation and their relationships were the main parameters that needed to be characterized with regard to understanding the parity effect.
To contribute to answering these questions, the aim of this study was to determine the time of ovulation, regarding the number of ovulations, using a non-invasive method after luteolytic treatment and natural oestrus in nulliparous and multiparous goats, during the breeding season. The effects of oestrus type, parity and number of ovulations on preovulatory LH peak were also tested.
Material and methods
All procedures and experiments involving animals used in the present study were approved by the Animal Welfare Division/Veterinary General Directorate of the Ministry of Agriculture of Portugal.
Animals
Fifteen nulliparous goats aged between 9 and 22 months, weighing 27.8 ± 0.9 kg, and nine non-lactating multiparous goats aged between 5 and 9 years, weighing 38.4 ± 1.8 kg, were housed in the experimental farm of University of Trás-os-Montes e Alto Douro (latitude 41°19′N; altitude 479 m). Body condition of all animals ranged from 2.5 to 4.0, on a scale of 1 to 5 adapted from Santucci et al. (Reference Santucci, Branca, Napoleone, Bouche, Aumont, Poisot and Alexandre1991). At least 4 months before the experiment, all animals were adapted to ambient and nutritional conditions. After the end of the study, all nulliparous goats were mated and kidded.
Oestrus observation and collecting blood samples
Two consecutive oestrous cycles were studied during the breeding season. Oestrus synchronization was obtained with two intramuscular injections of 50 μg cloprostenol (Estrumate®; Essex Animal Health Friesoythe, Friesoythe, Germany), administered 10 days apart, in late September, when the ovarian cyclic activity is evident in this breed (Simões et al., Reference Simões, Almeida and Mascarenhas2005a).
Two vasectomized bucks with marker harnesses were alternately used for oestrus detection. Mounting marks and oestrus signals were continuously checked from 20 to 96 h after the second prostaglandin injection and during the next two expected natural oestrus periods (i.e. 17 to 24 days and 37 to 48 days after the induced oestrus, respectively). Out of these periods and during the whole experiment, the observations for identifying marked goats were performed every 12 h for the detection of unexpected oestrus. The first mount observation was considered the onset of oestrus (moment 0).
For preovulatory LH peak detection, a blood sample (3 to 5 ml) was collected, by venipuncture from alternate jugular veins to heparinized vacuum glass tubes, at 0, 4, 8, 12, 16, 20 and 24 h after the onset of oestrus. Samples were centrifuged and plasma was stored at −60°C until LH assay.
During all the study and in order to confirm the ovarian cyclic activity, jugular blood samples were also collected twice weekly, centrifuged and plasma stored at −60°C until progesterone (P4) assay.
Ultrasonographic detection of ovulation and characterization of (pre)ovulatory follicles
The transrectal ultrasound examinations were performed every 4 h from 20 h to 44 h and 60 h after the onset of oestrus, holding the animals in a standing position inside a cage devised according to their size. An equipment, Aloka SSD 500® (Aloka Co., Ltd, Tokyo, Japan), with a probe model UST-660-7.5 (Aloka Co., Ltd) was used. Sonograms were recorded using a digital video for retrospective image computer analysis. The UTHSCSA® (University of Texas Health Science Center at San Antonio, San Antonio, TX, USA) Image Tool 3.00 software was used for follicle count and measurement as described by Simões et al. (Reference Simões, Potes, Azevedo, Almeida, Fontes, Baril and Mascarenhas2005b). Ovulation of a preovulatory follicle was considered to occur when one follicle, greater than 4 to 5 mm in diameter and observed in the previous scanning, had disappeared (Figure 1). For each goat, time of ovulation of all preovulatory follicles was evaluated. The number of ovulations, in each goat ovary, was confirmed by ultrasonography on, at least, three different occasions between days 7 and 15 of the oestrous cycle, when corpus luteum (CL) could be identified more clearly (Simões et al., Reference Simões, Almeida, Baril, Azevedo, Fontes and Mascarenhas2007).
Images sequence of double ovulation in a goat with natural oestrus. Two preovulatory follicles (F1 and F2) were simultaneous observed in the same sonogram of left ovary, 20 h after onset of oestrus (A). The maximum diameter of F1 was 8 mm (B1) reached 4 h before the first ovulation detection (Ov1) which occurred 32 h after onset of oestrus (C). The maximum size of F2 was 5 mm (B2 and C). The second ovulation was detected 4 h later (D), with evident follicle disappearance (Ov2). Two solid corpora lutea with 14 days of lifespan (1st corpus luteum (CL) and 2nd CL), result of these ovulations, were observed (E).

Each oestrus was also classified as monovular and polyovulatory when one or more ovulations per goat occurred, respectively.
Hormone analysis
Progesterone was assayed using a direct solid-phase 125I radioimmunoassay (Count-A-Count® Progesterone; Diagnostic Products Corporation, Los Angeles, CA, USA). The sensitivity and inter-assay variation were 0.02 ng/ml and 11.5%, respectively.
We considered that there is, at least, one functional CL when plasmatic P4 concentration was ⩾1 ng/ml.
Duplicate plasmatic samples were analysed by the RIA method, with rabbit antiserum for ovine LH (anti-oLH-L3), described by Pelletier et al. (Reference Pelletier, Kann, Dolais and Rosselin1968), and validated for goats by Chemineau et al. (Reference Chemineau, Gauthier, Poirier and Saumande1982) and revalidated by INRA – PRC Laboratories (Nouzilly, Tours-France) in 1996. The minimum level of detection was 0.2 ng/ml (B/B 0 = 94.1%). The inter-assay coefficient of variation was 13.7%.
Preovulatory LH peak definition
The following terminology was used in determining the preovulatory LH peak:
(a) Maximum LH value: the highest plasmatic LH concentration (ng/ml) found in consecutive samples obtained every 4 h through 24 h following the OE;
(b) Basal LH value: the average of plasmatic LH concentration (ng/ml) quantified in all plasmatic samples, excluding the maximum LH value and the values immediately preceding and following;
(c) Time of preovulatory LH peak: the time of the maximum LH rise, if there was, at least, a fivefold amount of the basal LH value and at least 5 ng/ml, just as it was proposed for ewes by Christman et al. (Reference Christman, Bailey, Head and Wheaton2000).
Statistical analysis
The data were analysed by factorial ANOVA and Bonferroni/Dunn test for comparing means (mean ± s.e.) and test interactions. Repeated measures ANOVA test was used to compare mean LH values. Data of parity and number of ovulations (monovular v. polyovulatory oestrus) were independently tested. The time of each ovulation on polyovulatory oestrus was considered for determining the interval between onset of oestrus and total ovulations. Pearson’s correlations were used to test the relationships between preovulatory LH peak interval and time or number of ovulations. In the latter case, the arithmetic mean time of all the ovulations per polyovulatory oestrus (mean ovulations time) was also used. All of these statistical methods were performed using a Statistical Analysis Systems (SAS) computer package (Statview® 5.0, Abacus Concepts Inc., Berkeley, CA, USA; SAS, 1999).
Differences between percentages of monovular and polyovularory oestrus or accumulative percentages of total ovulations for nulliparous and multiparous goats were evaluated using the χ 2 test.
Results
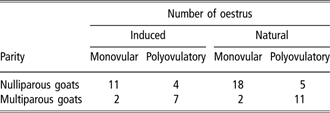
Complete data of 60 oestrus periods were obtained (Table 1) from 12 goats with two successive oestrous cycles (one induced and two following natural oestrus) and from 12 goats only with the induced oestrous cycle (one induced and one following natural oestrus). In these latter goats, the natural oestrus, the preovulatory LH peak and/or the time of ovulation were not accurately detected and, therefore, they were not considered for statistical analysis. A decrease in plasmatic P4 levels from ⩾1 to <1 ng/ml followed by a new increase (⩾1 ng/ml) over the next few days was observed in all oestrus periods.
Number of monovular and polyovulatory oestrous cycles after induced or natural oestrus of the studied goats

In nulliparous goats, 76.3% (29/38) of all oestrus periods were monovular and 23.7% (9/38) were polyovulatory (P < 0.01). In multiparous goats, only 18.2% (4/22) of oestrus were monovular and 81.8% (18/22) were polyovulatory (16 double and 2 triple ovulations) (P < 0.01).
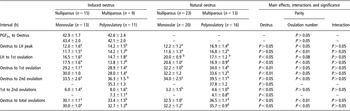
The induced onset of oestrus was observed 42.8 ± 1.7 h (n = 24) after the second prostaglandin application; no differences were detected (P > 0.05) between nulliparous (42.9 ± 1.7 h, n = 9) or multiparous (42.6 ± 2.4 h, n = 15) goats.
All significant results for parity effect (nulliparous v. multiparous goats), number of ovulations effect (monovular v. polyovulatory oestrus), preovulatory LH peak and ovulation time according to the oestrus type (induced v. natural oestrus) are summarized in Table 2.
Influence of oestrus type and parity or number of ovulations on time of preovulatory LH peak and time of ovulation in goats

Within a room data different letters (a to d) were significantly different.
Preovulatory LH peak characterization
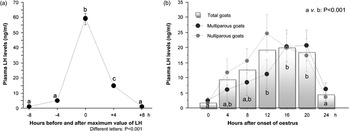
The mean value of the preovulatory LH peak was 60.1 ± 3.5 ng/ml (n = 60), ranging from 18.6 to 151.3 ng/ml, and with no significant effect of oestrus type and parity (Figure 2). The basal LH values varied between 0.1 and 4.6 ng/ml (n = 240), with a mean plasma concentration of 1.4 ± 0.2 ng/ml until 8 h before the detected LH peak and 1.5 ± 0.2 ng/ml 8 h after the LH peak (P > 0.05).
Mean values of preovulatory LH peak in Serrana goats. (a) A single high elevation of plasma LH (LH peak) and return to low (basal) levels was observed. (b) The mean LH concentration reached a maximum value 12 h after onset of oestrus. However, a tendency (P = 0.06) for an earlier high LH concentration in nulliparous (at 12 h) than in multiparous (at 16 h) goats was observed. No oestrus effect or interactions between oestrus and parity were observed (P > 0.05). Bars represent ±s.e.

The interval between onset of oestrus and preovulatory LH peak was not different for induced (12.8 ± 1.1 h, n = 24) or natural (13.9 ± 1.0 h, n = 36) oestrus periods (P > 0.05). However, this interval was lower in nulliparous (12.1 ± 0.9 h, n = 38) than in multiparous (15.6 ± 1.0 h, n = 22) goats (P < 0.05). In natural oestrus of multiparous goats, a positive correlation between the interval from onset of oestrus to LH peak and the number of ovulations was found (r = 0.76, r 2 = 0.58, residual standard deviation (r.s.d.) = 3.52, n = 13, P < 0.01).
The LH peak to first ovulation interval featured an amplitude from 8 to 26 h for induced oestrus (15.8 ± 1.2 h, n = 24) and from 10 to 30 h for natural oestrus (18.9 ± 0.7 h, n = 36, P < 0.05). A tendency for a longer LH peak to first ovulation interval in nulliparous (18.6 ± 0.9 h, n = 38) than in multiparous (16.1 ± 1.0 h, n = 22) goats was also observed (P = 0.08).
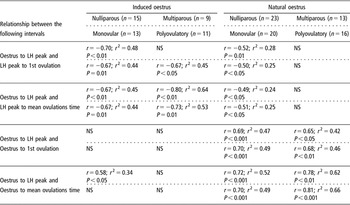
Generally, we found a negative correlation between the onset of oestrus to LH peak and the LH peak to ovulation intervals and a positive correlation between the onset of oestrus to LH peak and the onset of oestrus to first ovulation intervals with regard to parity, number of ovulations and oestrus type (Table 3). The regression coefficient between the onset of oestrus to the LH peak and the LH peak to mean time of ovulation intervals was r 2 = 0.64 (r = −0.80, r.s.d. = 3.823, n = 9, P < 0.01) for multiparous goats after induced oestrus. In natural oestrus of multiparous goats, the regression coefficient between the onset of oestrus to the LH peak and the onset of oestrus to mean time of ovulation intervals was r 2 = 0.62 (r = 0.78, r.s.d. = 3.136, n = 13, P < 0.01).
Correlation coefficients between preovulatory LH peak and time of ovulation in goats

NS = not significant.
The LH peak to second ovulation interval was not different (P > 0.05) between nulliparous and multiparous goats with both induced (18.5 ± 1.7 h, n = 4 and 22.6 ± 2.8 h, n = 7, respectively) and natural oestrus (21.2 ± 0.8 h, n = 5 and 20.9 ± 1.0 h, n = 11, respectively). The interaction between oestrus type and parity was not significant (P > 0.05).
Time of ovulation characteristics
An effect of parity (P < 0.01) and oestrus type (P < 0.05) on the interval between onset of oestrus and all ovulations was observed with low values in induced oestrus in nulliparous goats. The length of this interval was 30.1 ± 1.1 h (n = 15) in induced oestrus/nulliparous goats, 32.5 ± 1.0 h (n = 23) in natural oestrus/nulliparous goats, 33.4 ± 1.5 h (n = 9) in induced oestrus/multiparous goats and 36.5 ± 1.1 h (n = 13) in natural oestrus/multiparous goats. However, the onset of oestrus to first ovulation interval was affected only by the type of oestrus: usually, the first ovulation occurred early in induced (29.1 ± 0.8 h, n = 24) than in natural (32.8 ± 0.8 h, n = 36, P < 0.01) oestrus. This interval was not different (P > 0.05) between nulliparous and multiparous goats after induced (29.2 ± 1.1 h and 28.9 ± 1.4, respectively) or natural oestrus (32.2 ± 1.0 h and 34.0 ± 1.4, respectively).
In contrast, the interval from onset of oestrus to second ovulation was shorter (P < 0.05) in nulliparous than in multiparous goats, either in induced (33.5 ± 2.6 h, n = 4 and 36.3 ± 1.5 h, n = 7, respectively) or in natural (34.0 ± 2.5 h, n = 5 and 39.5 ± 1.1, n = 11, respectively) oestrus. Additionally, the interval between the first and second ovulation was longer in induced (7.3 ± 1.1 h, n = 11) than in natural oestrus (4.1 ± 0.8 h, n = 16, P < 0.05), in both nulliparous and multiparous goats.
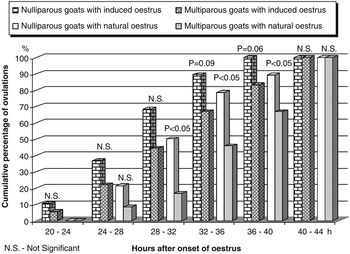
The first ovulation occurred 20 to 24 h after the onset of induced oestrus and a little later (24 to 28 h) after the onset of natural oestrus, both in nulliparous and multiparous goats (Figure 3).
Cumulative percentage of ovulations observed between 20 and 44 h after the onset of natural or induced oestrus in nulliparous and multiparous goats.

In induced oestrus, a tendency for occurrence of a higher percentage of total ovulations in nulliparous (89.5%, 17/19) than in multiparous, (66.7%, 12/18, P = 0.09) goats was first observed 36 h after the onset of oestrus. With regard to the natural oestrus, 78.6% (22/28) and 45.8% (11/24, P < 0.05) of total ovulations were observed at the same time in nulliparous and multiparous goats, respectively.
The ovulation rate was lower in nulliparous than in multiparous goats, either in induced oestrus (1.27 ± 0.12, n = 15 v. 2.00 ± 0.24, n = 9; P < 0.01) or in natural oestrus (1.22 ± 0.09, n = 23 v. 1.85 ± 0.10, n = 13: P < 0.001).
Discussion
In this study, the precise time of ovulation in nulliparous and multiparous Serrana goats has been determined, as well as the existence of an effect of parity, number of ovulations and type of oestrus type on the preovulatory LH peak and time of ovulations.
Parity and/or ovulation number significant effects on several parameters studied associated with the high percentage of monovular oestrus observed in nulliparous than in multiparous goats suggest that the number of preovulatory follicles plays a primordial role during the peri-ovulatory period.
Onset of oestrus to LH peak and LH peak to ovulation intervals
The onset of oestrus to LH peak interval observed in oestrus synchronized with prostaglandins (12.8 ± 1.1 h) was similar to that observed by Freitas et al. (Reference Freitas, Baril, Martin and Saumande1997a) in oestrus synchronized with FGA (12.0 ± 4.4 h). In both studies, no differences were found between induced and natural oestrus regarding the onset of oestrus to LH peak interval. However, other authors reported different values for this interval: 14.9 ± 1.8 h (Martínez-Álvarez et al., Reference Martínez-Álvarez, Hernández-Cerón, González-Padilla, Perera-Marín and Valencia2007), 10.0 ± 3.5 h (Greyling and Van Niekerk, Reference Greyling and Van Niekerk1990) or 6.8 ± 1.0 h (Pierson et al., Reference Pierson, baldassarre, Keefer and Downey2001), without differences between breeding periods. Freitas et al. (Reference Freitas, Baril and Saumande1997b) suggested that this interval could be influenced by the protocol of oestrus synchronization. In fact, an interval between sponge (FGA) removal and onset of oestrus of 33.4 ± 2.7 h and an interval between sponge (FGA) removal and the preovulatory LH peak of 37.0 ± 3.6 h was observed in nulliparous Serrana goats during anoestrus season (Valentim et al., Reference Valentim, Azevedo, Almeida, Correia, Mascarenhas, Fontes and Simões2006).
The shorter onset of oestrus to LH peak interval in monovular oestrus (12.2 ± 1.2 h) compared with polyovulatory oestrus (16.8 ± 1.2 h, P < 0.01) could be explained by a lower production of estradiol. The influence of the estradiol rate variation was also hypothesized in cows by Sirois and Fortune (Reference Sirois and Fortune1988) who observed a negative correlation (r = −0.90) between the preovulatory follicle size, at luteolysis time, and the interval between luteolysis and LH peak.
Otherwise, the onset of oestrus to LH peak interval is also shorter in nulliparous goats (11.6 ± 1.3 h) than in multiparous goats (16.9 ± 1.4 h, P < 0.05), perhaps due to the higher percentage of monovular oestrus in nulliparous goats. Gonzalez-Stagnaro et al. (1984) also observed a shorter onset of oestrus to LH peak interval in nulliparous (12.5 ± 3.4 h) than in multiparous (15.7 ± 5.6 h) Alpine goats, in natural oestrus. Additionally, in our study, a positive correlation between the onset of oestrus to LH peak interval and the number of ovulations, in multiparous goats with natural oestrus, was observed (r = 0.76).
The LH peak to first ovulation interval in goats with natural oestrus (18.9 ± 0.7 h) observed in our study was similar to the 20.6 ± 0.5 h found by Mori and Kano (Reference Mori and Kano1984), 20.5 ± 0.5 h by Valenzuela-Jiménez et al. (Reference Valenzuela-Jiménez, Hernández-Cerón, Murcia-Mejía, Rodríguez-Maltos and Gutiérrez2004), 20.5 ± 2.4 h by Pierson et al. (Reference Pierson, baldassarre, Keefer and Downey2001) in three different seasonal periods, and 18 to 24 h in 71% of the goats observed by Leboeuf et al. (1996) during anoestrus season. However, in our study, this interval tended to be higher (P = 0.08) in nulliparous (20.0 ± 0.9 h) than in multiparous (17.1 ± 1.2 h) goats with natural oestrus. Additionally, a higher LH peak to first ovulation interval observed in monovular than in polyovulatory natural or induced oestrus was observed.
The highest regression coefficient between time of LH peak and time of ovulation (r 2 = 0.82) was reported in goats by Leboeuf et al. (Reference Leboeuf, Manfredi, Boue, Piacère, Brice, Baril, Broqua, Humblot and Terqui1998). In our study, the regression coefficient between the onset of oestrus to LH peak and the onset of oestrus to mean total ovulation time intervals was r 2 = 0.52 for nulliparous and r 2 = 0.62 for multiparous goats with natural oestrus.
However, to compare data related to the LH peak to ovulation interval between different studies, it is necessary to consider, especially in polyovulatory oestrus, the time of ovulation that was considered: the time of the first ovulation or the time of total ovulations. Additionally, the determination of precise time of the first and the second ovulation is apparently more difficult when the laparoscopic method is used, as opposed to ultrasound scanning. One of the reasons is the limitation of the number of laparoscopic examinations.
In fact, the detection of the preovulatory LH peak can be used as a predictor of ovulation time. However, in our study, a high variability between the preovulatory LH peak and the ovulation time was observed (8 to 30 h for the first ovulation, plus the variability of the first to second ovulation interval). This variability is a handicap for using the LH peak as a prediction for the time of ovulation.
The positive correlation between the onset of oestrus to LH peak interval and the number of ovulations, and the effect of number of ovulations in the ovulation time observed in our study suggest that the number of preovulatory follicles could be an important cause of variability in ovulation time. The use of mean time of the total ovulations to calculate the interval LH peak to ovulation seems to be more significant than only the time of the first ovulation.
Time of ovulation
One of the most important results in our study, with potential influence on several reproductive parameters and practical impact in assisted reproduction, was the observation that the total ovulations take place, on average, earlier in nulliparous than in multiparous goats after induced or natural oestrus. No statistical differences of the onset of oestrus to first ovulation interval were observed between the nulliparous and multiparous goats or between monovular and polyovulatory oestrus. However, the existence of the first to second ovulation interval explained why the nulliparous goats with monovular oestrus (more than 75% of oestrus in nulliparous goats) ovulated, on average, earlier than the multiparous goats with polyovulatory oestrus (more than 80% of oestrus in multiparous goats). These suggest that the TAI should be performed earlier in nulliparous than in multiparous goats, in order to improve their fertility rate. This suggests that the number of ovulations is one of the major factors for determining the differences in ovulation time between nulliparous and multiparous goats.
The onset of oestrus to first ovulation interval was lower in induced than in natural oestrus of nulliparous and multiparous goats. This difference was also verified in monovular and polyovulatory oestrus. Additionally, the first to second ovulation interval was higher in induced (7.3 ± 1.1 h) than in natural (4.1 ± 0.8 h, P < 0.05) polyovulatory oestrus. Consequently, the prostaglandin-induced oestrus had a predominant effect to shortness first ovulation in polyovulatory oestrus but not in monovular oestrus and it widens the interval between the first and second ovulation.
The duration of ovulation is another factor to consider in polyovulatory goats. In our study, the first to second ovulation interval (8.0 ± 1.6 h) observed in multiparous goats after induced oestrus (ovulation rate of 2.00 ± 0.24) was slightly lower than that found in superovulated goats by Baril and Vallet (Reference Baril and Vallet1990) that 87.1% of ovulations occurred within less than 12 h (the ovulation rate was 12.7 ± 5.2) and by Menchaca et al. (Reference Menchaca, Pinczak and Rubianes2001). In this late case the duration of ovulation was observed between 25.8 ± 1.4 h and 35.5 ± 2.0 h after the onset of oestrus (estimated ovulation rate of 9.5 ± 1.6 of superovulated goats).
In conclusion, the present study showed that the total ovulations occurred earlier in nulliparous than in multiparous goats with natural oestrus. A similar tendency was also observed in prostaglandin-induced oestrus. These suggest that the TAI could be achieved earlier in nulliparous than in multiparous goats, in order to improve their fertility. However, the number of ovulations was an important factor pertaining to differences in the time of preovulatory LH peak and time of ovulation between nulliparous and multiparous goats. More researches in regulation mechanisms are necessary to explain the differences between the occurrence of monovular and polyovulatory oestrus in goats regarding their parity.
Acknowledgements
This work received financial support from the Fundação para a Ciência e Tecnologia – Project POCTI/CVT/45311/2002.