Introduction
Water bodies and their sediments are archives of diverse information. Lakes have been widely used for palaeoclimatic and palaeomagnetic studies around the world (e.g. Stoner et al. Reference Stoner, Channell, Hodell and Charles2003, Irurzun et al. Reference Irurzun, Gogorza, Torcida, Lirio, Nuñez, Bercoff, Chaparro and Sinito2009, Gogorza et al. Reference Gogorza, Irurzun, Sinito, Lisé-Pronovost, St-Onge, Haberzettl, Ohlendorf, Kastner and Zolitschka2012, Kokfelt & Muscheler Reference Kokfelt and Muscheler2012, Lisé-Pronovost et al. Reference Lisé-Pronovost, St-Onge, Gogorza, Jouve, Francus and Zolitschka2014 and references therein). In Antarctica, most of the studies have been carried out on ice cores, marine sediments or igneous rocks (e.g. Brachfeld et al. Reference Brachfeld, Acton, Guyodo and Banerjee2000, Steig et al. Reference Steig, Morse, Waddington, Stuiver, Grootes, Mayewski, Twickler and Whitlow2000, Willmott et al. Reference Willmott, Domack, Canals and Brachfeld2006) and only a few studies have focused on lakes and even fewer have included analyses of magnetic parameters (Björck et al. Reference Björck, Olsson, EllisEvans, Hakansson, Humlum and deLirio1996, Wagner et al. Reference Wagner, Ortlepp, Doran, Kenig, Melles and Burkemper2011, Phartiyal Reference Phartiyal2014, Warrier et al. Reference Warrier, Mahesha, Mohana, Shankar, Asthana and Ravindra2014). One of the main problems in this area is dating Holocene sediments because of the limited amount of organic matter available for a reliable radiocarbon dating. Consequently, samples must be selected that contain the largest possible percentage of organic matter. Furthermore, the reservoir effect is an unresolved problem for Antarctic lakes. In general, the reservoir effect is negligible for lacustrine systems (Kliem et al. Reference Kliem, Enters, Hahn, Ohlendorf, Lisé-Pronovost, St-Onge, Wastegård and Zolitschka2013, Warrier et al. Reference Warrier, Mahesha, Mohana, Shankar, Asthana and Ravindra2014); however, during Antarctic summer melt, old carbon from glaciers around the lakes can reach the lake basin and be measured in surface samples (Hendy & Hall Reference Hendy and Hall2006).
Relative palaeointensity (RPI) curves describe the intensity of the ancient geomagnetic field retained in lacustrine or marine sediments (Tauxe Reference Tauxe1998). Reliable RPI curves have been used as an alternative method to date sediments (Willmott et al. Reference Willmott, Domack, Canals and Brachfeld2006, Irurzun et al. Reference Irurzun, Gogorza, Torcida, Lirio, Nuñez, Bercoff, Chaparro and Sinito2009, Reference Irurzun, González Bonorino, Gogorza, Hall, del valle Abascal, Alonso and Larcher2014, Kliem et al. Reference Kliem, Enters, Hahn, Ohlendorf, Lisé-Pronovost, St-Onge, Wastegård and Zolitschka2013). The aim of this study was to obtain a high quality RPI curve and to define an age model for the sediments of Lake Esmeralda using global models to correlate the curves. By comparing these ages with radiocarbon ages, it is possible to estimate the reservoir effect for the north-western region of Vega Island.
Study site and geological setting
During the last glaciation, the Antarctic continent was shielded by a strong ice cover that reached the edge of the continental platform. The ice front began to recede c. 14 000 years ago toward the inner shelf and over land. Around 9000 years ago, the front ice had receded so far that lakes could develop on land (Lirio et al. Reference Lirio, Chaparro, Yermolin, Silva Busso and Brizuela2007).
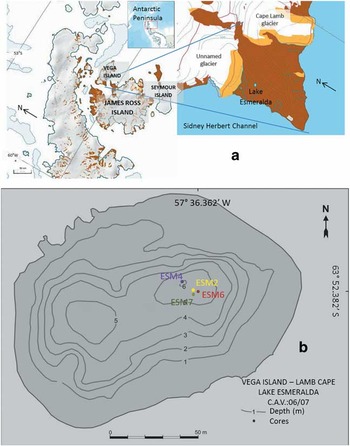
During the summer (January and February) 2007, a fieldwork campaign (Campaña Antártica de Verano 2007, CAV2006/2007) was carried out to study Cenozoic sediments on Cape Lamb, Vega Island (Fig. 1a). Cape Lamb is in the south-west of the island and is the largest ice-free area of Vega Island. The climate in this region is sub-polar and semi-arid, with average temperatures ranging from -5 to -10°C. Average summer temperatures oscillate c. 0°C. The oldest rocks found around Cape Lamb are marine mudstones and sandstones of Cretaceous age attributable to the Marambio Group. These are discordantly overlain by rocks of the James Ross Volcanic Group and by discontinuous diamictites of Hobbs Formation, both of Tertiary age (Moreno Merino et al. Reference Moreno Merino, Silva-Buso, Ermolin, Durán Valsero, López-Martínez, Martínez Navarrete and Cuchí Oterino2012). Lake Esmeralda is one of the largest lakes found on Cape Lamb. It is situated at 80 m a.s.l. in a glacial valley on top of moraine deposits. The lake has an elliptic shape (Fig. 1b) with a surface of 16 000 m2. The lake shore is sandy-silty with a gentle slope on the eastern margin. Along the western margin the lake shore is rocky and relatively steep. The lake drains intermittently by a small effluent in the north-east shore. During the summer of 2007, the lake reached its maximum water level. Field observations indicate that Lake Esmeralda was a larger water body. The bathymetry shows two depocentres (Fig. 1b) with the north-east one reaching a maximum water depth of 6.1 m and a median depth of 2.5 m. The lake perimeter is 523.6 m. Finally, the temperature and pH measured during the fieldwork in 2007 were 14.6°C and 5.45, respectively.
Location of Lake Esmeralda. b. Bathymetry of Lake Esmeralda and coring sites ESM2, ESM4, ESM6 and ESM7.

Materials and methods
Four cores (Fig. 1b) were extracted from the deepest zone of Lake Esmeralda (at a water depth of 5.8 m) during CAV2006/2007. The extraction was made from an inflatable raft with a manual drill (Russian sampler; Faegri & Iversen Reference Faegri and Iversen1989), which allows collection of semi-cylindrical cores of 7 cm in diameter and 1 m in length. The raft was fixed to the point of extraction with anchors and ropes to the shore. After the first metre was extracted, the drill was taken down again. This procedure was repeated until the basement of the lake was reached. After collection, the cores were described macroscopically and photographed in the field. The four cores (ESM2, ESM4, ESM6 and ESM7) were sub-sampled every 2.5 cm with cubic plastic boxes; a total of 357 sub-samples of 8 cm3 were obtained. Detailed sub-samples every 0.4 cm (<50 mg) were made for core ESM7, resulting in a total of 214 sub-samples (pellets). Both samples, boxes and pellets, were stored at 4°C until analysis.
The cores show predominance of clay, rhythmites composed of clay and fine sand of variable thickness (1–5 mm), anoxic zones and abundant organic matter. At the base of the sediment there is a dark deposit of coarse gravel with basaltic sharp clusters, which, based on its colour, could be a till indicating anoxic conditions. In the lower and middle zones thin horizontal laminations are found, which become inclined towards the top. Rhythmites composed of clay and fine sand are observed, most of which are 1 mm thick but a few up to 5 mm were found. In some cores a 5 cm thick layer was found with a syn-sedimentary disturbance of the rhythmites resulting in deformations and folds. There were also several centimetres of thick dark layers of microscopic algae.
Low-field volumetric magnetic susceptibility (κ) was measured with a Bartington Instruments MS2 system. Natural remanent magnetization (NRM) was demagnetized in an alternating field (AF), in incrementing peak AF steps (5, 10, 15, 20, 25, 30, 40, 50, 60, 80 and 100 mT) with a shielded demagnetizer (Molspin) and using a 2G-Enterprises long-core rock magnetometer for ESM4, ESM6 and ESM7, and a JR6A dual speed spinner magnetometer (Agico Instruments) for ESM2.
Anhysteretic remanent magnetization (ARM) with an alternating peak field of 100 mT and a steady bias field of 0.05 mT was acquired with a shielded demagnetizer (Molspin) and an ARM device. Once ARM was acquired, the samples were stepwise demagnetized in peak fields of 5, 10, 15, 20, 25 and 40, and measured using the 2G magnetometer (ESM4, ESM6 and ESM7) and the JR6A magnetometer (ESM2).
Saturation of isothermal remanent magnetization (SIRM) was acquired with a pulse magnetizer (model IM-10-30, ASC Scientific) in a field of 1.2 T. To obtain remanence coercivity (Hcr) and S-ratio (isothermal remanent magnetization, IRM, demagnetized with a reverse field of 300 mT, IRM-300mT/SIRM), a field of 1.2 T was applied to saturate the samples, and then increasing back field steps were applied until the SIRM was eliminated. The IRM measurements were made using a JR6A magnetometer (ESM2, ESM4 and ESM6) and a Molspin magnetometer (ESM7). All related ratios were calculated: MRS/MS, Hcr/HC, κARM/κ, NRM20mT/κ, NRM20mT/ARM20mT and NRM20mT/SIRM. In all cases, the subscript indicates the demagnetization step used.
Hysteresis loops at room temperature were measured for sub-samples of core ESM7 using a Princeton Measurement Micromag 2900 AGM system equipped with a 2.2 T magnet. Seven samples were also studied in a Petersen Instruments VFTB magnetic balance to produce thermomagnetic curves. An inducing field of c. 0.5 T was chosen, and ramp rates during heating and cooling were 30–40°C min-1. Argon was used for flushing the sample space.
Accelerator mass spectrometry (AMS) radiocarbon dating was conducted on three sediment samples which were selected because of their high organic matter content.
Results
Rock magnetic analysis
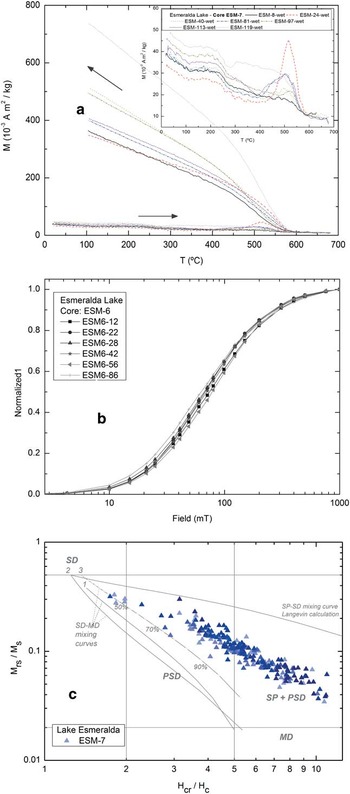
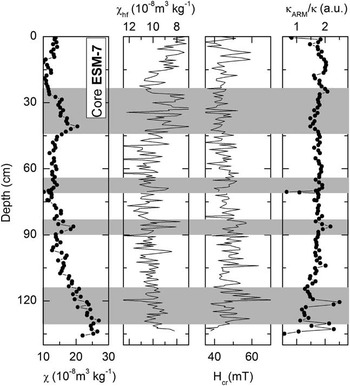
Thermomagnetic analysis revealed the dominance of magnetite (Curie temperature, Tc=580°C) and subordinated titanomagnetite and/or iron sulfur (Tc=290°C), goethite and haematite (Tc=110°C and 680°C, respectively). The heating curves of sub-samples ESM7-24, 40, 81, 97 and 113 show that magnetization increases at c. 430°C (Fig. 2a). On the other hand, the cooling curves show strong increases in magnetization after heating, due to the initial presence of mentioned high-coercivity and paramagnetic minerals and their conversion to ferrimagnetic minerals. These results are also observed from magnetic hysteresis and IRM measurements that reveal a main ferrimagnetic component of magnetite and another high-coercivity component. The latter is evident from the IRM acquisition (Fig. 2b), as well as from remanent coercivity values (Hcr=29–75 mT, Fig. 3). The S-ratio is between 0.80 and 0.85; it also supports the presence of high-coercivity minerals in low proportions and/or the contribution of magnetic particles of small grain size.
Thermomagnetic curves for selected samples from core ESM7. b. Isothermal remanent magnetization acquisition curves for selected samples from core ESM6. c. Day–Dunlop plot (Dunlop Reference Dunlop2002) for all of the samples from core ESM7. The shading indicates depth: lighter=deeper and darker=shallower.

Down core variations of rock magnetic parameters for core ESM7 from Lake Esmeralda. Grey zones indicate the samples with low proportion of paramagnetic/antiferromagnetic minerals.

The magnetic grain size parameter κARM/κ indicates the presence of fine ferrimagnetic minerals. In addition, magnetic hysteresis data shows that samples are in the region of pseudo-single-domain (PSD) to superparamagnetic-PSD magnetite particles in the Day plot (Fig. 2c). The high-field magnetic susceptibility (χhf), obtained from the high-field slope of the hysteresis loop, is frequently used as a proxy for the non-ferrimagnetic contributions, i.e. the combined effect of paramagnetic and diamagnetic particles. High values for χhf of c. 10x10-8 m3 kg-1 were found, which agree with the presence of paramagnetic/high-coercivity minerals indicated by the increase in magnetization in the cooling thermomagnetic curves.
Relative palaeointensity calculation
The NRM signal is a function of the palaeointensity of the geomagnetic field during remanence acquisition in sediments, their magnetic mineralogy, concentration and grain size. Consequently, to obtain a reliable RPI it is necessary to apply rock magnetic methods to determine these properties. As discussed above, the main magnetic carrier is magnetite with magnetic grain size restricted to 1–15 μm, and thus no significant grain size changes occur along the sediment core. To exclude samples that show significant mineralogical composition changes, nine samples of higher coercivity (HCR>70 mT) were excluded from the RPI estimations.
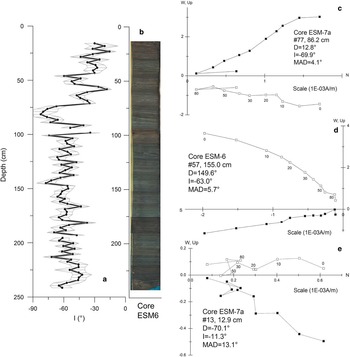
To ensure that the NRM corresponds to the intensity of ancient magnetic field of Earth, it must be determined from the stable component recovered from demagnetization experiments. During AF demagnetization, a viscous remanent magnetization was often erased after 10–15 mT steps (Fig. 4c & d). A characteristic remanent magnetization (ChRM) direction was isolated in 352 samples using principal component analysis (Kirschvink Reference Kirschvink1980) with Super-IAPD software (http://www.geodynamics.no, last accessed October 2016). At least six steps from 10 mT onwards were used for calculation of the ChRM direction. The accepted best fit directions have maximum angular deviations (MAD)<10°, indicating that the obtained inclination and declination (I and D) are reliable and stable from 20 mT onwards (Fig. 4a). Only six samples were not used because of a MAD>10° (Fig. 4e). Based on this behaviour, NRM20mT and ARM20mT after demagnetization at 20 mT were used for RPI determination. As different instruments were used for SIRM measurements, values of mass specific SIRM were used for the same purpose.
Down core variation of inclination (I). The maximum angular deviations (MAD) are shown as error bars for each sample. b. Photograph of core ESM6. c. and d. Zijderveld diagrams of two samples from different cores with MAD values<10°. e. Zijderveld diagram of a sample with MAD values>10°. In all three diagrams, solid (open) symbols are projections onto the horizontal (vertical) plane.

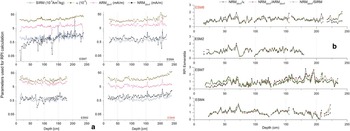
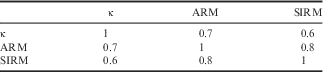
Bulk parameters used as normalizers of the NRM should be linearly related between each other to guarantee that concentration of magnetic minerals is the main cause of variations. Indeed, a linear relationship between concentration dependent parameters κ, ARM20mT and SIRM was found after core correlation (Fig. 5a) and the correlation coefficients are shown in Table I. All cases show a positive correlation coefficient indicating a linear relationship between magnetic mineral concentration parameters. The best relationship was found between ARM20mT and SIRM with a Pearson’s coefficient (r) of 0.8. Correlations between κ and the remanences have lower r values (0.7 and 0.6) probably due to the low proportion of paramagnetic minerals. It was also found that each parameter varies by less than one order of magnitude (Fig. 5a). This is considered to be an important requirement for using such normalization parameters to determine reliable RPI data, and in our study only four samples had to be excluded because of that reason. We therefore conclude that the uniformity of rock magnetic parameters meet the criteria proposed for RPI studies.
Parameters used for relative palaeointensity (RPI) calculations. b. The RPI curve for the geomagnetic field using the normalization method for the four cores from Lake Esmeralda.

Correlation coefficients of concentration parameters κ, anhysteretic remanent magnetization (ARM) and saturation of isothermal remanent magnetization (SIRM).
To remove the concentration of magnetic minerals variation from the NRM20mT signal, on each core, RPI were calculated as NRM20mT/ARM20mT, NRM20mT/κ and NRM20mT/SIRM. The average value was calculated for each ratio and then the RPI was normalized to its mean. This normalization method is commonly used to compare world wide records. The obtained curves showed very similar behaviour for the different ratios of each core and between cores; and the similar features seen in Fig. 5b indicate that magnetic mineral concentration variations present in the NRM20mT were mostly removed by the normalization.
In order to obtain from the four sediment cores one curve for each of these three ratios, data were interpolated every 1 cm and then stacked. The results are shown in Fig. 6 and are called RPI Esmeralda. As expected, the three stacked curves show similar trends in general, but the NRM20mT/κ curve deviates from the others for the deepest part and c. 208 and 155 cm. NRM20mT/SIRM shows a different trend only at the uppermost part.
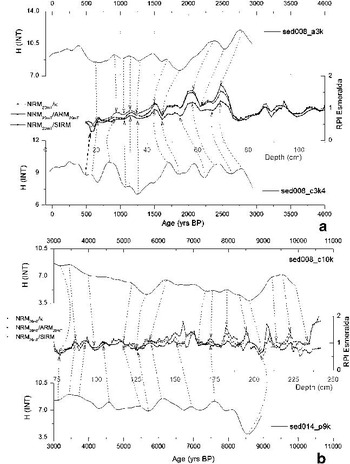
Correlation tie lines between the obtained relative palaeointensity (RPI) curves and modelled curves for intensity variations of the geomagnetic field. a. 0–3000 yr bp and b. 3000–11 000 yr bp.

Age model
Figure 6a & b show some of the correlation tie lines between the mean RPI curves for each ratio and the modelled intensity curves available in the GeoMagia50 database (Brown et al. Reference Brown, Donadini, Nilsson, Panovska, Frank, Korhonen, Schuberth, Korte and Constable2015) for south of the Southern Hemisphere. The five modelled curves (sed008_a3k, sed008_c3k4, sed008_s3k, sed008_c10k and sed014_p9k) were used to estimate the age of the sediments of Lake Esmeralda. Site locality were restricted to latitudes between 80°S and 40°S and the age range of -50–12 000 yrbp. The model sed008_a3k obtained from GeoMagia50 was constructed using archaeomagnetic data available until 2009, covering the last 3000 years and is strongly biased towards the Northern Hemisphere and, in particular, Europe. Model sed008_c3k4 was constructed using archaeomagnetic and sedimentary data until 2011, covering the last 3000 years and best estimate the variations over South-East Asia, Alaska and Siberia. Sedimentary data available until 2009 were used to obtain model sed008_s3k. These data also cover the last 3000 years and have a better global distribution. The model sed008_c10k was constructed using sediment, lava and archaeological data available until 2009, covering the last 10 000 years, and is strongly smoothed. The model sed014_p9k uses the same dataset as sed008_c10k, covering the last 9000 years, and is better suited to capture larger amplitude palaeosecular variations (PSV) because of new data treatments (particularly, the adjustment of the timescales of the sediment records using a preliminary model). Nevertheless, data from Antarctica are not available for any of these models. Distribution of archaeological and volcanic sites and sediment locations can be found at http://geomagia.gfz-potsdam.de (last access October 2016).
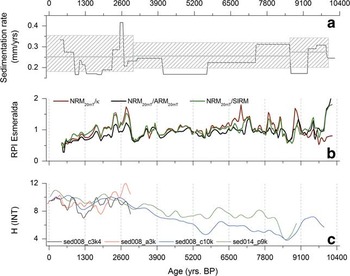
For the top 69 cm depth, the modelled curves sed008_a3k, sed008_c3k4 and sed008_s3k were used for correlations because they are more detailed than the others (for clarity and because it has the same behaviour as sed008_c3k4, sed008_s3k is not shown in Fig. 6a). As in the previous case the amplitudes of the modelled curves and RPI Esmeralda are different, but the high and low values from both can be identified. The general trend is better represented by sed008_a3k, but some high values from the RPI Esmeralda can only be found in sed008_c3k4. In all cases the correlation is consistent; i.e. the correlation lines do not intersect. The high values at 69 cm (2770 yr bp) and 57 cm (2360 yr bp) are evident in both records. Between 53 and 46 cm (2220 and 1840 yr bp), the decreasing trend is found in sed008_a3k, while the two slightly higher values are present in sed008_c3k4 and only hinted at in sed008_a3k. Between 46 and 28 cm (1840 and 920 yr bp) the oscillatory behaviour is similar to sed008_a3k and no downward trend like in sed008_c3k4 at 1270 yr bp is found. The top sample correlates with the high at 390 yr bp and the decreasing trend from 390 yr bp to the present is not found in the RPI Esmeralda record. The correlation provides an age of 2770 yr bp for the top 69 cm, suggesting an average sedimentation rate of 0.25±0.08 mm yr-1 (Fig. 7a).
Sedimentation rate estimated from the correlations with modelled curves. Grey line indicates the average value and the dashed squares the standard deviation. b. Obtained chronology for relative palaeointensity (RPI) curves from Lake Esmeralda. c. Modelled curves from GeoMagia50 (http://geomagia.gfz-potsdam.de) to show the similarities after correlation.

From 203 to 73 cm depth, the modelled curves used for comparison were sed008_c10k and sed014_p9k. It is evident that the modelled curves have different amplitudes to RPI Esmeralda, but the behaviour can be followed. RPI Esmeralda is more detailed than sed008_c10k and sed014_p9k, the modelled curves act as an envelope of the changes in the palaeointensity of the geomagnetic field found in this work. There are two lows detectable in all three curves, one at 203 cm (8600 yr bp) and the other at 126 cm (5700 yr bp). From 203 to 141 cm depth (8600 and 6300 yr bp, respectively), an increasing baseline trend similar to sed008_c10k was found. In this interval, sed014_p9k shows two high values at 172 and 150 cm (7600 and 6950 yr bp, respectively) also present in RPI Esmeralda. From 126 to 111 cm (5700 to 4750 yr bp, respectively), RPI Esmeralda has an increasing trend similar to sed008_c10k. The record obtained in this work and sed014_p9k show high values at 115 and 104 cm (5430 and 4570 yr bp, respectively). Finally, between 99 and 73 cm (4000 and 3000 yrbp, respectively) the three records show the same behaviour, with better detail in sed014_p9k. The correlation suggests an age of 8600–3000 yr bp for this interval and an average sedimentation rate of 0.24±0.05 mm yr-1 (Fig. 7a).
From 235 to 203 cm depth, sed008_c10k was used to correlate the sediments. An upward trend between 235 and 223 cm (9940 and 9550 yr bp) and a downward trend between 209 and 203 cm (8950 and 8610 yr bp) were found in both records. Another high value at 214 cm (9240 yr bp) was also identified. In general, sed008_c10k behaves as an envelope curve for RPI Esmeralda. The correlation indicates a period of 1340 years between 235 and 203 cm, suggesting an average sedimentation rate of 0.25±0.06 mm yr-1.
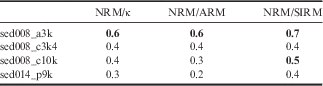
It was not possible to correlate the bottom part of the record. To provide an age for these sediments, and considering that the average sedimentation rate shows little variations along the record, a mean sedimentation rate for the complete record of 0.25 mm yr-1 was calculate and used for the depth range 242–235 cm. According to this calculation, the cores from Lake Esmeralda recorded the last 10 225 yr bp of the RPI. The obtained chronology and its comparison with the modelled curves are shown in Fig. 7b & c. Table II shows the correlation coefficients between the data from Lake Esmeralda and the modelled curves, which in all cases indicate a positive correlation. For the first 300 yr bp the best correlation is found between sed008_a3k and NRM/SIRM and for the rest of the record between sed008_c10k and NRM/SIRM.
Correlation coefficients between the modelled curves and the relative palaeointensity (RPI) for Lake Esmeralda. Bold indicates correlation coefficients>0.5.
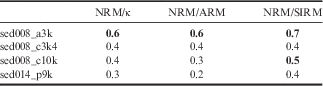
ARM=anhysteretic remanent magnetization, NRM=natural remanent magnetization, SIRM=saturation of isothermal remanent magnetization.
Selection of the best normalization ratio
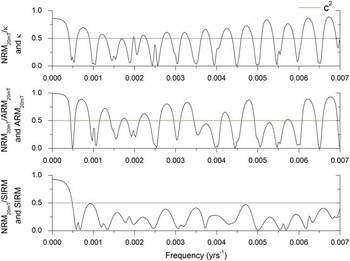
The variation with depth/age of the three normalization ratios, NRM20mT/ κ, NRM20mT/ARM20mT and NRM20mT/SIRM, is similar sensu lato. But there are minor discrepancies at different ages, suggesting that effects of climate, environment and/or lithology, which may impact on the parameters κ, ARM20mT and SIRM, were not entirely eliminated. The best normalization ratio is the one that reduces the coherence between the estimated RPI and the normalizer parameter below the 95% confidence limit in the frequency domain.
Figure 8 shows the coherence obtained for the normalization ratios. The spectral analysis was executed using OriginPro 8 (http://www.OriginLab.com) fast Fourier transform coherence estimation. This program compares the RPI ratio with its normalizer, i.e. NRM/ARM against ARM. For very low frequencies, all curves show high coherence, which is expected because this corresponds to periods similar to or larger than the entire record, and have no significance. For frequencies between 0.00039–0.007 yr-1 (corresponding to periods between 2600 and 150 years), NRM20mT/SIRM is the only parameter with no coherence above the 95% confidence limit. NRM20mT/κ and NRM20mT/ARM20mT are only locally coherent within different periods. For this reason, NRM20mT/SIRM was chosen as the most adequate RPI for Lake Esmeralda. Longer frequencies are meaningless because they correspond to the range represented by individual samples.
Spectral analysis of relative palaeointensity (RPI) ratios and the normalizer parameters. The horizontal green line c 2 is the 95% confidence limit; the data below c 2 indicate no coherence.

Estimation of reservoir effect
Table III shows the results from radiocarbon dating. Two results (at 121 and 222.5 cm) were accepted while the dating of a surface sample was rejected. This sample was a pollen/charcoal residue that was concentrated by sieving and treated with lithium metatungstate; its radiocarbon age was determined by the Center for AMS at the Lawrence Livermore National Laboratory. The obtained date was rejected as too old, probably due to the lack of carbon, which is a common problem for Antarctic sediments. The other two are bulk samples that were pre-treated, converted to CO2 and then used to determine radiocarbon age at the NSF-Arizona AMS Laboratory. These two samples were selected as they had the highest concentration of chlorophyll a (2.14 mg cm-3) found in the ESM6 core.
Radiocarbon dating for Lake Esmeralda. The calibration of the accelerator mass spectrometry (AMS) radiocarbon results was made using OxCal 4.1 calibration software (Ramsey Reference Ramsey2001, Reference Ramsey2008).

For the sample at 121 cm, the RPI dating suggests an age of c. 5350 yrbp. The radiocarbon calibrated age is 10 982±127 yr bp, c. 5500–5750 years older than the RPI age.
For the sample at 222.5 cm, the RPI dating suggests an age of c. 9530 yr bp. The radiocarbon calibrated age gives an age of 14 286±279 yr bp, again indicating an age which is c. 4470–5030 years older than expected.
Therefore, we can use these similar age differences to estimate for the first time a preliminary reservoir effect for Lake Esmeralda. Averaging the results, the reservoir effect ranges between 4985 and 5390 years, with a mean of c. 5200 years.
Discussion
Rock magnetism
The lithological analysis of the cores indicates the presence of clay and laminated sediments, making them suitable for palaeomagnetic studies. Thermomagnetic analyses indicate the dominance of magnetite and other subordinated magnetic minerals such as paramagnetic minerals, titanomagnetite and/or iron sulfur and haematite. Magnetic hysteresis and IRM results also reveal dominant low-coercivity ferrimagnetic and additionally paramagnetic/high-coercivity components. The high-field magnetic susceptibility indicates a contribution of paramagnetic/antiferromagnetic minerals to the total χ, in agreement with χhf values obtained from marine sediment around the Antarctic area (Brachfeld Reference Brachfeld2006). It can be noted that χ and χhf show a different behaviour from 50 cm to the bottom, suggesting that the paramagnetic contribution is important but not too significant to dominate the ferrimagnetic signal (Fig. 3).
The combination of κARM/κ data and the Day plot (Fig. 3) indicates PSD particles with magnetic grain sizes between 1–5 μm, but the dispersion in both plots is high. The intensity of the stable remanent magnetization isolated from the samples after 15–20 mT demagnetization steps behaves as κ, ARM and SIRM indicating the variations in the NRM20mT is dominated by the concentration of magnetic minerals.
The relationship between a magnetic concentration dependent parameter (χ) and a magnetic grain size dependent parameter (κARM/κ) exhibits a trend of increasing χ and decreasing κARM/κ (Fig. 3), i.e. higher magnetic particle concentration is accompanied by relatively coarser magnetic grain size (Chaparro et al. Reference Chaparro, Gargiulo, Irurzun, Chaparro, Lecomte, Böhnel, Córdoba, Vignoni, Manograsso Czalbowski, Lirio, Nowaczyk and Sinito2014).
Relative palaeointensity calculation
To obtain high quality RPI records, the NRM must come from stable magnetite with magnetic grain size between 1–15 μm and the magnetic concentration should not vary more than one order of magnitude. The parameters used for RPI calculation (κ, ARM and SIRM) should be linearly related to each other and the normalization should be carried out by several ratios providing consistent results (Tauxe Reference Tauxe1998). The combination of these studies meets the criteria needed for the RPI estimation.
Three RPI estimations, NRM20mT/κ, NRM20mT/ARM20mT and NRM20mT/SIRM, show an overall similar behaviour suggesting that neither magnetic grain size changes nor the presences of paramagnetic minerals significantly affect the obtained signal. The RPI only show differences at a few depth intervals. One of those intervals was found at the beginning of the record where NRM20mT/κ has lower values than NRM20mT/ARM20mT and NRM20mT/SIRM. The presence of a low proportion of paramagnetic minerals in this interval and in the three samples at c. 155 cm could be responsible for the difference in the RPI values. Another interval at the top of the cores shows high values of RPI for NRM20mT/SIRM, while NRM20mT/ARM20mT and NRM20mT/κ have the lowest values of the record. Considering that ARM is stronger for smaller magnetic grain sizes (Turner Reference Turner1997), the most plausible explanation is a higher relative amount of coarser magnetic particles, which is consistent with a trend to coarse particles indicated by rock magnetism properties.
Chronology control
The RPI record calculated for Lake Esmeralda spans the last 10 200 yr bp obtained through a good correlation with theoretical models. Björck et al. (Reference Björck, Håkansson, Olsson, Barnekow and Janssens1993), Ingolfsson et al. (Reference Ingolfsson, Hjort, Berkman, Bjorck, Colhouns, Goodwin, Hall, Hirakawa, Melles, Moller and Prentice1998) and Strother et al. (Reference Strother, Salzmann, Roberts, Hodgson, Woodward, van Nieuwenhuyze, Verleyen, Vyverman and Moreton2015), among others, indicate the onset of the deglaciation between 11 000 and 9000 yr bp for different parts of the Antarctic Peninsula. As Lake Esmeralda is near of the shoreline of Vega Island it is probable that the lake was formed at the beginning of the glacial retreat.
At the other end of the record, the sediments seem to have missed the first part of the information about the RPI of the geomagnetic field. Considering the sedimentation rate of the top, the equivalent of five sedimentary samples is not present. This could be the result of the extraction manoeuvres, and not a halt in the sedimentation process (Andrews et al. Reference Andrews, Domack, Cunningham, Leventer, Licht, Jull, DeMaster and Jennings1999).
The mean sedimentation rate is 0.25 mmyr-1 and oscillates mainly between 0.17–0.33 mmyr-1, which is in the range of values reported by Shen et al. (Reference Shen, Liu, Yi, Sun, Jiang, Beer and Bonani1998; 0.004–1.1 mm yr-1) and very similar to the rates found by Björck et al. (Reference Björck, Olsson, EllisEvans, Hakansson, Humlum and deLirio1996; 0.25–0.4 mm yr-1). Considering that when the climate is warm the catchment area of a lake is ice-free and sediments can be eroded and reach the lake, during warm periods a high sedimentation rate is expected. A relatively high sedimentation rate is present at the beginning of the record, consistent with high mass accumulation rates between 11 500 and 9070 yr bp in Palmer Deep during the early Holocene optimum (Domack Reference Domack2002). A second high in the sedimentation rate is found between 8600–7390 yr bp; in this period, warm water conditions were detected in Palmer Deep in a similar range (9000–6700 yr bp) and a maximum sedimentation rate was found in Potrok Aike, South Patagonia (Kliem et al. Reference Kliem, Enters, Hahn, Ohlendorf, Lisé-Pronovost, St-Onge, Wastegård and Zolitschka2013). Another high in the sedimentation rate starts at 880 yr bp to the top of our record (400 yr bp), it is consistent with the documented global Medieval Warm Period (MWP). According to Bentley et al. (Reference Bentley, Hodgson, Smith, Cofaigh, Domack, Larter, Roberts, Brachfeld, Leventer, Hjort, Hillenbrand and Evans2009), the MWP in the Antarctic Peninsula was only recorded in marine sediments with slight differences in timing between records. In South Georgia, Strother et al. (Reference Strother, Salzmann, Roberts, Hodgson, Woodward, van Nieuwenhuyze, Verleyen, Vyverman and Moreton2015) also found a high sedimentation rate in their palynological record. The highest sedimentation rate in the record is present at c. 2600 yr bp consistent with mild and humid conditions which reached an optimum slightly after 3000 yrbp and an extreme sediment accumulation rate just before 2500 yr bp in the South Shetland Islands (Björck et al. Reference Björck, Håkansson, Olsson, Barnekow and Janssens1993). This high is at the end of an increasing trend starting at 4000 yr bp contemporary to mid-Holocene Hypsithermal, a period of rapid sedimentation in several parts of the Antarctic Peninsula (Bentley et al. Reference Bentley, Hodgson, Smith, Cofaigh, Domack, Larter, Roberts, Brachfeld, Leventer, Hjort, Hillenbrand and Evans2009).
On the other hand, low sedimentation rates were found in three intervals at 9200–8600, 7380–4000 and 2200–1000 yr bp. The first coincides with a decrease in solar activity and the onset of a cooling period c. 9000 yr bp (Bentley et al. Reference Bentley, Hodgson, Smith, Cofaigh, Domack, Larter, Roberts, Brachfeld, Leventer, Hjort, Hillenbrand and Evans2009). The second was also reported as an interval of low sedimentation rate by Strother et al. (Reference Strother, Salzmann, Roberts, Hodgson, Woodward, van Nieuwenhuyze, Verleyen, Vyverman and Moreton2015) starting at 7700 yr bp and ending at 4400 yr bp. The third period was described as a neoglacial interval after the optimum during the Mid-Holocene Hypsithermal by Bentley et al. (Reference Bentley, Hodgson, Smith, Cofaigh, Domack, Larter, Roberts, Brachfeld, Leventer, Hjort, Hillenbrand and Evans2009). This assumption is based on several records from the Antarctic Peninsula showing a decrease in the mass accumulation rate (Domack Reference Domack2002) also found by Strother et al. (Reference Strother, Salzmann, Roberts, Hodgson, Woodward, van Nieuwenhuyze, Verleyen, Vyverman and Moreton2015), and different biological and non-biological proxies from several authors cited in Bentley et al. (Reference Bentley, Hodgson, Smith, Cofaigh, Domack, Larter, Roberts, Brachfeld, Leventer, Hjort, Hillenbrand and Evans2009) that indicate a related decline in temperatures and the beginning of a cooler climate.
Selection of the best normalization ratio and comparison with other records
The best normalization ratio is NRM20mT/SIRM and it was chosen because it has no relation with its normalizer. The assumption of Tauxe (Reference Tauxe1998) for the selection of the best ratio this way is based on the fact that the main reason for the climatic changes in NRM is the change in the concentration of magnetic minerals. By removing the concentration contribution through the ratio between NRM and κ, ARM or SIRM, only the changes in the intensity of the geomagnetic field are recorded. But even when κ, ARM and SIRM are magnetic concentration dependent parameters each of them has other contributions. For example, ARM and SIRM are remanences and hence only the ferromagnetic minerals are represented, but κ also has the contribution of diamagnetic and paramagnetic minerals as was observed in a few samples (see RPI calculation sections). On the other hand, ARM and SIRM also depend on the magnetic grain size of the ferrimagnetic minerals. By differentiating those ferrimagnetic minerals with magnetic grain sizes in the region of stable single-domain/superparamagnetic grain, ARM is more selective than SIRM (appendix 1 in Turner Reference Turner1997); i.e. ARM is more selective for small ferrimagnetic grains. Our study indicates the best RPI ratio is NRM20mT/SIRM, suggesting that the magnetic grain sizes are in the PSD region, which is consistent with the rock magnetic analysis. Similar results were found in Laguna Potrok Aike (Gogorza et al. Reference Gogorza, Irurzun, Sinito, Lisé-Pronovost, St-Onge, Haberzettl, Ohlendorf, Kastner and Zolitschka2012) and Palmer Deep (Brachfeld et al. Reference Brachfeld, Acton, Guyodo and Banerjee2000).
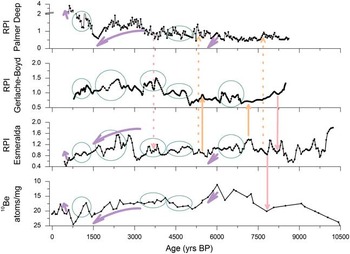
Figure 9 shows the comparison between the RPI obtained in this work with other records from Antarctica. In the case of 10Be (Steig et al. Reference Steig, Morse, Waddington, Stuiver, Grootes, Mayewski, Twickler and Whitlow2000) and RPI Palmer Deep (Brachfeld et al. Reference Brachfeld, Acton, Guyodo and Banerjee2000), the comparison is limited to general trends because of the different sampling of the data.
Relative palaeointensity (RPI) from Lake Esmeralda compared with other records from Antarctica. 10Be measurements (Steig et al. Reference Steig, Morse, Waddington, Stuiver, Grootes, Mayewski, Twickler and Whitlow2000), RPI record from Gerlache-Boyd (WBB; Willmott et al. Reference Willmott, Domack, Canals and Brachfeld2006) and RPI record from Palmer Deep (Brachfeld et al. Reference Brachfeld, Acton, Guyodo and Banerjee2000). Some of the trends, highs and lows are shown.

Palmer Deep is a bathymetric depression located 20 km south of Anvers Island, Antarctica (64°51'S, 64°12'W). The Holocene sediment consists of 47 m of olive green to dark olive green diatomaceous mud overlying a diamicton. Sediments alternate between structureless bioturbated intervals and laminated intervals (Brachfeld et al. Reference Brachfeld, Acton, Guyodo and Banerjee2000). The RPI record of Palmer Deep is presented in yr bp.
10Be was obtained from an ice core located 150 km from the western edge of Ross Sea, south Victoria Land at Taylor Dome (77°47'S, 158°43'E). The ages of this record reach 140 000 yr bp, but only the first 10 500 yr bp are used in this work. Taylor Dome is a local snow accumulation area that provides detailed records of past climate conditions (Steig et al. Reference Steig, Morse, Waddington, Stuiver, Grootes, Mayewski, Twickler and Whitlow2000).
10Be has the opposite behaviour to RPI Esmeralda (see inverse scale in y-axes in Fig. 9), which is expected because of the shielding effect of the geomagnetic field of Earth. Namely, when the geomagnetic field has low amplitude, the cosmic rays, including 10Be, can reach the surface of the Earth and vice versa. The high at 9000 yr bp and the low at 7800 yr bp can be found in RPI Esmeralda but in 10Be curve only two datapoints are available between these points. Then another high at 7200 yr bp is present in the record from this work and only insinuated in the RPI Palmer Deep. In this case, the high at 7600 yr bp is more distinguishable. The low trends between 6000–5600 and 2800–1400 yr bp can be found in the three records (magenta arrows in Fig. 9). Several periods of oscillations around the media are found in the RPI Esmeralda, Palmer Deep and 10Be records from 5000–3200 yr bp with consistent high and low values (olive ellipses). The best correlation is found in the top 1300 yr bp with the high zone c. 1140 yr bp and the increasing trend at the top of the record.
The comparison between the RPI WBB (Willmott et al. Reference Willmott, Domack, Canals and Brachfeld2006) and RPI Esmeralda is better than in the previous cases. The RPI WBB record was obtained from sediment cores of the western Bransfield basin (63°08'S, 61°30'W). The basin is occupied by a morphosedimentary bundle structure made of subparallel ridges and grooves 40 m high and 1–3 km wide that are oriented in a north–west direction. The sediments are laminated and made mostly of pelagic and hemipelagic material (Willmott et al. Reference Willmott, Domack, Canals and Brachfeld2006). The RPI record of WBB is presented in yr bp.
RPI WBB and Esmeralda were dated using the same method, but the record from WBB was obtained from a marine sediment core and the record from Esmeralda is a continental lake sediment core. Both records show the same highs and lows (olive ellipses in Fig. 9), as well as other maximums and minimums (orange and pink arrows). Unfortunately, the top increasing trend was not registered in RPI WBB. The only differences were observed in the amplitude of the signals and minor temporal shifts at some points. These slight differences may be the result of the use of different standard curves in the dating processes incurring minor errors in the date at a few points. That aside, both signs are very similar, suggesting that the changes in the RPI of the geomagnetic field have a regional scope.
Estimation of reservoir effect
The globally accepted reservoir effect for marine sediments in Antarctic Peninsula is 1230 years (Domack et al. Reference Domack, Leventer, Dunbar, Taylor, Brachfeld, Sjunneskog, Cowan, Daniels, Escutia, Evans, Eyles, Guyodo, Ioio, Iwai, Kyte, Lauer, Maldonado, Morez, Osterman, Pudsey, Schuffert, Vigar, Weinheimer, Williams, Winter and Wolf-Welling2001), ranging from 1200–1300 years but is an unresolved problem for sediment records from Antarctic lakes. Several contributory factors have been suggested for radiocarbon reservoir effects in lakes. The usual consideration is the input of old CO2 from nearby glacial meltwater from the ice front or through streams that reach the lakes. But other factors should be taken into account, for example: strong density stratification due to salinity and stability of the water column and lack/low air–water exchange due to permanent/seasonally ice cover (Hall & Henderson Reference Hall and Henderson2001, Hendy & Hall Reference Hendy and Hall2006), contamination by the marine reservoir effect through input from sea mammals and birds to lake basins, and supply of old carbon from soils (Ingolfsson et al. Reference Ingolfsson, Hjort, Berkman, Bjorck, Colhouns, Goodwin, Hall, Hirakawa, Melles, Moller and Prentice1998).
The values obtained for Antarctic lakes are wide-ranging. Ingolfsson et al. (Reference Ingolfsson, Hjort, Berkman, Bjorck, Colhouns, Goodwin, Hall, Hirakawa, Melles, Moller and Prentice1998) indicate ages for surface sediments higher than 24 000 years 14C caused by an old source of carbon which the organisms fix. This could be a plausible explanation for the uppermost dated sample in this work, which has a similar age, but because this effect was not observed in the other samples the obtained date was rejected. They also mention surface sediment ages and reservoir effects ranging from 2000–11 000 years.
The reservoir effect found in this work is 5200±300 years, higher than the one found for marine sediments but similar to others found in lakes. Hall & Henderson (Reference Hall and Henderson2001) found a 14C offset of c. 18 000 years as a result of the direct input of old CO2 from glacial meltwater and a radiocarbon reservoir age of 3600 years for Lake Vida due to the lack of aeration of the sediments or strong density stratification. Hendy & Hall (Reference Hendy and Hall2006) calculated a lake-bottom reservoir effect of c. 2700 years caused by subsurface melt of glaciers into the lake. Berkman et al. (Reference Berkman, Andrews, Björck, Colhoun, Emslie, Goodwin, Hall, Hart, Hirakawa, Igarashi, Ingolfsson, Lopez-Martinez, Lyons, Mabin, Quilty, Taviani and Yoshida1998) summarize radiocarbon reservoir corrections starting at 750 years and ending with values of c. 5000–5500 years in sediment cores along the coast.
Conclusions
Given the initial considerations concerning the difficulties of radiocarbon dating in Antarctica, strict definitions for obtaining a good chronology of sediments using different strategies in this region are much needed. A high quality RPI curve was achieved for Lake Esmeralda (Vega Island, Antarctica), this important dating tool allowed us to date 250 cm of Antarctic lake sediments. The RPI curves were calculated by three normalization methods and the results have a very good agreement; however, the NRM20mT/SIRM ratio was the best estimation for the RPI. The mean sedimentation rate is 0.25mmyr-1 (0.17–0.41mmyr-1). Positive correlations with other records provide confidence in our obtained chronology. The NRM20mT/SIRM ratio specifically correlates well with other Antarctic marine records and 10Be data. With two radiocarbon dates, it was possible to estimate a reservoir effect of 5200±300 years for western Vega Island, consistent with other reservoir effect estimations found for Antarctica and adjacent areas. Although other radiocarbon dates are needed to refine the chronological scale, the RPI Esmeralda itself constitutes an alternative and useful dating tool for Antarctic lacustrine sediment.
Acknowledgements
The authors wish to thank the Universidad Nacional del Centro de la Provincia de Buenos Aires (UNCPBA), Dirección Nacional del Antártico (DNA), Universidad Nacional Autónoma de México (UNAM), GeoForschungsZentrum (GFZ) and Consejo Nacional de Investigaciones Científicas y Técnicas (CONICET) for their financial support. This contribution was supported by the Agencia Nacional de Promoción Científica y Tecnológica (ANPCYT) project PICTO-2010-0096 and by the Bilateral CONICET/Consejo Nacional de Ciencia y Tecnología (CONACYT) Project No. 207149 (H.N. Böhnel) and Res. 1001/14-5131/15 (M.A.E. Chaparro). The authors also thank Ing. J. Escalante for his help and support with the Curie balance, and Mr Pablo Zubeldía (Tech. CICPBA) for his help with the laboratory RPI measurements. The authors would also like to thank the two anonymous reviewers for their useful comments.
Author contribution
MAI analysed measurements, interpreted the results and wrote the manuscript. MAEC performed the extraction, sub-sampling of the cores and measurement work, interpreted the results and edited the manuscript. AMS edited the manuscript and provided lab facilities. CSGG edited the manuscript. HN performed previous geological studies on the lake choice and sub-sampling of the cores. NRN performed measurements and provided lab facilities. HNB performed core sub-sampling work, measurements and provided lab facilities. All of the authors provided financial support.