Climate change has become the most important threat to human beings in the twenty-first century(Reference Ripple, Wolf and Newsome1). A recent UN report on climate change reported that the level of global warming has been negatively affecting human beings(2). Climate change, food systems and food security are interrelated terms. The food consumed and the production methods of food affect human health(Reference Schiavo, Le Mouël and Poux3). Reports on the causes and consequences of climate change have highlighted the importance of food systems and diets for the planet(Reference Willett, Rockström and Loken4–Reference Watts, Amann and Arnell7). Ecological nutrition refers to the dietary pattern aimed at protecting human health and the planet’s ecosystem. The transition to plant-based diets is thought to provide various environmental benefits, including reduced pressure on soil and water resources, less pollution and lower nitrogen and carbon-based greenhouse gas emissions. Ecological concerns arising from dwindling food resources have been reported to affect individuals’ dietary preferences, leading to behavioural changes such as limiting meat consumption and avoiding food waste(Reference Garza8,Reference Sanchez-Sabate and Sabate9) . Additionally, many dietary changes required to reduce the global burden of disease can also contribute to a decrease in greenhouse gas emissions(Reference Wang, Li and Afshin10). Therefore, due to environmental factors and climate change, individuals may wish to modify their eating habits(Reference Kim, Santo and Scatterday11–Reference Green, Joy and Harris13).
Climate change and ecological crises also affect the mental health of people by triggering their emotional distress(Reference Ojala, Cunsolo and Ogunbode14). As a result, the term eco-anxiety has emerged to describe the anxiety experienced in response to the ecological crisis(Reference Pihkala15).
The Climate Change Worry Scale is another scale that is used to investigate the correlation between environmental concerns and food-related behaviours(Reference Stewart16). The Eating-Related Eco-Concern (EREC) questionnaire is a ten-item scale that assesses the extent to which individuals consider ecological impact when making food choices due to concerns about a changing climate. Its items are based on clinical observations and psychometric properties of the previously published Climate Change Worry Scale and a literature review on eco-friendly eating and sustainable nutrition. Items of EREC are rated on a 5-point Likert scale with 1 = ‘Never’, 2 = ‘Rarely’, 3 = ‘Sometimes’, 4 = ‘Often’ and 5 = ‘Always’. The scale score is obtained by summing the scores given to the items and ranges from 10 to 50(Reference Qi, Presseller and Cooper17). Higher scores signify that the level of eating-related eco-concern also elevates. The EREC questionnaire was initially developed in the USA, and then a validity and reliability study of the questionnaire was conducted in Lebanon. A study conducted on this questionnaire in Lebanon aimed to assess the psychometric properties of the scale for use in different cultural contexts(Reference El Zouki, Obeid and Malaeb18). Afterwards, a validity and reliability study was conducted in Italy, examining the cultural adaptability and measurement sensitivity of the EREC(Reference Tecuta, Casu and Tomba19). In the literature, the relationship between ecological anxiety and eating disorders was evaluated using the EREC questionnaire in the study ‘The Role of Eco-Anxiety in the Presentation of Bulimia Nervosa: A Case Report’(Reference Runfola and Safer20). Although there are some scales in Turkiye that have been validated and are reliable to assess the relationship between climate change, anxiety and eco-anxiety(Reference Özbay and Alcı21–Reference Uzun, Öztürk and Karaman23), to the best of our knowledge, there is no valid and reliable scale to assess food-related eco-concern and nutritional relationships.
Age, BMI and gender are among the important variables affecting individuals’ eco-concern levels. It is widely observed that younger individuals report higher levels of climate change and eco-concern compared with older individuals(Reference Clayton and Karazsia24–Reference Chung, Jang and Lee26). This may be explained by the fact that young people are more sensitive to the future impacts of the climate crisis and are more likely to directly experience its long-term consequences. On the other hand, BMI was found to be negatively correlated with eco-concern, which may be related to the greater adoption of restrictive dietary patterns by individuals with lower BMI(Reference Heeren, Mouguiama-Daouda and McNally27,Reference Reser and Bradley28) . In terms of gender, it has been found that women are more concerned about climate change, have higher risk perceptions and are more likely to believe that climate change is happening compared with men(Reference Qi, Presseller and Cooper17,Reference Heeren, Mouguiama-Daouda and McNally27,Reference Reser and Bradley28) . However, a study on the EREC questionnaire has not shown a significant difference between genders, suggesting that food-related eco-concerns may have different dynamics than general climate concerns.
The aim of this study is to translate and cross-culturally adapt the widely used EREC questionnaire to screen the level of eco-concern and changes in eating-related behaviours(Reference Qi, Presseller and Cooper17–Reference Tecuta, Casu and Tomba19) into Turkish and to examine the psychometric properties and reliability and validity of the scale.
Method
Research plan and sample selection
The study was conducted between November 2023 and February 2024 with the participants who were aged between 18–65 years, were living in Mersin and volunteered to participate in the study.
Data were collected through face-to-face interviews. In scale studies, it is recommended to include 5–10 participants for each scale item. Accordingly, a sample group of 200 participants was formed for exploratory factor analysis (EFA), which is twenty times the number of items in the ten-item EREC questionnaire. The number of participants used in confirmatory factor analysis (CFA) should not be lower than the number used in EFA. Then, CFA was conducted on a different sample group of 242 participants. Adequate sample size was achieved(Reference Gorsuch29–Reference Floyd and Widaman31).
Inclusion criteria were determined as follows: being aged between 18–65, having no communication problems and being voluntary to participate in the study. Exclusion criteria were determined as follows: having communication problems, being pregnant or breastfeeding, being illiterate and being foreign nationals. In this study, the EREC questionnaire was administered to adult individuals and individuals between the ages of 18–65 in accordance with the age classification of the WHO were included in the study(32). In addition, pregnant and breastfeeding individuals were not included in the study because the physiological changes that occur during pregnancy have an impact on weight gain, eating habits, physical activity and psychological state. Changes in body image and eating behaviours during pregnancy may lead to increased vulnerability to eating disorders. Social factors such as media, family and friends have also been reported to be effective in this process(Reference Fiat, Merghes and Scurtu33–Reference Saleem, Saleem and Shoib36). Before starting the study, permission was obtained from Baiyu Qi, one of the scale authors, via e-mail. The ethics committee approval was obtained from Nuh Naci Yazgan University Scientific Research and Publication Ethics Committee on 23/10/2023 with the decision numbered 2023/009–012 to conduct the study. The participants were informed about the study, and their written and verbal consent was obtained. A socio-demographic data form had sixteen questions about the participants’ gender, age, marital status, educational level, family type, dietary habits, chronic diseases and medications. Anthropometric measurements (five questions) and body composition of the participants were taken before the study. BMI was calculated by dividing body weight in kilograms by the square of height in metres. The BMI was evaluated based on the classification provided by the WHO. According to this classification, individuals with a BMI of < 18·50 kg/m2 are classified as underweight, those with a BMI between 18·50 and 24·99 kg/m² as normal, individuals with a BMI between 25·00 and 29·99 kg/m2 as overweight and those with a BMI > 30·00 as obese. In the present study, the participants were divided into two groups: those with a BMI below 25·00 kg/m² (underweight and normal) and those with a BMI of 25·00 kg/m² or above (overweight and obese)(Reference Weir and Jan37). In the analyses, BMI was used as a categorical independent variable, not as a continuous covariate. The participants were grouped based on the BMI criteria of the WHO, and the comparisons were made between the two BMI categories: < 25·00 kg/m² and ≥ 25·00 kg/m².
The Translation–Back Translation method was performed. After the necessary revisions were made, a pilot study was conducted, and the questionnaire was applied to the sample. The EREC questionnaire, consisting of ten questions, was applied by the face-to-face interview method.
Turkish adaptation procedures
The validity of the scale was assessed by evaluating language, content, face and construct validities. On the other hand, the reliability of the scale was evaluated by evaluating the time invariance and internal consistency analyses. While conducting the study, steps on the scale adaptation guide of the WHO were taken into consideration(Reference Çapık, Gözüm and Aksayan38). The language validity of the scale was ensured by using the Translation–Back Translation method. The English version of the scale presented by the authors was translated into Turkish by two academicians (T.K., İ.K.) who have a good command of English. The scale form was back-translated from Turkish to English by two independent translators (N.Y., J.A.D.C.) who have a good command of Turkish and compared with its original English version. The translated scale was independently evaluated by four academicians (E.B., G.G.Ş., N.K., S.Ç.) specialised in nutrition and dietetics.
The Davis technique was used to question translation suitability and content validity; index values and content validity ratio were calculated(Reference Davis39). Experts gave the scale items a score between 1 and 4: 1 point = not appropriate; 2 points = somewhat appropriate (major revision required); 3 points = fairly appropriate (minor revision required); and 4 points = very appropriate. The content validity ratio value for each item was calculated by dividing the number of experts who gave 3 or 4 points to the scale items by the total number of experts. The content validity index value was calculated by summing the content validity ratio values of all items and dividing by the total number of items. It was considered sufficient in terms of content validity that the scale’s content validity ratio value was greater than 0·70 and the content validity index value was greater than 0·80. Necessary corrections were made in line with the expert opinions. In addition, the items were evaluated in terms of conceptual equivalence and cultural adaptation, taking into account the Turkish cultural structure and target group, and necessary changes were made. After this step, the scale was made suitable for a pilot study(Reference Ayre and Scally40–Reference Wilson, Pan and Schumsky42).
Pilot study
A pilot study was conducted to evaluate the face validity of the Turkish version of the EREC. Face validity is a process of obtaining expert opinions on whether the items in the scale are directed towards the related subject. Statistical evaluations are not made in this study(Reference Tavşancıl43). It has been reported that the pilot study should be applied to at least 30–40 people representing the sample(Reference Çapık, Gözüm and Aksayan38). In the cognitive interview applied to these forty participants, the participants were asked to read the scale questions aloud and explain each item in their own words. By this method, the comprehensibility, language simplicity and conceptual clarity of the scale items were evaluated. The participants’ opinions and suggestions were carefully recorded, and all feedback was analysed.
Test-retest
The test-retest method was used to assess time invariance. According to the COSMIN guidelines, a sample size of over 100 participants is considered sufficient for retest measurements(Reference Lawshe41). Based on this recommendation, the retest was conducted with 106 participants.
The scale was re-administered to 106 participants 2 weeks after the first study, and the consistency between the first study and the test-retest was examined. Test-retest reliability coefficients were evaluated using the intraclass correlation coefficient (ICC) based on a one-way random effects model in which participants were randomised. The ICC value is a statistical measure used to assess reliability and consistency between measurements. It is often used to determine the reliability of scales, tests or inter-observer assessments. There is a generally accepted scale for interpreting the ICC value. Accordingly, ICC values less than 0·5 indicate poor reliability, values between 0·5 and 0·75 indicate moderate reliability, values between 0·75 and 0·9 indicate good reliability and ICC values greater than 0·9 indicate excellent reliability(Reference Koo and Li44). This classification helps to understand how reliable the measurement or assessment is and plays a critical role in assessing the scientific validity of the results. In order to increase reliability, it is recommended to standardise the measurement conditions, ensure inter-observer consistency and use an adequate sample size. The reliability level of the scale was determined by calculating Cronbach’s α coefficient(Reference Koo and Li44).
Statistical analysis
Qualitative data were summarised with numbers and percentages, while quantitative data were summarised with mean and standard deviation. If the variance assumptions were met, group comparisons were made with an independent two-sample t test for two groups and one-way ANOVA for more than two groups. If the variance assumptions were not met, the Welch’s t test and Welch’s ANOVA test were used. Additionally, the Bonferroni adjustment method was used to solve the multiplicity problem.
For the reliability and validity study, item analyses and EFA were conducted with a sample of 200 participants, followed by CFA with an independent sample of 242 participants to verify the factor structure identified through EFA. Moreover, Cronbach’s α coefficient was calculated to assess internal consistency, and ICC was calculated to assess consistency in repeated measures (test-retest). In item analyses, item-remainder correlations and Cronbach’s α coefficient statistics were examined when the item was deleted. EFA was based on the polychoric correlation coefficient, and Bartlett’s test of sphericity was used to assess the factorability of the data, and the Kaiser–Meyer–Olkin statistic was used to assess sampling adequacy. While principal axis factoring was used as the factor extraction method, the Promax method was used as the rotation method. In order to determine the number of factors, the number of eigenvalues greater than 1 (Kaiser criterion) and the parallel analysis method were evaluated. The rate of variance explained was taken into consideration and reported. The CFA was performed with the unweighted least squares method. These fit indices are crucial in assessing the validity and reliability of the model. The ratio of χ 2 to df is commonly used to evaluate the results of a χ 2 test. This ratio helps to identify how well the test results fit or match the expected values(Reference Field45). Comparative Fit Index, Goodness-of-Fit Index, non-normed fit index and Tucker–Lewis Index were used to evaluate the goodness of fit. The Bentler–Bonett’s Normed Fit Index, root mean square error of approximation and standardised root mean square residual statistics were calculated. Results were reported as coefficient estimates, se of the coefficient estimates, coefficient CI and p-values for the coefficients, as well as standardised coefficients and R 2 statistics.
The ratio of χ 2 to df less than 2 indicates a good fit, while a value less than 3 is considered an acceptable fit(Reference Kline46,Reference Schermelleh-Engel, Moosbrugger and Müller47) . Goodness-of-Fit Index represents the overall fit of the model, values of > 0·95 indicate a good fit and values of > 0·90 represent an acceptable fit(Reference Hu and Bentler48). Similarly, the Comparative Fit Index assesses the model fit in comparison to an alternative model, with > 0·95 indicating a good fit and > 0·90 indicating an acceptable fit(Reference Hu and Bentler48,Reference Bentler49) . Tucker–Lewis Index accounts for model complexity in its assessment. A value of > 0·95 indicates a good fit, while a value > 0·90 represents an acceptable fit(Reference Hu and Bentler48,Reference Tucker and Lewis50) . Normed Fit Index measures the model’s improvement over the baseline model, where > 0·95 represents a good fit and > 0·90 represents an acceptable fit(Reference Bentler and Bonett51). Root mean square error of approximation indicates a good fit when values are low, with < 0·05 representing a good fit and < 0·08 representing an acceptable fit(Reference Browne, Cudeck, Bollen and Long52). Standardised root mean square residual measures the difference between observed and predicted correlations, with values < 0·05 indicating a good fit and < 0·08 indicating an acceptable fit(Reference Hu and Bentler48). The R² represents the ratio of variance explained by the model, where a value > 0·10 is considered acceptable(Reference Hair, Black and Babin53). The Type I error level was set at 5 %. Analyses were performed using JASP software (Version 0.18.3, University of Amsterdam).
Result
The majority of the participants were female (68·3 %) and were aged between 18 and 44 years (92·5 %). Most of the participants were single (50·4 %) and were living with their nuclear families (82·6 %). 75·8 % of the participants had a bachelor’s degree or higher. 65·4 % were employed, and 47·5 % had an income equal to their expenses. According to the BMI classification, 52·9 % of the participants were normal weight, and 34·2 % were mildly overweight.
Validity
To assess content validity, Content Validty Ratito (CVR) values were calculated as 1·00 for all items, resulting in a Content Validity Index (CVI) value of 1·00. Given that a CSR value above 0·70 and a CGI value above 0·80 indicate sufficient content validity, the scale was deemed adequate in this regard. In the pilot study conducted with forty participants, it was observed that all scale items were clear and understandable, with no indications of ambiguity or confusion. Consequently, no revisions were necessitated, and the original version of the scale was retained. The data of the pilot study were not included in the main analysis. Construct validity was evaluated through a two-step statistical approach, beginning with EFA to identify the underlying factor structure, followed by CFA to validate and confirm the model fit. Item-rest correlation analysis showed that factor loadings ranged from 0·490 to 0·661, while the overall factor loadings ranged from 0·406 to 0·860. Cronbach’s α coefficients were calculated as 80·3 % for Factor 1 (M9, M8, M10, M7 and M1), 74·4 % for Factor 2 (M2, M3 and M6), 67·4 % for Factor 3 (M4 and M5) and 82·7 % for the overall scale. Following the evaluation of the modification indices, the suggested modifications between M2 and M3 (referring to avoiding meat and animal products due to concerns about climate change) and between M7 and M8 (referring to avoiding GM foods due to concerns about biodiversity loss and trying to eat only organic or pesticide-free foods) were implemented. These modifications resulted in a decrease of 16·49 and 14·17, respectively, in the total χ 2 value, indicating an improved model fit.
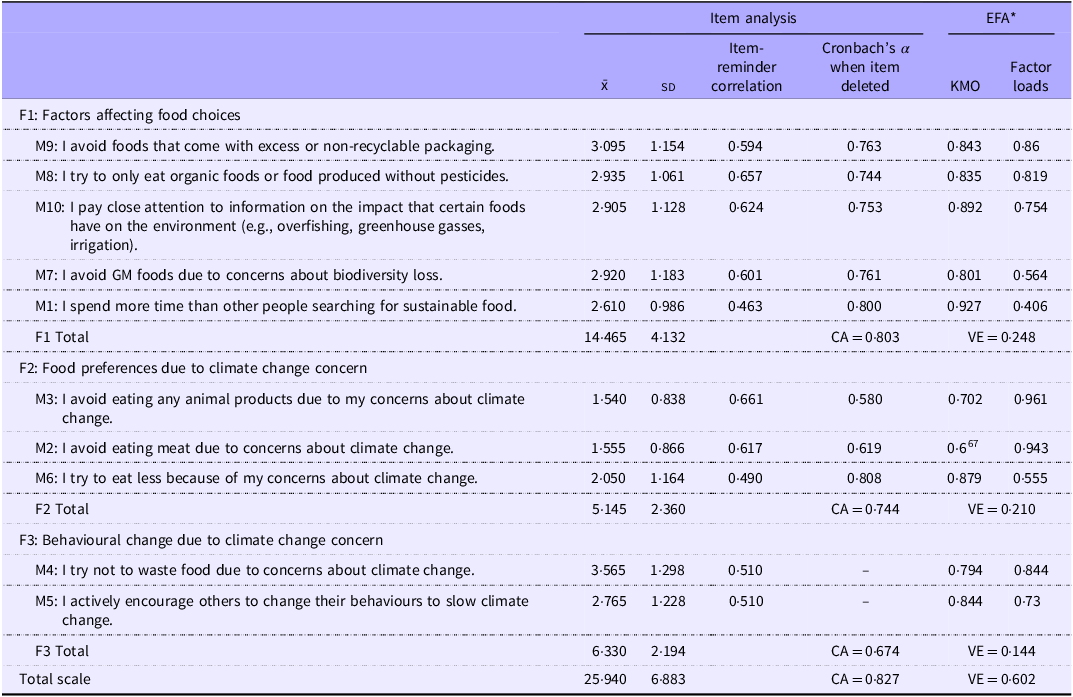
As a result of EFA, it was observed that the total explained variance ratio was 60·2 %. Although item 6 was removed from the scale, Cronbach’s α value increased for the factor related to the removal of the item; it was not preferred to reduce the number of items to two, considering that Cronbach’s α statistic was sufficient. Since the lowest Kaiser–Meyer–Olkin statistic was 0·667 and Bartlett’s test of sphericity was significant (P < 0·001), the factorability of the data and sampling adequacy were ensured (Table 1). In summary, there was a three-factor structure in which all statistics were at a sufficient level. This adequately fitting structure was then tested using CFA on an independent sample. After considering the modification suggestions, covariance was defined between M7 and M8 and between M2 and M3. Statistically significant correlations were found between these items (Fig. 1, standardised coefficients were calculated as 0·31 and 0·72, respectively).
Item analyses and results of exploratory factor analysis (n 200)

x̄: mean; CA, Cronbach’s α; VE, variance explained; KMO, Keiser-Meyer-Olkin; EFA, exploratory factor analysis.
* Factor extraction method: principal axis factoring. Rotation method: Promax. Correlation matrix used: polychoric. Bartlett’s test: χ 2 = 926.57, df = 45, P < 0·001, root mean square error of approximation = 0·088, standardised root mean square residual = 0·024, Comparative Fit Index = 0·968, Tucker–Lewis Index = 0·92.
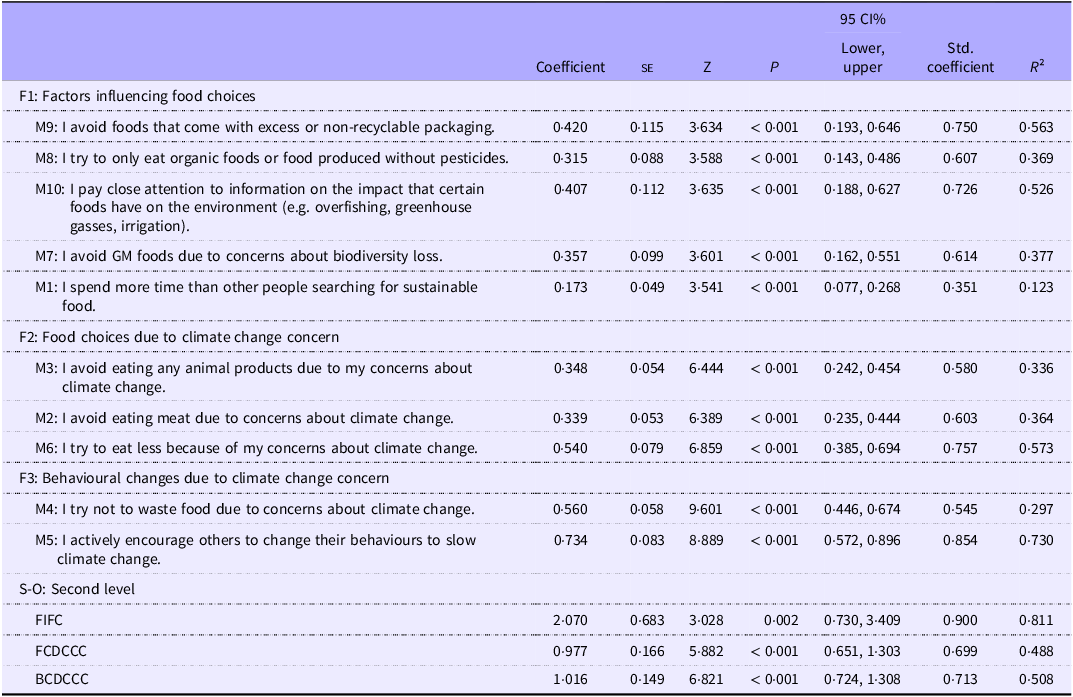
Model coefficients for second-level confirmatory factor analysis.

All path coefficients obtained as a result of CFA were statistically significant (P < 0·001). When the statistics regarding the fit of the model were examined, it was found that the χ 2/sd (1·353) statistic was less than 2; Goodness-of-Fit Index (0·995), Comparative Fit Index (0·995), Tucker–Lewis Index (0·993) and Normed Fit Index (0·983) statistics were greater than 95·0 %; and root mean square error of approximation (0·038) and standardised root mean square residual (0·044) statistics were less than 5·0 %. The smallest R² statistic was calculated as 12·3 % (Table 2). According to all indices, it can be asserted that the model fit the data or the data validated the model.
Results of confirmatory factor analysis (n 242)

FIFC, Factors Influencing Food Choice; FCDCCC, Food Choices Due to Climate Change Concern; BCDCCC, Behavioural Changes Due to Climate Change Concern.
Std. coefficient, standardised coefficient.
Compliance statistics: χ 2 = 40·59, df = 30, χ 2/df = 1·353, Goodness-of-Fit Index = 0·995, Comparative Fit Index = 0·995, Tucker–Lewis Index = 0·993, Normed Fit Index = 0·983, root mean square error of approximation = 0·038, standardised root mean square residual = 0·044.
Reliability
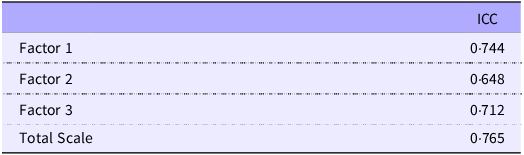
The test was administered again with 106 participants who were included in the CFA, and the test-retest consistency was examined with ICC statistics. Although Factor 2 showed a relatively low value (ICC = 0·648), the other factors and the total scale score were at a sufficient level (> 0·70) (Table 3). The model obtained through EFA was tested with CFA and found to be valid. When each item analysis, EFA, CFA and test-retest results were evaluated together, it was observed that the scale was valid and reliable, especially in terms of the use of the total scale score, and all goodness-of-fit statistics were adequate.
Consistency for test-retest (n 106)

ICC, intraclass correlation coefficient.
Group comparisons
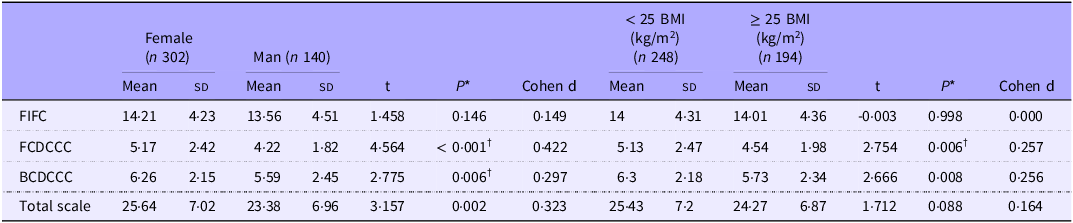
When the gender groups were compared in terms of the scale scores, it was found that the mean score of female participants was statistically significantly higher than the mean of men in all dimensions except for the Factors Influencing Food Choice factor and in the total scale score (Table 4, P < 0·05). When BMI groups were compared in terms of scale scores, the mean of the < 25 kg/m2 BMI group was found to be statistically significantly higher than the mean of the ≥ 25 kg/m2 BMI group in the factors of Food Choices Due to Climate Change Concern and Behavioural Changes Due to Climate Change Concern (Table 4, P < 0·05). The participants with BMI values in the normal and underweight ranges were significantly more likely to change their food preferences and behavioural changes due to climate change anxiety than slightly obese and obese individuals. When income groups were compared in terms of scale scores, the difference between mean scores of the groups was not statistically significant (finding not in the Table, P > 0·05).
Comparison of scale scores according to gender and BMI groups

FIFC, Factors Influencing Food Choice; FCDCCC, Food Choices Due to Climate Change Concern; BCDCCC, Behavioural Changes Due to Climate Change Concern.
*Independent two-sample t test. †Welch t test.
Discussion
In this study, the EREC(Reference Qi, Presseller and Cooper17), a short and validated screening tool to assess eco-concern levels and changes in eating-related behaviours, was translated into Turkish, and its validity and reliability were evaluated. While scales assessing anxiety on climate change are available in Turkey(Reference Özbay and Alcı21,Reference Cebeci, Karaman and Öztürk22) , there is no validated tool that comprehensively assesses food-related eco-concern(Reference Uzun, Öztürk and Karaman23). The Turkish version of the EREC questionnaire is the third language adaptation of this scale. The original version of the scale was developed in the USA and adapted into Arabic and Italian before the present study(Reference El Zouki, Obeid and Malaeb18,Reference Tecuta, Casu and Tomba19) .
To examine the construct validity, the results of CFA showed that certain errors in covariates added to the one-factor model of the original scale improved the fit of the model to the data. Specifically, error terms were found to share common variance between the items that refer to avoiding meat and animal products due to concerns about climate change (M2 and M3) and the items that include avoiding GM foods due to concerns about biodiversity loss (M7) and trying to only eat organic or pesticide-free foods (M8). These covariations are theoretically and logically consistent although they are not reported in previous EREC validation studies. In particular, items 2 and 3 reflect dietary changes shaped by concern about the effects of animal food consumption on climate change. In the CFA, significant covariates between items 2 and 3 and items 7 and 8 indicated that climate change concern was associated with both avoidance of meat/animal product consumption and tendencies to consume organic and non-GM foods, which is compatible with previous studies(Reference Sanchez-Sabate and Sabate9,Reference Cheah, Shimul and Liang54–Reference Turnes, Pereira and Cid56) . As a result, modelling error covariations between scale items strengthened the construct validity of the EREC and better explained the overlaps between dietary preferences based on environmental concerns. These covariations were also observed in the Italian adaptation of the original scale, supporting the consistency and validity of findings of the present study(Reference Tecuta, Casu and Tomba19).
In the original EREC questionnaire, factor analysis results (including parallel analysis, Kaiser’s rule and scree plot) showed that the EREC questionnaire consisted of a single dimension(Reference Qi, Presseller and Cooper17). In the Arabic adaptation study, the results of the parallel analysis, which accounted for 69·05 % of the variance, showed that the scale had a unidimensional structure as in the original scale(Reference El Zouki, Obeid and Malaeb18). In its Italian adaptation study, the results of CFA conducted to assess the internal construct validity of the scale showed that the model fit the data well with the addition of error covariates between specific items(Reference Tecuta, Casu and Tomba19). In the present study, the results of EFA indicated that there was a three-factor structure in which all statistics were at a sufficient level: F1: Factors Influencing Food Choices → (M9, M8, M10, M7, M1); F2: Food Choices Due to Climate Change Concern → (M3, M2, M6); and F3: Behavioural Changes Due to Climate Change Concern → (M4, M5). This structure was further tested with another sample (participant group) by CFA. According to all analyses, it can be asserted that the model fit the data or the data confirmed the model. Unlike the original EREC questionnaire, rather than fully retaining the structure, the main themes of the scale remained similar, but the factor organisation changed. This difference may be due to the culture-specific interpretation of the scale, the different ways in which environmental concerns are perceived or differences in sample size.
In the EREC questionnaire, the Cronbach α coefficient was found to be 0·87 in the subset(Reference Qi, Presseller and Cooper17), 0·91 in the Arabic adaptation(Reference El Zouki, Obeid and Malaeb18) and 0·90 in the Italian adaptation(Reference Tecuta, Casu and Tomba19). In the Turkish adaptation, this value is 0·82. This value was found to be sufficient (> 0·70) for the overall scale(Reference Koo and Li44).
Environmental anxiety is believed to drive individuals towards more sustainable eating habits and reduce the consumption of animal-based foods. In this context, it is suggested that environmental anxiety and concerns about climate change can shape food preferences and lead individuals to adopt more sustainable eating behaviours(Reference Lai, Tirotto and Pagliaro55). However, the literature shows that women experience higher levels of environmental anxiety than men, and this anxiety may be more effective in guiding women towards more sustainable eating habits. Women are found to carry higher levels of anxiety and a greater sense of responsibility regarding climate change(Reference López, Martínez and Fernández57) and are more willing to engage in environmentally friendly behaviours(Reference White, Habib and Jafry58). This has been confirmed in studies showing that women are more likely to adopt sustainable eating behaviours, such as increasing organic food consumption and reducing meat intake.
In the literature, some studies have reported no significant difference between the eco-anxiety levels of women and men(Reference Patrick, Snell and Gunasiri59,Reference Whitmarsh, Player and Jiongco60) . However, other studies have indicated that male university students have lower environmental behaviour scores compared with their female counterparts(Reference Weerasekara, Withanachchi and Ginigaddara61). The literature indicates that women are more likely to believe that climate change is happening(Reference Clayton, Pihkala and Wray62), perceive more climate change risk(Reference Ergun, Karadeniz and Rivas63) and are more concerned about it(Reference Bush and Clayton64). In a study examining the relationships between mental health, lifestyle factors and climate change concerns among Norwegian adolescents, it was found that female students were more likely to worry about climate change. However, no gender difference was observed in eco-anxiety related to eating habits(Reference Leonhardt, Granrud and Bonsaksen65). Likewise, another study assessing the eco-concern levels of university students and their association with eating habits revealed that female students had higher scale scores compared with male students. This finding indicated that female students had higher levels of eco-anxiety than male students. Additionally, when the relationship between the eco-concern scale score and questions related to climate change was evaluated, it was reported that students with higher eco-concern levels believed that they had more individual influence on climate change(Reference Oral and Durmuş66). Women were more concerned about environmental health and felt a stronger sense of personal responsibility. This may explain why environmentally sustainable dietary behaviours, such as increasing consumption of organic food(Reference Gundala, Nawaz and Boobalan67) and reducing meat consumption(Reference Ripabelli, Mastronardi and Tamburro68), are more common among women(Reference Wollmar, Post and Sjöberg69).
In the original study of the EREC questionnaire, it was found that there was a significant difference between male and female participants in terms of climate change anxiety (t(221) = −2·90, P = 0·0042) and female participants showed higher levels of climate change anxiety compared with male participants (mean = 30·53, sd = 8·06; mean = 26·57, sd = 9·06 for men). However, this anxiety did not have any effect on eating behaviours(Reference Uzun, Öztürk and Karaman23). In the Arabic adaptation of the scale, no significant difference was found between men and women in terms of scale scores (mean = 16·39, sd = 5·93 v. mean = 15·98, sd = 5·98, t(761) = 0·905, P = 0·366)(Reference El Zouki, Obeid and Malaeb18). In the Italian adaptation, the sample was highly gender imbalanced, and 85 % of participants were identified as female. As a result, no gender comparison was made in the Italian adaptation(Reference Tecuta, Casu and Tomba19).
The analyses showed that configurational, metric and scalar invariance was maintained between genders. This suggests that the scale measures similarly for both genders, and these findings are consistent with the initial EREC study. Although previous studies indicated that women had higher levels of general environmental concerns (e.g. about climate change), there were no gender differences in environmental concerns related to eating habits. This finding is compatible with the results of the Arabic adaptation of the scale. In this study, the majority of the participants were female (76·0 % in EFA and 62·0 % in CFA). When the gender groups were compared in terms of scale scores, it was found that the mean scores of female participants were statistically significantly higher than the mean scores of their male counterparts in all factors except for the Factors Influencing Food Choice and in the total scale score (Table 4, P < 0·05). These findings suggested that women had higher levels of environmental concerns than men and that this also affected their food-related eco-concerns. There are also studies in the literature reporting that there is no significant difference in the level of eco-anxiety in women compared with men(Reference Patrick, Snell and Gunasiri59,Reference Whitmarsh, Player and Jiongco60) . There is a need for further studies evaluating the relationships between eco-concern, gender and dietary habits in a more comprehensive manner.
There are studies in the literature suggesting that climate anxiety and eco-anxiety are more pronounced among younger individuals(Reference Clayton and Karazsia24,Reference Rocchi, Pileri and Luciani25) . The mean age of the participants in the original EREC questionnaire and its Italian adaptation was 37 years(Reference Stewart16,Reference Tecuta, Casu and Tomba19) , while in the Arabic adaptation, the mean age was 28 years(Reference El Zouki, Obeid and Malaeb18). In both the original EREC questionnaire study and its Arabic adaptation study, the correlation between age and EREC scores has not been discussed. In its Italian adaptation study, no relationship was found between EREC scores and younger age(Reference Tecuta, Casu and Tomba19). This suggests that climate-related concerns are not exclusive to younger generations in the Italian context. One possible explanation for this difference could be the increasing frequency and severity of climate change events, such as extreme heat waves(70). These events particularly lead to more pronounced health issues in older adults, suggesting that eco-anxiety affects not only young adults but also older individuals who are directly affected by such events(Reference Tecuta, Casu and Tomba19). In the present study, however, no clear relationship was established between age distribution and food-related eco-anxiety levels.
In recent years, the relationship between BMI, eco-concerns and dietary habits has attracted increasing attention. The related studies have shown that individuals’ levels of eco-anxiety can affect their food choices and behavioural changes related to sustainability. For example, individuals with higher levels of eco-anxiety tend to adopt more environmentally friendly eating behaviours, such as reducing meat consumption and increasing the intake of plant-based and organic foods(Reference Sanchez-Sabate and Sabate9,Reference Cheah, Shimul and Liang54) . Furthermore, a relationship has been found between BMI and eco-concern levels, with some studies suggesting that normal-weight or underweight individuals are more likely to engage in pro-environmental dietary behaviours compared with those with higher BMI values(Reference Turnes, Pereira and Cid56).
A study conducted to evaluate the eco-anxiety levels of university students and to examine the relationship between this anxiety and eating habits reported that there was no significant difference between BMI groups in terms of eco-anxiety scale scores (P > 0·05)(Reference Bush and Clayton64). In the original scale study and its Italian adaptation study, it was found that the scale scores did not show a significant correlation with BMI and EREC(Reference Qi, Presseller and Cooper17,Reference Tecuta, Casu and Tomba19) . There is no discussion about BMI in its Arabic adaptation study. However, when BMI groups were compared in terms of scale scores in the present study, it was observed that the < 25·00 kg/m² BMI group scored statistically significantly higher on the Food Choices Due to Climate Change Concern and Behavioural Changes Due to Climate Change Concern factors compared with the ≥ 25·00 kg/m² BMI group (Table 4, P < 0·05). Normal-weight and underweight participants showed a significantly higher tendency to change their food preferences and alter their behaviours due to eco-concern compared with slightly overweight or obese individuals (Table 4). This may be attributed to the fact that individuals with low BMI tend to pay more attention to their health and environmental concerns lead them to change their behaviours more. On the other hand, this effect was less significant in obese or slightly overweight individuals, suggesting that the effect of environmental concerns on eating behaviours may vary depending on physical factors.
In conclusion, the EREC questionnaire, a ten-item scale that assesses the extent to which individuals consider the ecological impact when making food choices due to concerns about eco-anxiety, is a valid and reliable scale adapted to Turkish. This scale is used to evaluate the environmental concerns that shape individuals’ dietary habits. The diversity of experiences and cultural contexts is of great importance in the application of assessment tools like the EREC questionnaire in different linguistic and cultural settings. This may pave the way for future studies and enable to conduct studies on eco-concern and dietary habits across various cultural contexts. It is recommended that this scale be used to evaluate environmental concerns and eating habits in more detail.
Strengths and limitations
The limitations of the study are that the study had a limited sample size; data were collected through self-reports, which may be affected by participant bias; and causal relationships were not examined due to the cross-sectional design. Additionally, while the validity and reliability of the Turkish version of the EREC questionnaire were tested, validation studies in different cultural contexts are lacking. The fact that the majority of the participants were aged between 18 and 44 also limits the evaluation of the effect of age. The age distribution reflects the group that voluntarily agreed to participate in the study, independent of the researchers. Thus, results cannot necessarily be generalised. In future studies using this scale, we recommend that the results be evaluated in terms of young adults by considering the limitations regarding the distribution of age groups. These limitations highlight the need for future research with larger and more diverse samples. In addition, a strength of the present study is that an acceptable sample size was used to examine the consistency and reliability of the EREC among Turkish adults. The EREC questionnaire is a viable and effective tool for assessing the level of eco-concern and changes in eating-related behaviours. The use of various factor analysis techniques, such as EFA and CFA, provides a robust methodological approach to verify the construct validity of the scale.
Acknowledgements
The authors would like to thank all the experts who took part in the translation (Turan Karadeniz, İlknur Karakuş, Nihan Yıldızel, Jacob Anthony De Camillis), adaptation (Eda Başmısırlı, Neşe Kaya, Gülşah Güneş Şahin, Sema Çalapkorur) and statistical analysis (Ayhan Parmaksız) steps, as well as the participants.
G. S. B.: Conceptualisation. Methodology. Investigation. Writing – original draft. Writing – review and editing. A. G. Ç.: Conceptualisation. Methodology. Writing – review and editing. Supervision.
No financial support was received.
There are no conflicts of interest.
The data supporting this study’s findings are available upon request from the corresponding author.
This study adhered to the Declaration of Helsinki and was approved by the Scientific Research and Publication Ethics Committee of Nuh Naci Yazgan University (Decision No: 2023/009–012, Decision Date: 23/10/2023).