The second half of the nineteenth century witnessed a dramatic decline for the city of Dublin in terms of the economy, infrastructure, and public health, which resulted in high debt (Craft Reference Craft1970; Daly Reference Daly1984; Ó Gráda Reference Gráda1995). Simultaneously, local government was gaining power (particularly to tax and spend), and without a national government on home soil, the Dublin municipal government (Dublin Corporation) was also becoming a key voice of the Nationalist movement in Ireland, largely supported by Catholics (O’Brien Reference O’Brien1982, p. 70). In the late nineteenth century, the wide and complicated question of local government and taxation weighed more heavily on the minds of the residents of Dublin than any other question of home politics (Pim Reference Pim1875). Accordingly, it seemed Dubliners, particularly wealthy residents, were becoming increasingly disenchanted with municipal government politics and high taxation. At the same time, with Nationalist political advances and dominance in rulemaking, Protestant residents were gradually losing control of how their taxes were spent (Brady Reference Brady, Simms and Brady2001). Many social historians have argued that the discontent of these city residents with their local government was a major factor behind their exodus to the surrounding independent townships, which, in turn, was a pivotal contributor to the decay of the city of Dublin (O’Brien Reference O’Brien1982; Daly Reference Daly1984; Prunty Reference Prunty1998).
The decaying infrastructure, worsening public health, and the high debt, together with the shrinking tax base in Dublin, would eventually lead the city to expand its boundaries in 1901 through the annexation of adjacent independent townships. Annexation is a process that is often argued to strictly benefit annexing cities (poorer) at the expense of the annexed suburbs (wealthier), as discussed by Filer and Kenny (Reference Filer and Kenny1980) and modeled by Ellickson (Reference Ellickson1971). We take advantage of this unique policy intervention in 1901 to test residential preferences for municipal independence at the turn of the twentieth century. The annexation, which did not require consent by the annexed townships, was initially planned to include the northern townships of Clontarf, Drumcondra, Glasnevin, the western Kilmainham, and the southern Rathmines and Pembroke. The latter two areas eventually escaped the 1901 annexation, which makes these areas a convenient choice to use as a control group in our study. By looking at the behavior of households exposed to this shock in comparison to our control, we estimate how a change in local government affects residential choice, revealing preferences over local government.
We employ the returns of the 1901 and 1911 Irish Censuses to construct a household-level dataset for houses located on the boundaries between three distinct areas of Dublin (the city, the annexed townships, and an independent township—these areas represent 16–23 percent of the wards that they are part of). With detailed data on each household within these three selected areas, not only are we able to compare the residential turnover within different areas across time, but we are also able to break this down by household characteristics. The census data is supplemented with housing prices from Thom’s Irish Almanac & Official Directory.
Using this data, we first test whether household characteristics before the annexation are more similar to each other in the annexed and independent townships than they are to the nearby city. This is a way to test whether the city attracts different types of residents than the townships, in line with the intuitive city/suburbs model presented in Brueckner (Reference Brueckner2011, ch. 3). We then use the annexation as a shock, which changes the local government in some areas, to verify the Tiebout-type hypothesis (1956) that households vote with their feet, in other words, that wealthy residents and Protestant residents were fleeing Dublin to escape from the city’s government and its high taxation. Put differently, we look at the residential reaction (change in area demographic composition) to the imposed change of local government in the annexed townships and contrast it to both a township that remained independent and the original city.
The results indicate that wealthy residents and Protestant residents were inclined to move away from the annexed townships in the period after annexation, and there was no such effect in the area that remained independent. Moreover, we offer evidence of the increase in the inflow of wealthy Protestants into the independent townships at the same time. This migration supports the idea put forward in the literature: The desire for lower taxation and/or political autonomy was a factor in the exodus of these groups from the city of Dublin at the turn of the twentieth century (O’Brien Reference O’Brien1982; Daly Reference Daly1984; Prunty Reference Prunty1998). The residential preferences uncovered in this analysis lend themselves to a better understanding of the evolution of the city of Dublin over the following century. For example, the fact that the annexation occurred only on the north side of the city potentially explains the stark differences in development between the north and south sides of the River Liffey (the line that geographically splits the city in two), still recognizable today. Some implications might be extended to the dozens of British cities that were also annexed around the turn of the twentieth century.
Our paper makes novel contributions on several fronts. First, it is the only study to address urban exodus and its implications as a direct response to municipal annexation.Footnote 1 Second, it is also one of only a couple of studies (Dilworth (Reference Dilworth2005) being the other) that look at the phenomenon of nineteenth-century residential behavior, in particular suburbanization, as an outcome of preferences over local government. In Dublin, nineteenth-century central-city decline was more prominent than in any other city in the United Kingdom,Footnote 2 making Dublin the ideal backdrop to study urban residential movement and its outcomes from a historical perspective. Third, this paper is one of the very few studies to use individual-level data to provide a direct analysis of a migratory response to local government actions, showing how specific individuals might respond (move-out, move-in, or stay in a given area). Finally, the paper also contributes to the field of Irish economic and social history. Scholarly work documents the flight of the well-off Protestant class from the city in reaction to their dissatisfaction with municipal government policies and actions, such as the imposition of high property taxes and the Nationalist political agenda (see Daly Reference Daly1984; O’Brien Reference O’Brien1982), but does not test this empirically.
After a description of the process of urbanization, political economy, and the historical background leading up to the annexation, we briefly present the theoretical and empirical model. We highlight the main features of the data that we use to engender the empirical results that follow, and we provide sensitivity checks before concluding.
DUBLIN’S HISTORICAL BACKGROUND
To understand the historical background of our research question, we need to highlight changes happening in Dublin in the second half of the nineteenth century on three levels. First, we need an understanding of demographic changes (urban decline, suburban rise), second, the shifting political control and fiscal policy oversight of the city, and finally, the motivation for the annexation.
General Urban Decline and Suburban Growth
In the second half of the nineteenth century, urban infrastructure in the city of Dublin decayed, public health declined, and the quality of city life fell substantially. The social history literature investigates why Dublin suffered such a downturn throughout the nineteenth century and beyond, and in doing so, it logically asks why there was a large movement of wealthier classes away from the city. Dubliners have been known to simply blame The Act of Union 1800 for their city’s failure to thrive both at the time and still today (see O’Brien 1910, p. 246; Dickson Reference Dickson2001, p. 114).Footnote 3 However, academic studies on the urban decline in Dublin instead pinpoint the initial cause of Dublin’s decline to the city’s failure to industrialize its economy, leading to limited employment opportunities (Craft Reference Craft1970, p. 307). Despite the lack of jobs, the city was a magnet for unskilled rural workers, particularly in years of poor agricultural yield (Ó Gráda Reference Gráda1995, p. 250). As a result, Dublin was increasingly becoming a city populated by transient general laborers at times of downturns (Craft Reference Craft1970, p. 309), which was emphasized by the fact that Dublin was Ireland’s principal port for imports/exports related to the agriculture industry (Daly Reference Daly1984, p. 54).
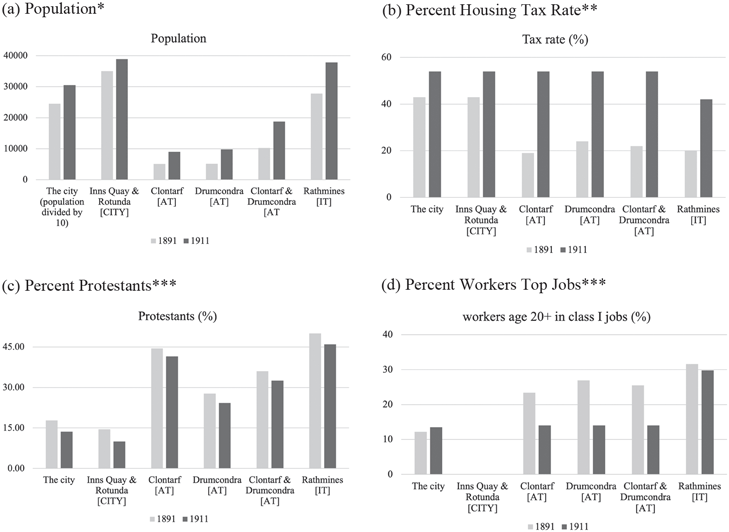
At the same time, following a growing international trend, upper-class city dwellers relocated to the fresh and open environs outside of municipal boundaries: the “garden suburbs” (Harris and Larkham 1999, ch. 4). The innovation in improving modes of transportation made living in the suburbs and working in the city feasible, with horse-drawn buses and trams linking the suburbs to the city by the 1870s (Craft Reference Craft1970; Corcoran Reference Corcoran2000). Suburban growth and the related city decline peaked in the latter decades of the nineteenth century. To illustrate these contrasting trends, Figure 1(a) gives population figures for the city, two selected wards of the city (Inns Quay and Rotunda), and three surrounding townships (Clontarf, Drumcondra, and Rathmines) in the two census years 1891 and 1911. The areas displayed in the figure are those that later will become part of our empirical analysis. Inns Quay and Rotunda [CITY] will be the wards representing the city; Clontarf and Drumcondra [AT] the areas representing the annexed townships; and ultimately, Rathmines [IT] an area that was not annexed (independent). The figure shows that the whole city of Dublin city’s population grew by 24 percent between 1891 and 1911, mainly due to the annexation that occurred in 1901; without the annexation, the city remained relatively stagnant, Inns Quay and Rotunda grew mildly (about 10 percent), indicating that some wards in the city grew less. By contrast, the suburbs (we interchangeably use the terms suburb and township as they are both widely used in the related literature) grew substantially, by about 35 percent in Rathmines and 80 percent in Clontarf and Drumcondra.
AGGREGATE SUMMARY STATISTICS
Notes: *From 1901 Dublin City’s population is inclusive of the annexed townships Clontarf, Drumcondra, and Kilmainham. The population of this latter was 8,783 in 1901 and 9,630 in 1911. **Due to information limitation, the year 1891 is the actual year 1881 for The City and it is the year 1894 for the townships; the year 1911 is the actual year 1910. Note that in 1911 Clontarf and Drumcondra have the same tax rate as the city due to annexation. ***[CITY]=Relevant part of the city; [AT]=Annexed townships; [IT]=independent township.
Sources: Irish censuses reports for Panels (a), (c), and (d). Panel (b) from Parliamentary Papers c. 2827, p. 4, c. 7795, p. 56, and cd. 5091.

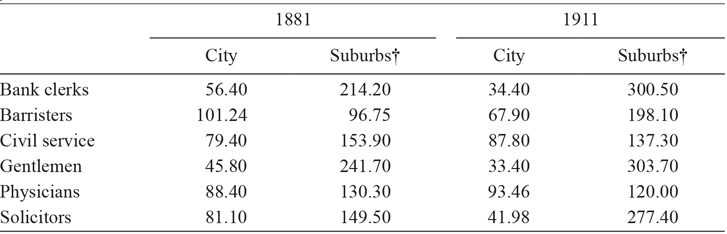
There was also a drastic change in the city’s occupational structure relative to the suburbs (see Table 1). According to the aggregate census data, in 1891, the suburban districts had 40.2 percent of their population in professional- and middle-class occupations, while Dublin only had 22.5 percent. Table 1 presents an index for the representation of different professional classes in the city as compared to the suburbs in 1881 and 1911 and shows that the suburbs were generally becoming wealthier, while the city was experiencing the opposite (Daly Reference Daly1984, p. 146).
INDEX OF PROFESSIONAL OCCUPATIONS

Notes: †Suburbs include, Blackrock, Clonliffe, Clontarf, Drumcondra, Glasnevin, Glasthule, Kilmainham, Kingstown, Pembroke, Rathgar, and Rathmines. Clontarf and Drumcondra are part of the city in 1911.
Source: Daly (Reference Daly1984, p. 146).
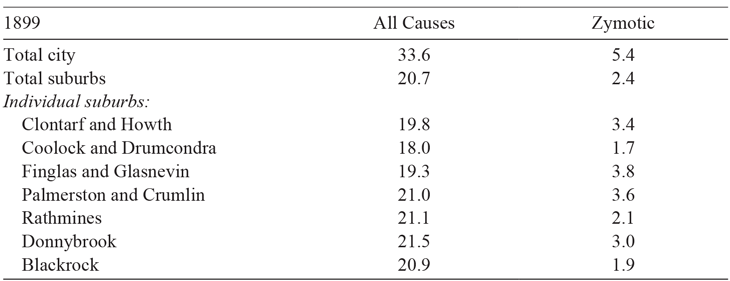
Worsening public health provisions further exacerbated these trends. With the lack of a main drainage system and the overcrowding of the poor in the tenement slums spreading throughout the city, disease was a serious issue. Table 2 illustrates this by showing high mortality in the city due to zymotic diseases that were thought to be particularly associated with poverty at that time (33.6 per mille, compared with lower proportions in all suburbs—as documented in The Housing Report of 1914, PP cd.7317).
DIFFERENTIAL MORTALITY RATES

Notes: Deaths per 1,000 living in population. The table also compares mortality rates due to “zymotic diseases,” which were thought to be particularly associated with poverty at that time.
Source: PP cd.243.
Political Control and Taxation
Over the second half of the nineteenth century, culminating with The Local Government Act of 1898, there was an immense structural transformation occurring at the local government level in Ireland, shifting the balance of power and politics in Dublin. Changes were occurring on multiple levels. New legislation gave Dublin Corporation a wider scope of responsibilities and powers, particularly in taxation and spending (O’Brien Reference O’Brien1982, p. 74). Additionally, the right to vote and to hold office was extended to many citizens, previously prohibited, transforming party politics within the Council. By 1898, property qualifications were fully removed from the regulations for holding office and the municipal franchise was democratized—widening to 38,000 electors versus the mere 8,000 allowed to vote prior.Footnote 4 Accordingly, Dublin Corporation became increasingly Nationalist (used interchangeably with Catholic from here forward), and, parallel to this, control was being handed over to the “small ratepayers” (Pim Reference Pim1875, p. 114)—the so-called “petty business classes” (Daly Reference Daly1984, p. 207). By 1898, Unionist (used interchangeably with Protestant from here forward) representation had shrunk to a mere 11 representatives (out of more than 60).Footnote 5 It was a dramatic shift from the turn of the nineteenth century when Catholics (and those with marginal wealth) were not permitted to stand in an election, and even as late as 1840, when members of the city council continued to be exclusively Protestant in religion and in favor of the Union (O’Brien Reference O’Brien1982, p. 35).
Accordingly, the townships surrounding Dublin held a Unionist majority. Daly (Reference Daly1984) writes “Like Rathmines, Clontarf retained its strong Unionist complexion until the early twentieth century.” “The prosperous Protestant upper-class, rather than fight this issue in the cockpit of municipal politics withdrew to their comfortable suburbs where they pursued separate interests and separate development” (Daly Reference Daly1984, p. 17).
Wealthy and Protestant residents likely held contrasting values to the new Dublin Corporation on taxation and provision of local public goods (O’Brien Reference O’Brien1982). In 1874, Dublin’s property tax was 45 percent, whereas it was much lower in the suburbs (e.g., 23 percent and 20 percent in Clontarf and Rathmines, respectively, as shown by (Daly Reference Daly1984, p. 227)).Footnote 6
After 1900, city taxation was consistently above 50 percent. Figure 1(b) illustrates the total taxes in the city versus the suburbs in 1891 and 1911. We observe a sizable rise in the tax rates of Clontarf and Drumcondra after their annexation, and to a lesser extent in the independent Rathmines, between the two time periods. High property tax rates affected mostly owners of large properties (wealthy residents).
The way that taxes were spent is another important determinant of the decision of certain households to move. Possibly, this affected the decision of Protestants more as, potentially, they saw this as part of the lost political control (both O’Brien (Reference O’Brien1982) and Daly (Reference Daly1984) make this point). The annual expenditure on the relief of the poor in Dublin had become unsustainable, presenting an enormous burden on taxpayers (O’Brien Reference O’Brien1982, p. 74).Footnote 7 Along with the high cost of maintaining Dublin’s poor houses, the city also bore a disproportionate burden in terms of hospitals (including morgues and disinfecting chambers), alms-houses, policing, fire brigade, schooling, and improvement of tenements and thoroughfare roads (The Housing Report of 1914, PP c.2827). Taxes would only cover some of the excess costs faced by the Dublin Corporation, partly because not all users of public services contributed to taxation.Footnote 8 Borrowing covered the deficit, leading to the extreme indebtedness of Dublin Corporation, with a debt (£1,399,655) to revenue (£410,009) ratio of 3.41 in 1894 (PP 7795). The annexation reduced the debt (£1,876,987) to revenue (£655,395) ratio to 2.86 in 1901 (2.88 in 1904).Footnote 9
The Annexation of 1901
In response to the worsening of its finances and accumulation of debt, but also to correct the inequity of free-riding on public services by suburban residents (O’Brien Reference O’Brien1982, p. 82), in the latter half of the nineteenth century, Dublin Corporation initiated a movement to annex the surrounding townships into the city. The proposed legislation was expected to add 80,000, mainly middle-class, residents (around 30 percent of Dublin’s population) to the city and £350,000 to its valuation in taxable property—an increase of 50 percent. Not only did it mean an enlargement in the tax base for Dublin, but with expanded collateral, the city’s borrowing power would also be enhanced.
Township residents adamantly protested the possibility of annexation. They had a sense of independence and hostility toward the city and its administration.Footnote 10 A letter from township commissioners to the Lord Lieutenant defended their autonomy (Chief Secretary’s Office Registered Papers, 1885, no. 7695):
It would be neither just nor politic that the Government should take up and lend their powerful assistance to pass a bill of compulsory annexation which necessarily would prove an Act of spoilation and subjection of a township … which has always been loyal and law-abiding and thus assist in furthering the designs of a body such as the Corporation of Dublin, the majority of whose members have so recently done all they could dare venture, to parade their disloyalty to the Crown and Constitution.
Rathmines and Drumcondra provide a useful case study on public opinion, as only the latter was eventually annexed. Circulars were sent out by township commissioners to gauge opinion on annexation. In Rathmines, 90 percent of residents were against amalgamation and the objection was even more marked in Drumcondra (PP c.2827, p. 19).
In 1900, legislation was laid down in The Dublin Corporation Act for the annexation of the highly professional and Protestant northern townships of Clontarf, Drumcondra, and Glasnevin, and the area west of the city known as Kilmainham. The Act was given Royal Assent in August of 1900 and took effect on 15 January 1901. At the last moment, the southern townships of Rathmines and Pembroke managed to be excluded from this act and were not annexed to Dublin until 1930.
The reasons why Rathmines and Pembroke were able to retain their independence differed between the two townships. Rathmines had low property tax rates, reduced public services, and a low-quality water scheme. The township commissioners saw the initial offer of accessing the River Vartry water by Dublin Corporation as too expensive and opted for polluted and low-pressure water from the canals. However, even when Dublin Corporation offered access to Vartry water at favorable rates, the commissioners rejected the offer for lower quality water from the river Dodder. Behind these decisions was the fear that accepting the deal with Dublin Corporation would have meant losing independence. The fact that the township maintained a majority of Protestants—many having escaped the city due to hostility toward Catholicism and Nationalism—played a pivotal role in this decision. Pembroke had a different structure. The Earl of Pembroke owned most of the township but did not reside there. The policies implemented were often favorable to his properties, but he would pay them back with generous financial benefits. The township faced a large number of sanitation problems. Upon pressure from its residents, it responded by agreeing to use Vartry’s water from the Dublin Corporation and increasing sanitation expenditure in the city, while remaining independent from the city. The township opted not to raise its property rates but, instead, to accumulate debt, eventually guaranteed by the Earl and wealthy residents. The debt accumulated made it less appealing to the city, and the presence of control by wealthy Unionists meant it preferred to retain its independence (for further details, see Daly (Reference Daly1984)).
The boundary extension occurred in the same year as the enumeration of the 1901 census. Its passing was quite unexpected, as numerous bills had been brought to the table over the previous 20 years and failed (Irish Times, 18 January 1900). It is possible that some residents, anticipating that their taxes would go up, would have moved before the taking of the census. However, equally, it is also likely that many did not foresee the annexation. In fact, in 1898, just two years before its passing, a similar annexation bill was taken before Parliament at great expense, with no success (Irish Times, 4 January 1900). In 1900, The Irish Times wrote that the passing of the Dublin Corporation Boundaries Bill at any time in the future was an “improbable event” (18 January 1900).
People living in the annexed townships had to pay more than double the tax rate that they had paid just before the annexation to a municipal government that they had not chosen to live under. As can be seen in Figure 1(b), over the years before annexation, those townships that were eventually annexed paid, on average, approximately the same amount in taxes as those townships that were to remain independent. It can also be seen in this figure that taxes went up in all areas around the turn of the twentieth century, which was largely the result of a need for funding for the elaborate infrastructural projects (mainly drainage) that were taking place at the time. However, rates went up much more dramatically for the annexed townships than for other areas, and these annexed areas were now paying taxes to fund the local public goods of a government that they did not elect to live under.
Many of the larger property owners had threatened to leave as the result of a successful annexation (Irish Times, 11 July 1899). Aggregate statistics on the townships that became part of the city indicate that certain groups of residents may have been “voting with their feet” against living under the imposed municipal jurisdiction of Dublin. Figure 1(c) shows that there was a larger percentage drop in the number of Protestants in the annexed townships between 1891 and 1911 than in those townships that remained independent. Finally, Figure 1(d) offers an indication of the relocation of wealth (proxied by the percentage of workers in top jobs), showing that the suburbs of Clontarf and Drumcondra became poorer, while minimal variation took place in Rathmines (and the city).Footnote 11
THE THEORETICAL AND EMPIRICAL FRAMEWORK
A model of an urban economy where residents can vote with their feet makes the following predictions: Because of the lost control of the redistribution of taxes, Protestant residents will be more likely to leave the townships after the annexation than the township that remained independent. Additionally, because of the increased property tax rate, wealthy residents will be more likely to leave the township after the annexation. In Online Appendix A, we elaborate on this intuition using a consumer locational equilibrium model.
This framework leads us to the following two conjectures.
Conjecture 1 Before the annexation, households residing in [AT] and [IT] are expected to be more similar to one another than to [CITY] households, as the taxation level and expenditure policies that they faced were more similar.
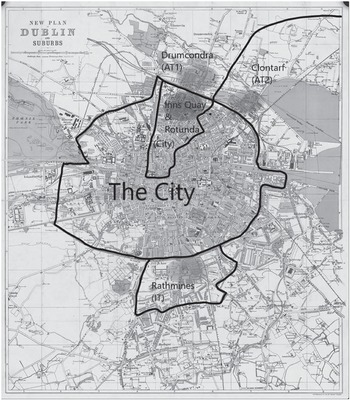
Conjecture 1 argues that before the annexation, the two suburban areas in our sample (even if they happen to be on opposite sides of the city, as shown by the three circles outside the border of the city in Figure 2) are more like one another than the city that immediately borders them. Later, we investigate this conjecture with appropriate descriptive statistics and then support it with a multinomial logit estimation aimed at comparing the initial residential composition between the area pairs [AT] and [CITY], and then [AT] and [IT], respectively.
MAP OF DUBLIN AND ENVIRONS 1900
Notes: The original boundary of Dublin is represented by the circular ring (roughly following the canals) around the concentrated center. Both the annexed and the independent townships are located just outside of that ring. The ellipses represent the approximate areas of the sample.
Source: From the American Geographical Society Library, University of Wisconsin-Milwaukee Libraries. Reprinted with permission.

Conjecture 2 Post annexation, the characteristics of the outflow of residents will differ from the inflow in [AT] but not in [IT]. [CITY] compared with [IT] may also differ but that is less clear.
The idea conveyed in Conjecture 2 is that, without the annexation in the area of interest [AT], any outflow of certain types of households would have been offset by an inflow of similar types, as the preferences for the area would not be expected to change much. Empirically, we study this by comparing the characteristics of the residents who move out with those who move into the annexed townships and juxtapose them with areas where there was no change in government. The theoretical framework suggests that wealthy residents and Protestant residents will leave the annexed area because of the increase in taxation and the loss of control of expenditure policies. On the other hand, the incoming residents who replace them are less likely to be averse to the new local government and its policies (in other words, they are more likely to be poorer residents and Catholic residents).
An aspect not included in Conjecture 2 is where departing households relocate to. The intuition behind our theoretical framework suggests that the area that remained independent is more likely to absorb these households. By generalizing the concept of neighborhood, we can state that, in a closed economy, households departing the annexed area will relocate to areas that are more similar pre-annexation. Our data do not allow us to directly test this claim empirically,Footnote 12 since it only includes three geographical areas (of the many possible areas households could have chosen to migrate to).
DATA
Sources and Sample
The effect of the Dublin annexation took hold between the only two years, 1901 and 1911, for which the records of the Irish Census are available to the public in their entirety.Footnote 13 We employ the returns of these Irish censuses to construct a sample of household-level data for houses located in three distinct areas of Dublin, corresponding to those defined earlier and described later.Footnote 14 We select sample locations based on their distance from the original border of the city of Dublin. We focus on households near the boundaries of our areas of interest to minimize confounding factors. The sample streets and houses meet the criterion of being in existence (fully built-up) in both the 1901 and 1911 censuses. For each year, we collected data on households residing in houses on the edge of the Inns Quay and Rotunda wards of Dublin, which had long been a part of the municipality but which are near the city/suburbs border [CITY]; houses in a location bordering the city in Rathmines, a township just south of the border of Dublin that was not annexed in 1901 ([IT]), and houses in another location bordering the city in Drumcondra and Clontarf, two townships north of the border of Dublin that were annexed in 1901 ([AT]). See Online Appendix B for a more detailed discussion. So, for the selected wards, only streets either bordering or near the border with the city have been chosen to be part of the dataset. These streets represent 16–23 percent of the population of the wards in which they are in and, for these streets, we have information on all households.
The Dublin metropolitan map in Figure 2 shows where the areas described are physically located. Ideally, we would have liked to compare annexed versus non-annexed townships that were physically next to one another, but due to the geography of Dublin, and the fact that only those townships to the north (Clontarf, Drumcondra, Glasnevin) and west of the city (Kilmainham) were annexed, this was not possible.Footnote 15 As mentioned, all samples examined are directly next to the jurisdictional boundary of Dublin. Homes on the fringe of the Dublin metropolitan border were generally built in a single era (the mid-to late-nineteenth century) and, as such, would have experienced an equal rate of natural decay. Moreover, all areas had similar modes of transportation in place for the period studied: by the 1870s Rathmines, Drumcondra, and Clontarf had horse-drawn tramlines along their main streets leading towards the city center of Dublin (Corcoran Reference Corcoran2000). The regulated charge for a single trip from the city center to these townships was equally one shilling (Craft Reference Craft1970).
For each household in the dataset, we determine whether it is a “stayer,” a “mover-out,” or a “mover-in” by manually finding the corresponding houses and the residing individuals across the 1901 and 1911 censuses. A household is a stayer if at least one family member lives on the same street in both census years (first, middle, and last name, and age match). It is a mover-out if all family members are only on that street in 1901 and a mover-in if all family members are only on that street in 1911 (see Online Appendix C for a more detailed description of this process, including how we addressed the difficulties such as handwritten returns and varying house numbers).Footnote 16
The individual returns of the census contain detailed information on each member of the household. For this, we can extract the following variables: religion, occupation, birthplace, age, number of children under 14, number of children 14 and over, and number of non-family members living in the household. These can be thought of as potential control variables for residential choice. The birthplace variable is aggregated into six categories based upon whether the individual is originally from Dublin City, County Dublin, another area of Leinster (the province in which Dublin is located), wider Ireland, the United Kingdom, or outside the British Isles. For additional members of the household, we divide the number of children into two age groups (0–14 and >14) based on the view that families with school-age children are bound to behave differently than those with working-age children when making a residential choice.Footnote 17 We have also included count indicators for the number of non-family members living in the household, further broken down by whether they are boarders or servants.
For the occupation variable, we first combine similar occupations (some individuals gave elaborate job descriptions on their Census return form) into job titles that could be coded under the “HISCO” (Historical International Standard Coding of Occupations) classification scheme (Van Leeuwen, Maas, and Miles Reference Van Leeuwen, Maas and Miles2002). We convert this classification into a proxy for income using the HIS-CAM scale, producing values that range from 30 to 100 with a standard deviation of 14.71 (in shorthand, we refer to this variable as income). See Online Appendix D for details.
Finally, housing prices have been collected from Thom’s Irish Almanac & Official Directory.Footnote 18 We have consulted the 1892 and 1912 yearbooks due to their proximity to the periods of interest and their online availability.Footnote 19 We utilized the Street Directory portion of the publication, with information on street and house numbers, and most importantly, the “rateable valuation” of the property, which represents a proxy of the market value of each property, net of property tax.
Descriptive Statistics
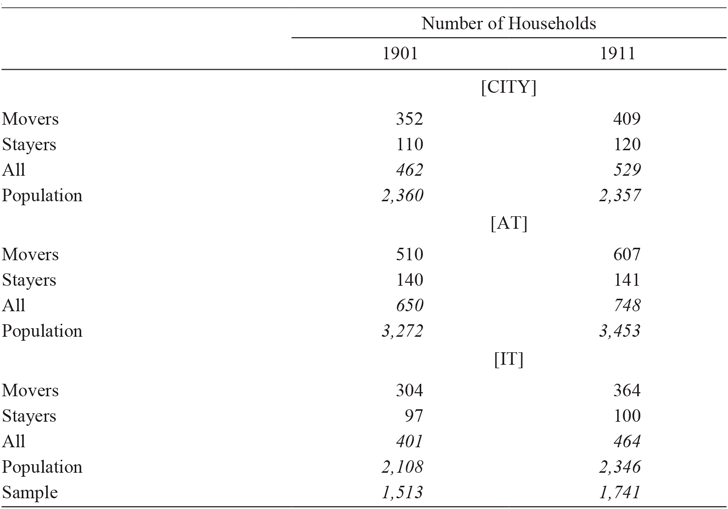
Our sample consists of 3,257 households over two time periods, 1901 and 1911, with a total of 15,896 individuals. Table 3 indicates that for 1901, there are 1,516 households in the entire sample, and for 1911, this figure rises to 1,741. As mentioned, in the census data, all houses were observed each year. The increase in households across census years is put down to the fact that more houses were empty in 1901 and that houses were more likely to contain more than one household in 1911.
SAMPLE SIZE OF STAYERS AND MOVERS BY LOCATION

Notes: Movers are implicitly outward movers in 1901 and inward movers in 1911. The lack of correspondence between stayers in two periods is often due to a missing head of household in 1901 and a young member of the family becoming head of household in 1911. This table counts the households based on the number of head of households.
Source: Authors’ calculations.
We have been able to collect aggregate information from census returns and analyses by social historians to test how representative our sample is of the population. Figure 1 (discussed earlier) presents aggregate statistics in four charts showing differences between the three areas of interest in terms of population, taxation, religion, and an indicator of wealth—before and after the annexation. For the religion variable, we test the mean of our sample against the mean of the census return (using a t-test of difference in means) and find that they are representative of the population, except for Inns Quay in period one and Drumcondra in both periods. In these three exceptions, Protestants are over-sampled.
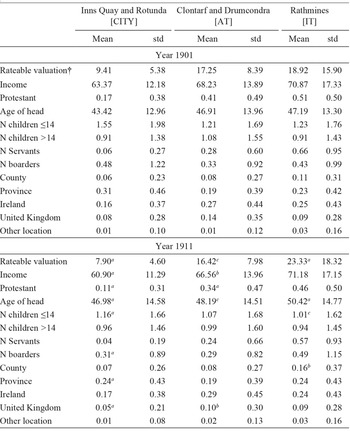
The top panel of Table 4 provides a comparison of statistics showing how the areas differed before the annexation. The t-tests for the difference in means are reported in the notes of the table.Footnote 20 We observe that [AT] and [IT] are more similar to one another than to [CITY] before the annexation. This is true in terms of religion, rental prices, and income. [AT] and [IT] are more similar in terms of religion before the annexation, with comparable proportions of their populations reporting as Protestant at 0.41 and 0.51, respectively. Though this difference is statistically different from zero (t-stat 2.95); its significance is well below that of the difference between the two townships and [CITY], where the proportion of Protestants is 0.17, with t-stats exceeding nine. The message from comparing the rental prices (rateable valuation) is much the same, the only difference being that the t-stat of the difference in means between [AT] and [IT] is not significant. Finally, when it comes to income, the difference in average HISCAM, 68.23 in [AT], versus 71.03 in [IT], is well below the difference in average HISCAM, when comparing with 63.37 in [CITY]. For income too, there is a smaller statistical difference between the townships (t-stat 2.53) than there is between the townships and [CITY], where the t-stats are above 6.5. Overall, we find evidence supporting Conjecture 1: The annexed townships [AT] and the independent township [IT] are more similar to one another than to the city [CITY].
SAMPLE SUMMARY STATISTICS BY AREA

Notes: Bottom panel (Year 1911) includes whether there is significance difference between means in year 1901 and year 1911.
a p<0.01, b p<0.05, c p<0.1. †Accessing 1892 rather than 1901 Thom’s Directory has the disadvantage of creating missing values in 1901. This was particularly the case for Rathmines since four of the streets were built between 1892 and 1901, causing about 200 missing values, which may explain the significant difference in rateable valuation between the two time periods for Rathmines. T-stats of difference in means for the year 1901 (the order is the same of the coefficients in the table, the first is rateable valuation, the second is income, …): ([AT]-[CITY]: 18.14, 6.54, 9.33, 4.21, –3.04, 1.94, 8.67, –2.27, 1.19, –4.56, 3.93, 3.16, 0.33); ([IT]-[CITY]: 8.76, 7.51, 11.02, 4.22, –2.60, 0.10, 12.38, –0.69, 2.69, –2.53, 3.04, 0.26, 1.72); ([IT]-[AT]: 1.51, 2.53, 2.95, 0.41, 0.14, –1.72, 7.08, 1.66, 1.76, 1.69, –0.43, –2.76, 1.50).
Source: Authors’ calculations.
Comparing the top and bottom panels of Table 4 show how the areas changed over time. We observe that heads of households are becoming older, and there are fewer young children, a lower number of servants, and—for most of the locations—fewer boarders. For the religion variable, the proportion reported as Protestant in the annexed townships drops from 0.41 to 0.34 after the annexation, and is highly significant. There is also a decline in the Protestant group between the two periods in the independent township, but it is not statistically significant. As for the other variable of interest, income, we observe that in the annexed townships (and the city), income drops significantly, while it rises (though not significantly) in the independent townships.
Here the statistics are supportive of Conjecture 2: The annexed townships became less wealthy and less Protestant after the annexation, while the independent township remained relatively stable.
MULTINOMIAL LOGIT AND PROBIT RESULTS
The goals of this section are to further verify the two conjectures using a multivariate approach.
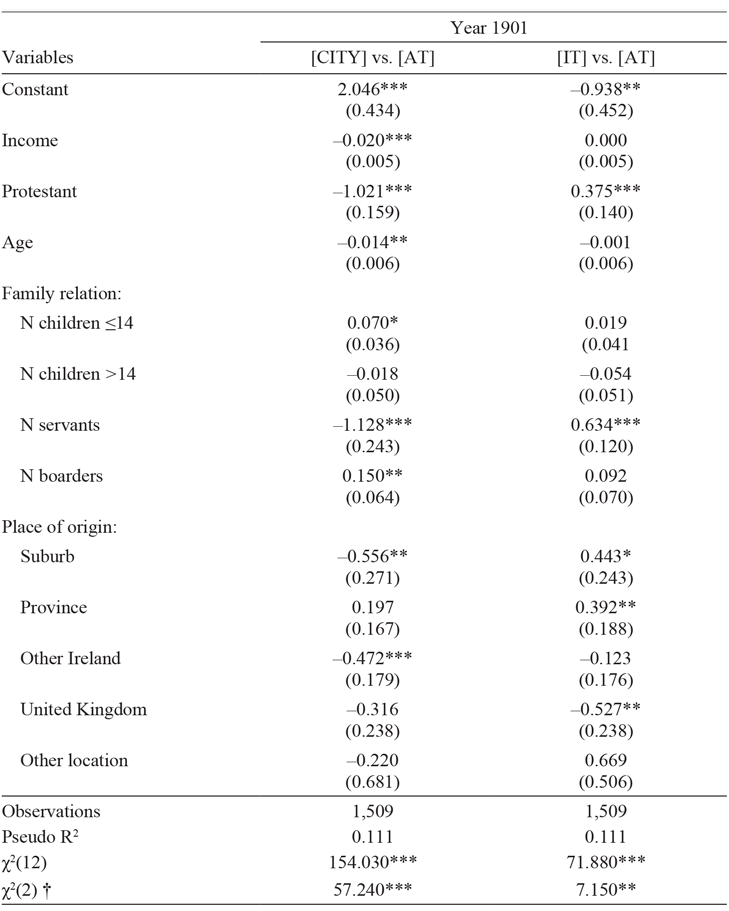
We first verify Conjecture 1 with a multinomial logit estimation where the annexed townships (the reference category) are compared against the other two areas. This methodology is preferred to a simple difference in means of characteristics as it allows us to draw an overall conclusion on the joint effect of the variables of interest. It provides a unique statistic from which to draw conclusions on Conjecture 1 after controlling for various covariates of interest. The results are reported in Table 5. The first column of the table compares [CITY] to [AT]; the second column compares [IT] to [AT]. Replication files for these and the following results are available from Berger, Mariuzzo and Ormosi (2022).
MULTINOMIAL LOGIT ESTIMATION (REFERENCE OUTCOME IS [AT])

Notes: Robust standard errors in parentheses. ***p<0.01, **p<0.05, *p<0.1. † Joint test coefficients of income and Protestant are zero.
Source: Authors’ estimates.
The point estimates in Table 5 show that before the annexation, differences existed on more levels between [CITY] and [AT] than between [IT] and [AT]. Households in the city are in lower-paying occupations than those in the annexed townships on average, while income levels are not statistically different between the independent and annexed townships. Significant differences also exist between [CITY] and [AT] with regards to the age of the head of household (younger in the city); the number of children aged 14 and under (more in the city); the number of boarders (more in the city); and the number of household heads born in the suburbs and greater Ireland (less in the city). No significant differences exist between [IT] and [AT] for the aforementioned variables. However, both [CITY] and [IT] differ from [AT] with regard to religious composition. Households in [CITY] are less likely to be Protestant than those in [AT], while households in [IT] are more likely. Compared with [AT], households in [CITY] have fewer servants, while households in [IT] have more.
We judge the overall similarities of the alternative locations based on the value of the Wald test for the joint significance of the coefficients. As can be seen from the bottom of the table, the results are supportive of Conjecture 1, with the Wald test statistic being higher in the first column than in the second: Households in the two township locations, [AT] and [IT], do have more similar preferences to one another before the annexation shock than do households in areas [AT] and [CITY]. This result is in line with the city/suburbs model discussed in Reference BruecknerBrueckner (Reference Brueckner2011), as the townships are more similar to one another than to the proximate city, even though they themselves are not geographically close. Later on, we discuss how to refine this group using propensity score matching.
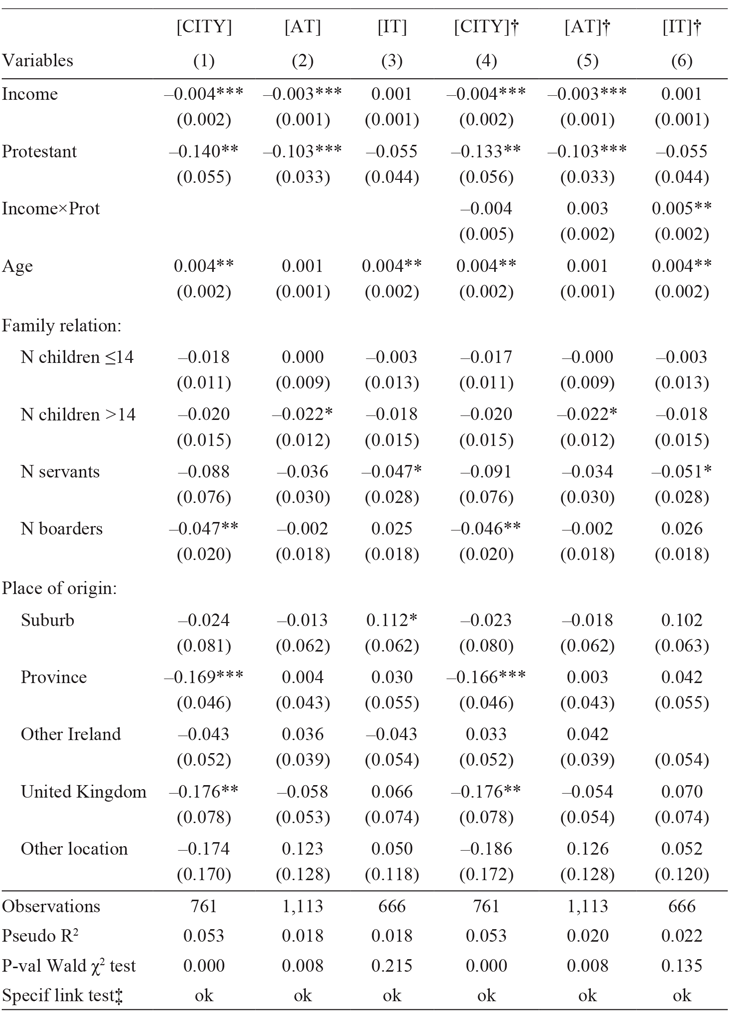
In Table 6, we present the marginal effects of a probit model for the three areas of interest. We define the binary dependent variable to be one if a household moves in, and zero if a household moves out between the two periods. The subsample of households that stayed in both periods, in other words, the panel component, is not included in this regression. By comparing households that leave with those that move in, we focus on the turnover of types of households.
PROBIT ESTIMATION MARGINAL EFFECTS (1 = FAMILY MOVED IN, 0 = FAMILY MOVED OUT)

Notes: Robust standard errors in parentheses. ***p<0.01, **p<0.05, *p<0.1. †The partial effect and standard error of Income, Protestant and Income×Protestant have been computed manually. ‡“ok” means that the model is correctly specified: Prediction is significant and prediction squared is not (linktest in Stata).
Source: Authors’ estimates.
Columns (1)–(3) show the results for each of our three main areas [CITY, AT, IT]. The coefficients of income and Protestant are not significant for [IT], while they are significant and negative for [AT] (and [CITY]). This result confirms Conjecture 2: In the annexed area (but also in the city), wealthy residents and Protestant residents are more likely to be replaced by less wealthy residents and non-Protestant (Catholic) residents. We also note that the regression for [IT] is not significant overall, as can be seen via the magnitude of the Wald test p-value. This suggests that in the non-annexed area, households are, on average, replaced by households with similar (observable) characteristics. For [AT], the Wald statistic is rejected, suggesting a change in the composition of households in the annexed area. Income and religion contribute to this. These estimates do not show where wealthy residents and Protestant residents relocate to. Using the coefficients from Column (2) of Table 6 for [AT], we can work out the marginal effect of income (fixing all variables at their mean value, including religion). A representative Protestant household has about a 10 percent higher probability of leaving the area (versus entering) relative to a representative Catholic household. Looking beyond the averages, Online Appendix Table E.1 shows that rich Protestants are about 20 percent more likely to leave the area than poor Catholics.Footnote 21 Furthermore, both rich Catholics and poor Protestants are around 10 percent more likely to leave than a poor Catholic household. These results, along with the result of no significant effect of income and religion on [IT], verify the main conjecture of this paper. Wealthy residents and Protestant residents in annexed locations did “vote with their feet” against the Dublin Corporation.
To look into the further effects of the annexation, we conducted a set of Monte Carlo simulations, which are presented in detail in Online Appendix F. The idea of these simulations is to demonstrate how income distribution changed in the relevant areas between 1901 and 1921. As such, the credibility of these findings hinges on the assumption that the model estimated using data from the first decade of the twentieth century can be extrapolated to the period 1911–21. This latter decade was a tumultuous time in the history of Dublin, with events (the 1913 Lockout, the 1916 Rising, and the 1919–21 War of Independence) likely to have further exacerbated the exodus of wealthy residents and Protestant residents from [CITY]. As we do not control for the effect of these events (simply due to the lack of data), our simulation results provide an understanding of the level of the exodus that would have taken place without the events of 1911–21. Consequently, these findings can be thought of as a lower bound on the changes in the composition of the resident population.
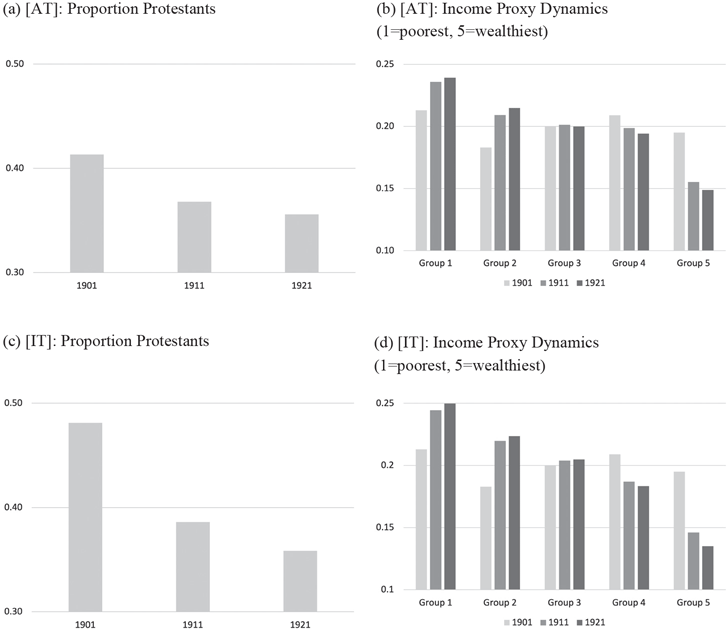
There is a noticeable religion effect: The likelihood that a Protestant family relocates to [AT] is more than 12 percent lower than for Catholic households, all else equal. Figure 3(a), shows, for [AT] that between 1901 and 1921 the population of Protestants in the area would drop by 5 percentage points due to their exodus. Figure 3(b) shows, for [AT], the predicted changes for five quintiles of income. The model predicts that between 1901 and 1921, the very richest part of the population drastically reduces its presence in the [AT], whereas the poorest group and second poorest group increase their shares by about 4 percentage points each. This is evidence that the annexed area became poorer and more Catholic, arguably due to the effect of preferences over local government politics (taxation and expenditures).
SIMULATED DYNAMICS (DECADES 1901, 1911, AND 1921)
Source: Authors’ simulations.

Moving on to our regression results for [CITY] (Table 6, Column (1)), the effects of income and religion are similar to those discussed for [AT].Footnote 22 Our interpretation is that the higher taxation, changing political landscape, and impoverishment that had originated in the city years before had not terminated its effect by 1911—the outflow of wealthy residents and Protestant residents continued. The annexed townships have responded to the annexation shock and moved toward the transition that the city was already in, at least in terms of religion and income demographics. Similar to [AT], [CITY] also became older. All else equal, households with boarders, and households originating from Leinster and the United Kingdom outside of Ireland have a reduced likelihood of moving into [CITY]. If we think of boarders as being an alternative indicator of income, these results offer further confirmation that the city was still amid economic decline. The non-significance of boarders for [AT] could be due to households with boarders having the possibility of passing on the increase in taxation (or part of it) to the boarders, and therefore being less exposed to a sudden increase in taxation. The fact that non-Irish were choosing to move away from central Dublin fits well with the story that those loyal to the Crown were put off by the increasing nationalism of the Dublin Corporation.
An interesting question that we have yet to address is whether or not wealthier Protestants have distinct preferences over local government, which would lead them to react differently to the annexation than other residents. So far, we have seen the effect of income on a given religion, and the effect of religion on a given income. With an interaction term between income and religion, we allow for the effect of religion on the area turnover to vary by income. The marginal effects are displayed in Columns (4)–(6) of Table 6. For [AT] the interaction term is not significant, and the results of the regression remain unchanged from those described earlier.Footnote 23 On average, the annexation had not motivated Protestant residents who were wealthier to exit (relatively to moving in) from [AT] more than Protestant residents who were not as well-off financially. Another way of interpreting this finding is that wealthy Catholics were just as likely to leave [AT] and [CITY] as wealthy Protestants.
Focusing on the marginal effects of [IT], we find evidence that wealthier Protestants were moving into the area that remained independent from Dublin, which fits well with the background story that the “Protestant Ascendency” preferred the political autonomy offered by the suburbs. It is not surprising that this became more apparent for the still independent township in the period after the annexation, when alternatives were limited.
It is also interesting to consider what the estimated preferences against the municipal government of the city of Dublin imply about the evolution of the different areas over the decades following the annexation. More specifically: What would have happened to [IT] had it been annexed to the city, as was proposed in the original Bill of 1900? Would wealthy residents and Protestant residents have “moved out to the Dublin mountains (just south of Dublin) and left the townships to the commonality,” as suggested by an opinion column published in the Irish Times (4 August 1900), amongst many other sources?
To answer this question, we return to simulations. It can be seen in Figure 3(c) that [IT] started with a higher proportion of Protestants than [AT] (Panel (a)) and had they been annexed that proportion would have dropped off at a much quicker rate than occurred in the annexed townships. As for income (Figure 3(d)), the wealthiest group would have dropped dramatically, to an even greater extent than the annexed townships. For the other income groups, the pattern is much similar to the annexed townships.
SENSITIVITY CHECKS
Drumcondra versus Clontarf
So far, we have included houses from two of the annexed townships, Drumcondra and Clontarf, grouped to comprise the annexed townships. Each of these two areas was first established as townships in the same ten-year period (1869–1879); Dublin was immediately accessible to them both, as each bordered the city to the north, and each paid a virtually equivalent rate of taxation. Still, since the two areas are geographically and jurisdictionally distinct, we also ran an alternative analysis with Drumcondra and Clontarf as separate entities, to assess whether residential behavior varies across the annexed area (see Online Appendix B for a more detailed discussion). We decompose the annexed townships into [AT1] (Drumcondra) and [AT2] (Clontarf).
The results, displayed in Online Appendix Table B.1, show that said effects are much stronger for the residents of Drumcondra, and on its own, there is no effect of income and religion for Clontarf.
In researching potential explanations for these findings, we find that the two incorporated areas are quite distinct in a major respect. Many of the residents of Clontarf had petitioned for annexation, while every other township was emphatically against it. The Report of the Royal Commission on Municipal Boundaries, published in 1881, provides a telling story of Clontarf’s plight for inclusion in the proposed boundary extension. The report details the investigation by the Commission, in which the Dublin Corporation made it clear that they did not wish to invite Clontarf to join the city. The Clontarf Township Commissioners were themselves against annexation; it was the ratepayers who supported joining the city of Dublin. During the debate, the Commission received a petition from a large number of Clontarf ratepayers. Over 400 people, representing one-fifth of the rateable valuation of the township, stated that they wished to be brought in.Footnote 24 The reason for this support for the annexation simply came down to necessity: despite the prognosis of higher taxation, the public services gained from amalgamating Clontarf with Dublin outweighed its cost. Moreover, historically, Clontarf was associated with poor quality of air/water, prostitution, and polluting industries. This exercise has proven meaningful as a check on whether different attitudes toward annexation between the annexed townships played a role in determining the effects of annexation. The fact that residents in Drumcondra were averse towards the annexation and not many of those in Clontarf has proven a determinant in the decision of certain types of residents to leave the area. A more elaborate discussion of this result is presented in Online Appendix B.
Movers Relative to Stayers
An alternative way to show evidence of Conjecture 2 is by comparing the households that move-in (move-out) with those that remained in [AT] and [IT]. In this way, movers are compared to stayers, with different types of moves being separated into different regressions. Online Appendix Table E.2 shows the estimates of the separate regressions. The richness of this comparison is that, relatively to the stayers, households that move into [AT] are, all else equal, less likely to be wealthy and Protestant, while this effect does not hold for the area that remained independent. Instead, when we shift the analysis to households that moved out, there is not such a difference in terms of religion and income. This is suggestive that the response to annexation is more apparent in terms of who moves into the area than who moves out of the area. We then add the interaction effect between religion and income to study what happens to wealthy Protestants. The results suggest that wealthy Protestants are more likely to relocate to an area that remained independent.
Matching [AT] and [IT] Households
As an additional robustness check, we study what would have happened if the suburbs, instead of just being more similar to one another than to the city, actually had the same demographics. In other words, we study what would have happened if we had a treatment and control group. Based on the same covariates used in the various regressions, for the initial period we calculate the propensity score where the dependent variable takes value one if the observation is from [AT] and zero if it is from [IT], and retain the observations that share common support based on a 5 and 95 percent interval.Footnote 25 For this subsample, for [AT] and [IT], we rerun the estimates documented in Table 6 and find that the effects of income and religion do not change much (see Online Appendix Table E.3), confirming the robustness of our original results.
The Role of Rental Prices
The theoretical model presented in Online Appendix A shows that rental prices are an important determinant of where to locate. We have so far omitted prices from the analysis because in collecting this data we came across non-random missing values. This is particularly the case for the year 1901 and the area of Rathmines since we proxy for 1901 by using the 1892 Thom’s Directory when some of the properties were still under construction. In this section, we add the observed prices and repeat the regressions reported in Tables 5 and 6. The estimated effects of these new regressions are given in Tables E.4 and E.5 in the Online Appendix. The results are much the same and Conjecture 1 holds even more tightly.
We use Thom’s Directory year 1892 as a proxy for the rateable valuation (net of tax prices) in the year 1901; we use Thom’s Directory year 1912 as a proxy for the year 1911, as these are the closest directories available online. For both periods, we have filled in the values using the Directories if they were listed. For houses that have been divided into sections, we divided the price by the number of sections. For example, if house 3 was valued at £10 and was recorded as divided into houses 3.1 and 3.2 in the 1911 census, we would have divided the registered value by two and valued them as £5 each. If the value for a house is not listed in one Directory but is in the other, we assumed that the value had not changed and replaced the missing information with the available value.
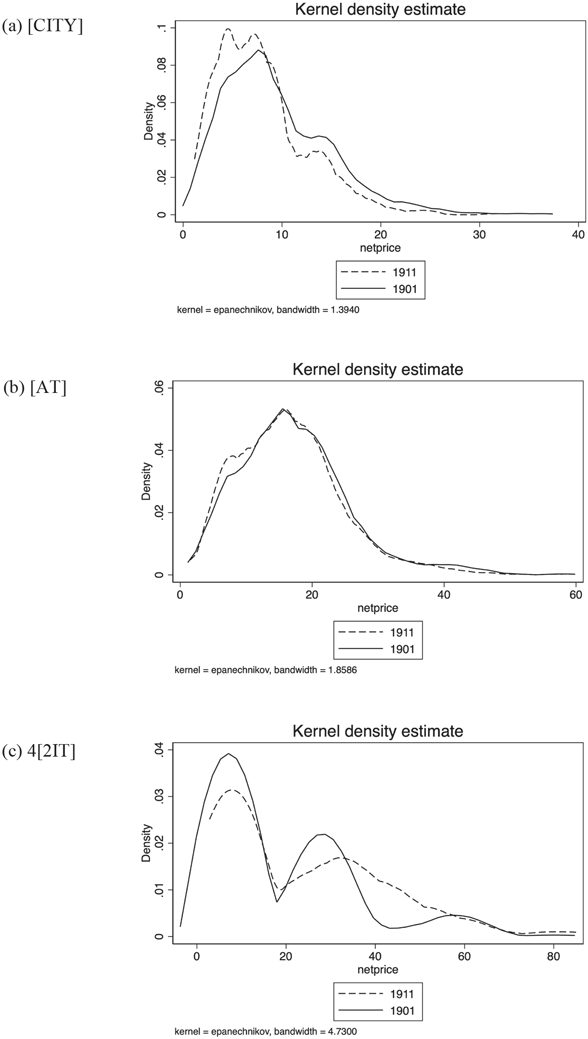
A comparison of the average house price in the three areas in 1892 suggests that prices in the city were far lower than in both the townships to be annexed and the township that remained independent (£9.41 [CITY], £17.25 [AT], and £18.92 [IT]). Also, we observe that the average price dropped in 1912 relative to 1892 in [CITY] (from £9.41 to £7.9) and in [AT] (from £17.25 to £16.42) but rose in [IT] (from £18.92 to £23.33). The positive change in prices in [IT] is what we expected in line with our analysis. However, it must also be considered that new houses were built in the independent township and those may have contributed to the large rise in the rateable valuation. As the use of the 1892 Directory to proxy for 1901 prices meant that some houses in our data set had not yet been developed (particularly in Rathmines), we are unable to directly compare the rateable valuation by street and house number in Rathmines. The only possible comparison is for houses that are inhabited by stayers (as we can assume that they were in the same houses even if the number had changed); for this group of houses, prices have increased from an average of £21.91 in 1892 to £29.43 in 1912, which is quite dramatic. Finally, Figure 4 shows how the empirical distribution of rateable valuation has changed during the two time periods and three areas. [CITY] and [AT] share a similar pattern, while this is not the case for [IT].
RATEABLE VALUATION (NET PRICE) DISTRIBUTION IN 1901 AND 1911 BY AREA
Notes: Kernel density of rateable valuation for houses built in 1892 (proxy for 1901) and 1912 (proxy for 1911) in [CITY], [AT], and [IT].
Source: Authors’ calculation from Thom’s Directory original data.

Disregarding Middle Names in Defining Stayers and Movers
Census data do not have identifiers to match households over time. Additionally, several houses changed numbers between the 1901 and 1911 censuses, making the matching of houses non-reliable. In this situation, we opted to match households using information on household members, the street where they reside, their full name, and their age between the two periods.
As a robustness check on our method of finding corresponding names across the two time periods to identify stayers, we inspect how reliable this technique is by using a shorter version of the name without a middle name (24 percent of the sample has a middle name). Thus, omitting the middle name can, potentially, increase the number of households that we record as stayers. For example, if there was a Mary Frances Delaney age 30 in 1901 on a street, and a Mary Theresa Delaney, age 40 in 1911, on the same street, we would mistakenly record Mary Frances Delaney’s family as stayers. Alternatively, if Mary Frances Delaney reports her full name in one census but only reports Mary Delaney in the other census, then we will have mistakenly recorded her as a mover in/out when she is actually a stayer.
This modified pairing method with no middle names identifies the same stayers apart from one observation. Though this robustness check confirms the number of stayers (and leavers) in our samples, we cannot fully rule out that we may identify as stayers, households with members having the same name and age and living in the same street between the two time periods but being different households. There are very few instances of stayers that have the same name, surname, and age but live in different house numbers between the two periods. Since this feature happens only on certain streets, and because house numbers have changed on some streets between the two periods, our pairing seems to be superior to one where we rely on house numbers being the same between the two time periods.
CONCLUSIONS
The turn of the twentieth century witnessed a substantial change in U.K. cities, as wealthy residents were leaving urban centers and opting for homes in the surrounding suburbs. This movement was particularly pronounced in Dublin.
In 1901, the city of Dublin annexed some of its surrounding townships. We have used the annexation as a shock to empirically verify the claims put forward in the social history literature that Protestants responded to the loss of government control and the wealthy responded to the increase in taxation by leaving the annexed townships. We have compared these residential patterns in the annexed townships to those in a township that remained independent and to the original city. The analysis has shown that before the annexation, the demographic composition of the two areas affected by the annexation was similar to that which remained independent. Following the annexation, wealthy households and Protestant households were more likely to move away from the annexed townships than to move in, while there was no significant effect on the independent township. The Tiebout (Reference Tiebout1956) idea that households “vote with their feet” over local government issues through their decision of where to reside is illustrated by these results.
The finding that the more prominent residents of the city were exiting in this manner brings into question whether or not the annexation, which was supposed to create economic growth for the city of Dublin, may have been detrimental. Along these lines, one can imagine how the structure of Dublin as it stands today may have been partly shaped by past preferences over local government and particularly by the annexation itself. For example, would the north side of the city have been less plagued by the poverty that it experienced in the twentieth century had the annexation not uniquely occurred in that part of town? Similar issues are likely relevant to British cities that were annexed in Victorian times, and a comparative investigation would certainly be worthwhile.
The paper also provided evidence on several related questions. For example, we have found that wealthy residents and Protestant residents were prompted to move away from the annexed townships in reaction to the imposed municipal government. We find empirical evidence that the wealthiest of the Protestant group were more likely to relocate to independent areas than the less well-off Protestants. Anecdotally, we can link this movement to the corresponding departure of wealthy and/or Protestant residents from the annexed areas. This last finding is in line with the story told in social history literature.
Two further outcomes of the study should be highlighted here. Firstly, for the area of the city that we studied, income and religion had an effect similar to that in the annexed townships; wealthier and Protestant households moved away. It is easy to imagine that this city area was still undergoing a residential transition that had been underway since the municipal government of Dublin had begun its facelift from an almost ceremonial Protestant/conservative group of elites to a powerful Nationalist institution. Secondly, for part of the annexed area, the township of Clontarf, we find that wealthy residents and Protestant residents did not “vote with their feet” against the imposed Dublin Corporation, likely due to different preferences for local government amenities.