I. INTRODUCTION
Modeling the structure and the thermodynamics of multicomponent materials presents a number of interesting and exciting scientific challenges. Recently developed multicomponent alloy systems stand in contrast to traditional alloys, which traditionally contain just one or two primary constituent chemical species, with other species present in small concentrations. Current research pays increasing attention to multiprincipal element alloyReference Cantor, Chang, Knight and Vincent1,Reference Yeh, Chen, Lin, Gan, Chin, Shun, Tsau and Chang2 (MPEA) systems containing many chemical species. Special effort is given to complex concentrated alloys,Reference Miracle and Senkov3 in which several elements are present simultaneously in high concentrations. Cases where the elements substitute freely are known as concentrated solid solution alloysReference Gao, Zhang, Gao, Zhang, Ouyang, Widom and Hawk4 (CSSAs), while the specific case where multiple elements are present in high concentration, and they also substitute freely, are termed high-entropy alloysReference Yeh, Chen, Lin, Gan, Chin, Shun, Tsau and Chang2 (HEAs). This review focuses on CSSAs and HEAs.
Stabilization of a single phase through entropy of mixing is a foundational notion of HEAs. The ideal configurational entropy of chemical substitution,
 $${S_{{\rm{chem}}}} = - {k_{\rm{B}}}\sum\limits_\alpha {{x_\alpha }\ln {x_\alpha }} \quad ,$$
is maximized when all elements substitute freely, which inhibits separation into multiple phases. It is also maximized when all lattice sites are equivalent, which tends to favor simple crystal Bravais lattice structures such as face-centered cubic (FCC) and body-centered cubic (BCC) whose primitive cells contain only a single site, or hexagonal close packed (HCP) whose primitive cell contains two equivalent sites. Finally, it is maximized as a function of composition x α when all species are present in equal proportions, i.e., x α = 1/N for N species. In this case, S chem = k B ln N. The greater the number of species, the greater the value of S chem, hence motivating the search for equiatomic or nearly equiatomic compounds with large N.
Despite the increase of S chem for a random solid solution with increasing N, thermodynamic stability depends on minimizing the Gibbs free energy,
 $$G\left( {N,P,T;\;{\bf{x}}} \right) = H - TS\quad ,$$
with H the enthalpy. As the number of constituents grows, the range of pairwise chemical interaction strengths tends to grow. It may turn out that associating groups of strongly interacting chemical species to reduce H minimizes the free energy more effectively than maximizing the entropy does, leading to phase separation. Thus taking N large may be a counterproductive strategy for seeking thermodynamic stability.Reference Senkov, Miller, Miracle and Woodward5 Owing to the factor of absolute temperature T multiplying the entropy S, enthalpy always wins out at low temperature. A second effect further diminishes the advantage of taking N large; as the number of species grows, so too does the number of potential competing phases, further reducing the chances of stabilizing a single phase.Reference Widom6
As seen from Eq. (2), to predict the stability of a given alloy system requires calculating both the enthalpy (i.e., the energy at fixed pressure) and the entropy. Accurate calculation of the enthalpy depends on precise understanding of interatomic interactions. While this can be achieved in particular cases using empirical potentials, fitting such potentials becomes increasingly difficult as the number of species grows. Hence a parameter-free first-principles approach is advantageous, and this will be the primary focus of this review. The entropy, also, presents significant challenges. First of all, the total entropy has many contributions,
 $$S = {S_{{\rm{vib}}}} + {S_{{\rm{chem}}}} + {S_{{\rm{elec}}}} + {S_{{\rm{mag}}}} + \cdots \quad ,$$
where each term represents a different physical process and must either be calculated or its neglect must be justified. Expression (1) for S chem is itself only a simplified approximation, based on the assumption of a totally random distribution. In reality, chemical interactions correlate the occupation probabilities of different chemical species on nearby lattice sites. These correlations reduce S chem below the ideal value.
In the following, we first review the basic thermodynamic laws that govern phase stability and phase diagrams. Then, we turn to methods to calculate the energy and enthalpy. Here, our main focus is on the quantum mechanics-based first-principles total energy calculation within the approximation of electronic density functional theory (DFT). However, we do address the use of fitted interaction potentials and also the empirical Miedema energy model. Given an energy calculation method, we still need to provide a structure model to which it will be applied. For disordered solid solutions, we will discuss the coherent potential approximation (CPA), and supercell methods including special quasirandom structures (SQSReference Zunger, Wei, Ferreira and Bernard7).
Methods of statistical mechanics are required to incorporate entropy into the free energy. We will discuss each contribution to Eq. (3) separately and explain in detail how it may be calculated. Then, we will concentrate on the problem of S chem and how to account for nonideal mixing. Here, we will describe the use of cluster expansion approximations to total energy and an alternative method based on direct simulation through a hybrid application of Monte Carlo and molecular dynamics. We discuss, as an aside, the revisions needed in the event of sublattice ordering.
Calculation of Phase Diagrams (CALPHADReference Kaufman and Bernstein8) provides an alternative approach to thermodynamic prediction. Based on the interpolation of empirical thermodynamic functions fitted to existing experimental or first principles-derived data, it is a powerful tool for phase diagram prediction. However, its applicability to HEAs and more general CSSAs depends on the availability of thermodynamic databases that are often incomplete, or the combination of existing databases that are mutually inconsistent. We survey the existing databases for HEAs and address the strategy for augmenting them with first-principles-derived data.
Finally, we give concrete examples of these methods in action, taken from the existing literature. Specifically, we examine applications of the CPA, supercells, database mining, and cluster expansions. Owing to the great interest in HEAs and related compounds, many other booksReference Murty, Yeh and Ranganathan9,Reference Gao, Yeh, Liaw and Zhang10 and review articlesReference Miracle and Senkov3,Reference Miracle11–Reference Ikeda, Grabowski and Koermann16 exist that cover similar topics to this one. This interest is motivated both by their intrinsic fundamental scientific interest and also by their potential applications that exploit their promising mechanicalReference Senkov, Wilks, Scott and Miracle17–Reference Zhang, Stocks, Jin, Lu, Bei, Sales, Wang, Béland, Stoller, Samolyuk, Caro, Caro and Weber20 and other properties.Reference Kurniawan, Perrin, Xu, Keylin and McHenry21–Reference Fan, Wang, Wu, Liu and Lu27
II. THERMODYNAMICS
The centerpiece of alloy thermodynamics is the Gibbs free energy, G(N, P, T; x), which depends on the total number of atoms N, the pressure P, and the temperature T. When more than a single chemical species is present, we must specify the number of atoms of each type, N α = x αN, hence defining the mole fractions x α subject to the constraint ∑x α = 1. We collect the full set of mole fractions {x α} into a single vector x. The space of compositions x is a simplex in N − 1 dimensions: the single point x = 1 for N = 1 the line 0 ≤ x ≤ 1 for N = 2, a triangle for N = 3, etc. As expressed previously in Eq. (2), G can be separated into the enthalpy H = E + PV, with E the energy and V the volume, and an entropic contribution −TS, with S the entropy. For solid materials at atmospheric pressure, the product PV is generally negligible and we may consider the enthalpy as simply the energy of the structure under the condition P = 0. G has a special numerical value related to the chemical potentials μα,
 $$G = \sum\limits_\alpha {{\mu _\alpha }{N_\alpha }} \quad .$$
Under certain circumstances, multiple phases i may be present, each containing the number of atoms N (i) at composition x(i), resulting in free energy  $G\left( {N,P,T;\;{\bf{x}}} \right) = \sum\limits_i {{G^{(i)}}}$ with
 ${G^{(i)}}\left( {{N^{(i)}},P,T;\;{{\bf{x}}^{(i)}}} \right) = \sum\limits_\alpha {{\mu _\alpha }x_\alpha ^{(i)}{N^{(i)}}}$.
In thermal equilibrium, the pressure P, the temperature T, and the individual chemical potentials μα are shared in common among all phases because the equilibrium state minimizes the total free energy, G. Indeed, the total free energy G is obtained as the convex hull of the set of all functions G (i)(N (i), P, T; x(i)) defined over the composition space. Within a single phase, G (i) varies smoothly, and the slope with respect to composition variables  $x_\alpha ^{(i)}$ yields the chemical potential μα. When phases coexist, G varies linearly along the tie-line or tie-plane of common tangency. If all phases had definite stoichiometry, i.e., they exist only at unique compositions x(i), the convex hull G may be easily obtained through the optimization method known as linear programming; the more general case of continuously varying G (i) becomes a nonlinear optimization problem that is more difficult to solve.
From the differential
 $${\rm{d}}G = V{\rm{d}}P - S{\rm{d}}T + \sum\limits_\alpha {{\mu _\alpha }{\rm{d}}{N_{\rm{\alpha }}}} \quad ,$$
we see there are N + 2 free variables. If the system has p phases in equilibrium, p independent Gibbs–Duhem relations of the form
 $$\sum\limits_\alpha {N_\alpha ^{(i)}{\rm{d}}{\mu _\alpha }} = V{\rm{d}}P - S{\rm{d}}T\quad ,$$
must be obeyed. Hence F = N + 2 − p thermodynamic degrees of freedom may be varied while remaining under the condition of phase coexistence. Equivalently at most N + 2 phases may coexist in equilibrium. However, metallurgical experiments are frequently performed at atmospheric pressure, removing one degree of freedom. Hence at any particular chosen temperature (thus removing a second degree of freedom), at most N phases may coexist. At an arbitrarily chosen composition x, concentrated intermetallic systems typically exhibit the maximum number of possible coexisting phases. It is quite rare for an equiatomic multicomponent alloy to exist as a single phase in equilibrium.
When elements combine to form a compound, we define the changes, ∆G, ∆H, and ∆S, as the free energy, enthalpy, and entropy of formation. For example, the free energy of formation is the free energy of the compound minus the composition-weighted average of the pure element free energies. Negative free energy of formation means that it is thermodynamically favorable for the elements to combine and form the compound. Since ∆G differs from G by a linear function of composition, they share the same set of states on their convex hulls, namely the set of thermodynamically stable states.
III. FIRST-PRINCIPLES TOTAL ENERGY
A. DFT
The total energy of a crystal structure is a function of atomic positions and their chemical species. While an explicit form for that function is not known exactly, a variety of computational methods exist to approximate it that we survey here. A suitable starting point, and the most accurate method that is practical to apply, is known as electronic DFTReference Hohenberg and Kohn28. This approach treats the atomic positions as classical variables, describing the structure through a set of positions {Ri} and their atomic numbers Z i. The electrons, in contrast, are treated quantum mechanically, capturing the nature of interatomic bonding and its variation with respect to the individual chemical nature of different atomic species. That is, we apply the Born–Oppenheimer approximation to separate classical (atomic) degrees of freedom from quantum (electronic).
In principle, the electrons are described by a many-body wavefunction obeying antisymmetry under exchange of electron pairs. Each electron is subject to a potential energy of interaction with every other electron and also with every ionic core. In practice that problem cannot be solved for more than a small number of electrons. Instead we replace the exact many-body Schrodinger equation with a set of approximate single-electron Schrodinger equations known as the Kohn–Sham equations.Reference Kohn and Sham29
 $$\left( { - {{{\hbar ^2}} \over {2m}}{\nabla ^2} + {V_{{\rm{eff}}}}\left( {\bi{r}} \right)} \right){\psi _i} = {E_i}{\psi _i}\quad .$$
Here, each electron is subject to an effective potential V eff that includes the Coulomb interaction with the ionic cores, a Hartree potential due to the interaction with the average density of all electrons, and an additional term known as the exchange-correlation potential V XC[ρ(r)] that is a functional of the global electron density ρ(r), whose form must be approximated. Popular choices for V XC include the local density approximation,Reference Perdew and Zunger30 in which the potential at position r depends only on the values of the electron density ρ at that point, and the generalized gradient approximation,Reference Perdew, Burke and Ernzerhof31 in which the potential at r depends both on the value of ρ and on its gradient.
Because V eff depends on the electron density  $\rho \left( {\bi{r}} \right) = \sum\limits_i {{{\left| {{\psi _i}\left( {\bi{r}} \right)} \right|}^2}}$, with the sum over all occupied electron states, the equations must be solved self-consistently. Even within the density functional approximation, solutions can be difficult owing to rapid variation of ψi near the ionic cores. A further approximation based on pseudopotentials or the projector augmented wave methodReference Blöchl32,Reference Kresse and Joubert33 alleviates this difficulty by special treatment of the core region and treating only outer shell valence electrons.
A number of computer programs that are widely available or even public domain solve the Kohn–Sham equations to yield total energies that can be accurate to within a few meV/atom (a few tenths of a Joule/mole). This is sufficient in most cases to identify favorable low energy structures of alloys, with the convex hull of enthalpy versus composition reproducing the experimentally known low temperature stable phases.Reference Mihalkovič and Widom34,Reference Widom and Mihalkovic35 A wealth of additional information comes as a side benefit, including the electronic wavefunctions and density of states D(E), which govern the electrical conductivity, optical spectra, and the electronic free energy F elec; the ground state charge density ρ(r), which reveals the nature of chemical bonding; forces acting on individual atoms, which can be used to relax the atoms to their stable positions, to calculate phonon vibrational density of states g(ω), or to perform ab initio molecular dynamicsReference Kresse and Hafner36; the mechanical stress tensor of the complete structure, which can be used to optimize the volume and to calculate elastic constants.
B. Supercell and SQS
Since DFT calculation requires the positions and chemical identities of every atom as input, special consideration is required to calculate the entropy of a random solid solution. We can exploit the large volume and large number of atoms in bulk matter to address this problem through averaging in the thermodynamic limit. Think of the bulk system as consisting of many overlapping subregions; we could calculate the energy of many such subregions (invoking the “nearsightedness” of the electronic structureReference Kohn37), then approximate the bulk as an average over local regions, weighted by their frequency in the bulk.
Bravais lattice structures such as FCC and BCC contain only a single atom in their primitive cell, which is then repeated infinitely to fill space. To explicitly form a structure of N chemical species requires at least N atoms (and even more if their concentrations x α are not equal), hence motivating the concept of a supercell containing several contiguous primitive cells, that itself can be repeated infinitely to fill space. The chemically decorated supercell is thus a unit cell of a more complex non-Bravais lattice structure. Given a supercell of S atomic sites, and N 1, N 2, …, N s atoms of species 1, 2, …, s to occupy them, the number of possible decorations of the supercell, S!/N 1!N 2!…N s! grows very rapidly with the size S of the supercell. Fortunately, owing to the law of large numbers, sampling a subset of possible supercell decorations is sufficient to obtain an excellent average.
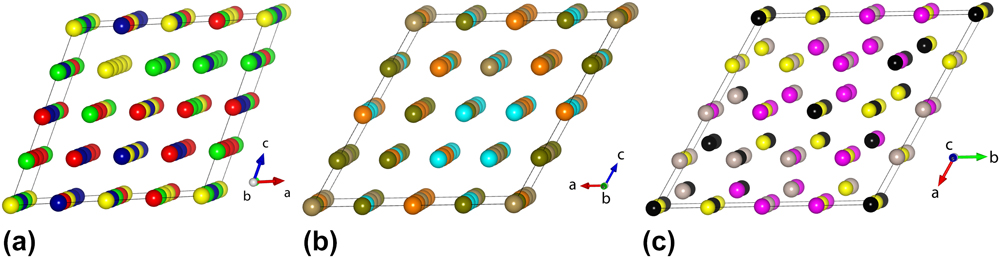
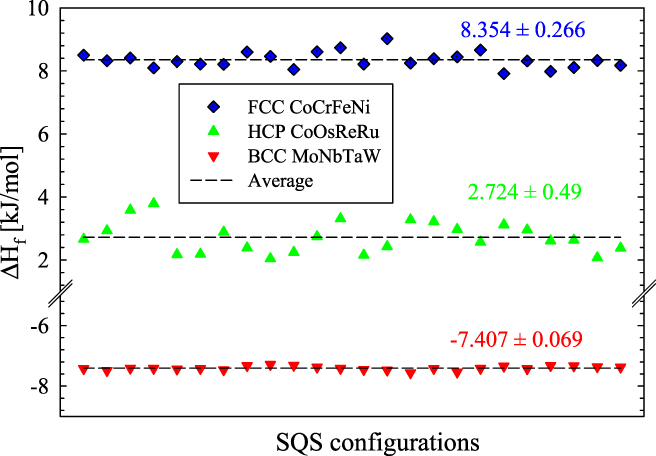
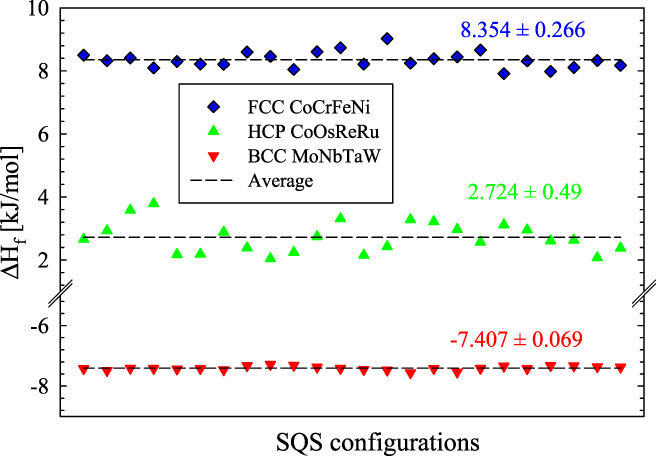
An alternative to sampling many decorations of a supercell is to design a special structure that represents a typical decoration. In a maximally random (uncorrelated) solid solution, the probability for a given interatomic bond to connect species α and β is y αβ = x αx β, similarly any triplet has probability w αβγ = x αx βx γ and any quadruplet has probability z αβγδ = x αx βx γx δ. However, in a supercell of modest size (see Fig. 1) there can be large deviations from these frequencies. SQSReference Zunger, Wei, Ferreira and Bernard7 are specially designed to match selected correlation functions, typically including the first few neighbor pairwise bonds but rarely including a triplet or a quadruplet. There is a danger that optimizing certain correlation functions may strongly skew others, resulting in a highly unrepresentative structure. An example of the unreliability of SQS is provided in Fig. 2, which shows the variation in energy with respect to differing assignments of chemical species to the 4 site classes in a 4-component 64-atom equiatomic SQS.Reference Gao, Niu, Jiang and Irving38 Since there are 24 ways to assign 4 species to 4 site classes, there are a total of 24 inequivalent configurations. If the SQS were truly representative, the energy should not depend on which element is assigned to a given site class.
Four-component SQS structures for (a) FCC, (b) BCC, and (c) HCP alloys (reprinted with permission from Ref. Reference Gao, Niu, Jiang and Irving38). Each color represents a different SQS site class.

Energy variation for different assignments of elements to SQS site classes (reprinted with permission from Ref. Reference Gao, Niu, Jiang and Irving38). CoCrFeNi is FCC, CoOsReRu is HCP, and MoNbTaW is BCC, and the SQS structures are illustrated in Fig. 1.
Sensitivity to chemical species distribution should diminish with increasing supercell size S, and these can be efficiently generated through Monte Carlo methods.Reference van de Walle, Tiwary, de Jong, Olmsted, Asta, Dick, Shin, Wang, Chen and Liu39 The supercell should be chosen large enough to allow variation of local environments, but not so large that the O(S 3) scaling of DFT calculation time renders the calculations prohibitively expensive. If phonon calculations are to be performed, the calculation time grows as O(S 4) because of the requirement to displace each atom independently. An alternative to the SQS approach is to sample a variety of specific ordered structures utilizing the “small set of ordered structures” approach.Reference Jiang and Uberuaga40
C. CPA
The CPAReference Yonezawa and Morigaki41 sidesteps the need to explicitly assign chemical species to sites. The electronic structure problem is solved by a Green function method based on the multiple scattering of electrons off atomic potentials. Each atom of species α is assumed to be surrounded by effective atoms placed on the remaining lattice sites, whose scattering potential is given by the composition-weighted average of all atomic species. The set of species-dependent scattering potentials is then solved self-consistently. Every atom feels an identical environment, avoiding the arbitrariness implicit in supercell methods. Furthermore, the composition can be varied continuously. However, there are disadvantages as well. First, the effective atom is a fiction, and the resulting uniformity of environment is not correct. Second, because all surrounding lattice sites are identically occupied, each atom sits in a position of high symmetry and experiences no force displacing it from its own lattice site so that lattice distortion is absent.
D. FP-tuned pair potentials and EAM
Because of the computational requirements of DFT, it can be useful to trade chemical accuracy for speed and simplicity through the use of empirical potentials. The simplest of these are pair potentials, in which atoms interact pairwise, resulting in a simple expression for the total potential energy
 $$V = \sum\limits_{\alpha \le \beta } {\sum\limits_{i \lt j} {{V_{\alpha \beta }}\left( {{r_{ij}}} \right)} \quad ,}$$
where the pair potential V αβ(r ij) is the interaction of the ith atom of species α with the jth atom of species β. The inequalities ensure that each bond is counted exactly once. The pair potential can be defined in terms of simple functions such as Lennard-Jones (“6–12”), Morse, Johnson, or they can be derived from perturbation theory.Reference Moriarty42–Reference Moriarty and Widom44 The Friedel oscillations caused by insertion of metal ions into the electron gas can often be captured using a simple oscillatory function.Reference Mihalkovič and Henley45 One peculiarity of pair potentials is that they exert only central forces, and hence the Cauchy relation among elastic constants (e.g., C 12 = C 44 for centrosymmetric cubic crystals) is automatically obeyed. The Cauchy relation does not hold in real materials.
An important generalization of the pair potential adds a nonlinear function of pairwise functions. The embedded-atom class of interactionsReference Daw and Baskes46,Reference Foiles, Baskes and Daw47 (this also includes Finnis–SinclairReference Finnis and Sinclair48 and JohnsonReference Johnson and Oh49 potentials) is defined by
 $$V = \sum\limits_{\alpha \le \beta } {\sum\limits_{i \lt j} {{V_{\alpha \beta }}} } \left( {{r_{ij}}} \right) + \sum\limits_\alpha {\sum\limits_i E_α } \left( {\sum\limits_\beta {\sum\limits_j {{\rho _{\alpha \beta }}\left( {{r_{ij}}} \right)} } } \right)\quad .$$
Here, the “embedding function” E represents a contribution to the energy of atom i of type α embedded in the electron density created by neighboring atoms of type β at distance r ij. Embedded atom potentials exert noncentral many-body forces and thus are able to violate the Cauchy violate (i.e., exhibit proper elastic behavior). They also capture certain surface reconstructions such as contracted bond lengths near metallic surfaces.Reference Daw and Baskes46
Pair potentials and embedded atom-type potentials based on analytic functions contain parameters that must be defined separately for each pair of species αβ. These parameters can be fit to reproduce properties such as lattice constants (atomic size) and binding strength or elastic constants. In practice, the number of parameters is too low to allow fitting of all physical quantities that may be of interest, resulting in potentials that are satisfactory for certain applications but must be used with caution outside of purposes for which they were designed. Even potentials created in tabulated form or though splines,Reference Ercolessi and Adams50,Reference Mendelev, Han, Srolovitz, Ackland, Sun and Asta51 which are far more general than simple analytic functions, will not accurately reproduce properties for which they were not specifically designed because the particular functional forms (8) and (9) are too restrictive and unable to capture the full range of many-body interactions.
Equations (8) and (9) can be evaluated in a time of order S 2, where S is the size of the system (i.e., number of atoms). Note that this is better scaling than obtained by DFT. For sufficiently large systems, the majority of atom pairs lie outside the range of the interaction V αβ(r) or the electron density ραβ(r). In this case, the scaling can be reduced to order S 1, provided that a list is obtained of which atoms lie with the interaction ranges of each other. However, the fitting of interaction parameters presents a scaling difficulty. If there are N chemical species, of order N 2 parameters must be fit. If changes in composition or density are made, they must be refit. This contrasts with DFT which requires only order N pseudopotentials (or none at all for all-electron methods). Pseudopotentials are widely available in advance and are highly transferable.
E. Miedema model
Finally, the Miedema modelReference Miedema, de Châtel and de Boer52 provides the simplest approach to calculation of enthalpy. Based on notions of atomic volume and solvation energy, and originally intended for application to liquids, it defines pairwise interactions of atomic species without regard to the actual crystal structure, resulting in
 $$\Delta {H_{\alpha \beta }} = f\left( {{x_\alpha },{x_\beta }} \right)\left( {{x_\alpha }\Delta H_{\alpha \;{\rm{in}}\;\beta }^{{\rm{sol}}} + {x_\beta }\Delta H_{\beta \;{\rm{in}}\;\alpha }^{{\rm{sol}}}} \right)\quad ,$$
with
 $$f\left( {{x_\alpha },{x_\beta }} \right) = {x_\alpha }{x_\beta }\left( {1 + \delta {x_\alpha }{x_\beta }} \right)\quad ,$$
representing the surface contact area of species α and β. Tabulated values of parameters are available for many elements. As applied to solid alloys, the Miedema model formation enthalpy contains two additional terms,Reference Miedema and Niessen53 H elastic for elastic strain of solid solutions, and H struct that discriminates between FCC, HCP, and BCC structures of transition metals and depends on their valence electron counts. Although Miedema defined the model for binary compounds, proposed generalizations to ternaries and beyond exist.Reference Widom6,Reference Gonçalves and Almeida54,Reference Mousavi, Abbasi and Kashani-Bozorg55 This has been used to screen large numbers of compounds to predict formation of high-entropy metallic glassReference Takeuchi and Inoue56–Reference Takeuchi, Gao, Qiao, Widom, Gao, Yeh, Liaw and Zhang58 and to investigate formation rules for multicomponent alloys.Reference Gao, Carney, Doğan, Jablonksi, Hawk and Alman59–Reference Yang and Zhang61
IV. COMBINING FIRST-PRINCIPLES TOTAL ENERGY WITH STATISTICAL MECHANICS
Section III addressed methods to calculate the energy of a structure, while thermodynamics combines energy and entropy to form the free energy. Statistical mechanics provides the formal bridge between energy and free energy. Several physical excitations (atomic vibrations, chemical substitution, and electronic and magnetic excitations) contribute to the entropy and can be directly computed based on first-principles total energy calculations. Here, we begin by describing direct methods, then address certain convenient approximations.
A. Direct methods
Statistical mechanics defines the free energy as F = −k BT ln Q, with the partition function Q obtained from an integral over all degrees of freedom,
 $$Q = {1 \over {{h^{3N}}N!}}\int {{\rm{d}}{\bi{r}}\,{\rm{d}}{\bi{p}}\,{\rm{d}}s\,{{\rm{e}}^{{{ - E} / {{k_{\rm{B}}}T}}}}} \quad .$$
Here r and p represent the set of all positions and momenta and s is a collection of other degrees of freedom should they exist (e.g., electronic or magnetic states). We assume that we can calculate E based on either first-principles DFT or else based on interatomic potentials. Frequently, the energy can be decomposed into a sum of independent terms. For example, we can separate the kinetic energy of the atoms  $K = \sum\limits_i {{{{{\left| {{{\bi{p}}_i}} \right|}^2}} / {2{m_i}}}}$ from the potential energy V(r, s) to obtain Q = Z/Λ 3N, with the thermal de Broglie wave length
 $\Lambda = \sqrt {{{2\pi {\hbar ^2}} / {m{k_{\rm{B}}}T}}}$, and
 $$Z = \mathop \int \nolimits {\rm{d}}{\bi{r}}\,{\rm{d}}s\,{{\rm{e}}^{{{ - V\left( {{\bi{r}},s} \right)} / {{k_{\rm{B}}}T}}}}\quad .$$
Notice that we assume here a fixed volume V, so the free energy is a Helmholtz free energy F(NVT). We will later discuss the transformation to the Gibbs free energy G(NPT).
For crystalline solids, configuration space separates into basins that relax to distinct structures, and we can label the basin by its relaxed structure Γ. For example, Γ might specify a particular arrangement of chemical species in a random solid solution. Within a basin at sufficiently low temperatures, the system executes small oscillations around Γ. We define a vibrational free energy F vib(Γ) by integrating  ${{\rm{e}}^{{{ - V} / {{k_{\rm{B}}}T}}}}$ over the basin containing Γ. Assuming that the small vibrations have little impact on the electronic states, we may also define an electronic free energy F elec(Γ) from the occupation probabilities of single electron states,
 ${f_{T,\mu }}\left( E \right) = {1 / {\left( {{{\rm{e}}^{{{ - \left( {E - \mu } \right)} / {{k_{\rm{B}}}T}}}} + 1} \right)}}$. In this case, the electronic free energy F elec(Γ) = U elec − TS elec with
 $$U = \int {{\rm{d}}E\,E\,D\left( E \right)} \left( {{f_{T,\mu }}\left( E \right) - {f_{0,{E_{\rm{F}}}}}\left( E \right)} \right)\quad ,$$
and
 $$S = - {k_{\rm{B}}}\int {{\rm{d}}E\,D\left( E \right)} \left[ {{f_{T,\mu }}\left( E \right)\ln {f_{T,\mu }}\left( E \right) + \left( {1 - {f_{T,\mu }}\left( E \right)} \right)\ln \left( {1 - {f_{T,\mu }}\left( E \right)} \right)} \right]\quad ,$$
D(E) is the electronic density of states, and the chemical potential μ is determined by
 $${N_{{\rm{electrons}}}} = \int {{\rm{d}}E\ D\left( E \right){f_{T,\mu }}\left( E \right)\quad .}$$
At low temperature, μ approaches the Fermi energy E F, while at high temperatures it may be necessary to compute it exactly from Eq. (16).
The vibrational free energy can be evaluated in the harmonic approximation as
 $${F_{{\rm{vib}}}} = {k_{\rm{B}}}T\int {{\rm{d}}\omega \,\,g\left( \omega \right)} \ln \left[ {2\sinh \left( {{{\hbar \omega } / {2{k_{\rm{B}}}T}}} \right)} \right]\quad ,$$
with g(ω) the vibrational density of states. This F vib incorporates both the positional and momentum degrees of freedom, canceling the 1/Λ3N factor relating Q to Z. At high temperatures, the quasiharmonic approximation may be applied to account for thermal expansion by calculating the volume-dependence of vibrational frequencies. Including thermal expansion V(T) converts the Helmholtz free energy F(N, V, T) into the Gibbs free energy G(N, P, T).
Since we have separated (approximately) the electronic and vibrational degrees of freedom, we may define a basin free energy
 $$F\left( \Gamma \right) = V\left( \Gamma \right) + {F_{{\rm{elec}}}}\left( \Gamma \right) + {F_{{\rm{vib}}}}(\Gamma )\quad ,$$
with V(Γ) the relaxed energy in basin Γ. Then our partition function becomes  $Z = \sum\limits_\Gamma {{{\rm{e}}^{{{ - F\left( \Gamma \right)} / {{k_{\rm{B}}}T}}}}}$. It may be permissible to make a further approximation, taking F vib and F elec independent of Γ. In this case, the full free energy F = F vib + F elec + F config with F config = −kT ln Z config and
 $${Z_{{\rm{config}}}} = \sum\limits_\Gamma {{{\rm{e}}^{{{ - V} / {{k_{\rm{B}}}T}}}}} \quad .$$
The sum runs over distinct configurations of chemical species on lattice sites. If there is only a single relevant structure, for example, a well-ordered crystalline solid, then no summation is needed and the calculation is complete. For a random solid solution, there can be many terms. Within a sufficiently small supercell, it may be possible to explicitly sum over configurations and obtain a reasonable estimate of the free energy.Reference Pomrehn, Toberer, Snyder and van de Walle62–Reference Widom and Huhn64 However, the number of configurations grows exponentially with the number of sites, so usually some other method will be required to explore the thermodynamics.
An especially simple approximation is to take the enthalpy, and vibrational and electronic free energies of just a single representative structure (e.g., an SQS), then assign the ideal configurational entropy as in Eq. (1). In the event of chemical ordering onto sublatticesReference Feng, Liaw, Gao and Widom65,Reference Rogal, Bobrowski, Körmann, Divinski, Stein and Grabowski66 such as B2 order,Reference Qiu, Hu, Taylor, Styles, Marceau, Ceguerra, Gibson, Liu, Fraser and Birbilis67–Reference Huhn and Widom69 one sums the sublattice entropies weighted by the fractions of atoms {f i} on each sublattice i,
 $$S = - {k_{\rm{B}}}\sum\limits_i {{f_i}} \sum\limits_\alpha {x_\alpha ^{(i)}} \ln x_\alpha ^{(i)}\quad .$$
More generally, one can apply a mean field theory to represent both the energy and the entropy in terms of unknown short-range order parameters, then determine the order parameters that minimize the free energy.Reference Lederer, Toher, Vecchio and Curtarolo70 The approximations of Eqs. (1) and (20) are known as the Bragg–Williams approximation.Reference Bragg and Williams71 Including pair correlation functions (see below) results in the quasichemical or Bethe approximation,Reference Fowler and Guggenheim72,Reference Bethe73 while extension to multipoint correlations leads to Kikuchi’s cluster variation method.Reference Kikuchi74,Reference Widom75
Inclusion of magnetism is also feasible but the magnetic entropyReference Ikeda, Grabowski and Koermann16 presents difficulties. The magnetic contribution to the enthalpy can be easily obtained through spin-polarized DFT. Many of the popular FCC HEAs based on CoCrFeNi exhibit complex magnetic structure with the Cr atoms tending to order antiferromagnetically relative to the others, leading to the possibility of magnetic frustration. Indeed, multiple self-consistent solutions of the Kohn–Sham equations can be found corresponding to different patterns of positive and negative moments. At low temperatures in the ferromagnetic state, magnetic excitations known as spin waves reduce the magnetization. A rigorous calculation of the magnetic entropy similar to the vibrational entropy can be performed if the spin wave density of states can be calculated. At elevated temperatures in the paramagnetic state, localized moments may persist on the individual atoms but long-range ferromagnetic order is destroyed. In this limit, an effective spin S can be defined for each atom, and the entropy approximated as k B ln(2S + 1). Although rigorous calculation of magnetic entropy is not yet available for HEAs, experimental information is availableReference Lucas, Belyea, Bauer, Bryant, Michel, Turgut, Leontsev, Horwath, Semiatin, McHenry and Miller76–Reference Schneeweiss, Friák, Dudová, Holec, Šob, Kriegner, Holý, Beran, George, Neugebauer and Dlouhý78 owing to the possible application of HEAs in magnetic refridgeration.Reference Kurniawan, Perrin, Xu, Keylin and McHenry21
B. Cluster expansion
The initial distribution of chemical species among the sites of a lattice determines the final relaxed configuration Γ and its relaxed energy V(Γ). The initial distribution can be represented by stating the chemical species σi occupying the lattice position i, which can be considered as a vector of species,  $\vec{\sigma }$. Under the assumption that the energy is determined primarily by short-range interactions, it is natural to seek a representation of the energy as a sum of interactions whose strength diminishes with increasing range. This sum, which may include single-atom and pair as well as many-body interactions, can be justified through a perturbative expansion of the total energy.Reference Moriarty42–Reference Moriarty and Widom44 Each term depends on the atomic species and their relative positions through
 $$V\left( {\vec{\sigma }} \right) = \sum\limits_i {E\left( {{\sigma _i}} \right)} + \sum\limits_{ij} {{J_{ij}}\left( {{\sigma _i},{\sigma _j}} \right)} + \sum\limits_{ijk} {{K_{ijk}}\left( {{\sigma _i},\;{\sigma _j},\;{\sigma _k}} \right)} + \cdots \quad .$$
The functions E, J, K, … can be fit to a database of total energies for a variety of differently decorated supercells of a basic lattice. The alloy theoretic automated toolkit (ATATReference Van de Walle, Asta and Ceder79) systematized a data generation and fitting procedure and provided tools to utilize the cluster expansion as an effective Hamiltonian for use in Monte Carlo simulation. By combining Monte Carlo with thermodynamic integration, ATAT allows the user to calculate free energies of many distinct phases, and thus to predict phase diagrams exhibiting order–disorder transitions and phase separation.Reference Ravi, Panigrahi, Valsakumar and van de Walle80 Later enhancementsReference van de Walle81 include the possibility to incorporate vibrational end electronic free energy so that instead of expanding the relaxed total energy V, instead it can expand the basin free energy F(Γ) [Eq. (19)].
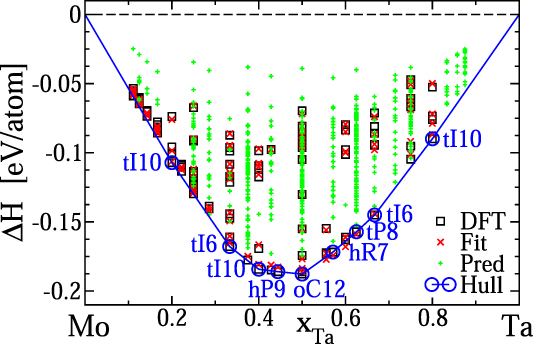
In Fig. 3, we illustrate a cluster expansion for the binary refractory alloy system Mo–Ta. Elemental Mo and Ta both take the BCC structure, and many decorations of the BCC lattice with Mo and Ta atoms exhibit negative enthalpies of formation. The comparison of DFT energies with the best fit cluster expansion shows a typical fit, achieving a cross-validation error of 3 meV/atom with a set of 17 pair interactions J ij and 13 triplets K ijl. The convex hull contains 9 predicted ground states at a discrete set of compositions, separated by regions of phase coexistence. Ground state structures are labeled by their Pearson symbols. These ground states are not readily experimentally accessible because the dense set of structures lying close in energy above the convex hull allows for a large configurational entropy that stabilizes the experimentally observed continuous solid solution at elevated temperatures. Cluster expansions are a natural starting point for application of mean field theories to predict order–disorder of segregation phase transitions.Reference Huhn and Widom69,Reference Lederer, Toher, Vecchio and Curtarolo70
Cluster expansion enthalpies for the BCC Mo–Ta binary alloy (see also Ref. Reference Huhn and Widom69). The data set of DFT-calculated enthalpies is shown with black squares and the fitted cluster expansion is shown with red crosses. Additional predicted structures with up to 9 atoms per cell are shown as green plus signs. Vertices of the convex hull (blue circles) identify stable structures labeled with their Pearson symbols.

C. First-principles hybrid Monte Carlo/molecular dynamics
Monte Carlo simulation is a popular method for generating structures representative of the equilibrium ensemble. By attempting to swap the positions of different chemical species and weighting the acceptance probability of the swap by the Boltzmann factor  ${{\rm{e}}^{{{ - \Delta E} / {{k_{\rm{B}}}T}}}}$, suitable short- or long-ranged chemical order will develop. Molecular dynamics is an alternative method to explore configuration space. By integrating the equations of motion, it generates physically appropriate trajectories through the configuration space. Combining the two exploits the strengths of each to overcome inherent weaknesses of the other. While in principle molecular dynamics can access the full configuration space, in practice for solids, the atomic diffusion rates are too low to efficiently sample different chemical ordering in distinct basins Γ. This is where Monte Carlo excels. Meanwhile, Monte Carlo swaps of chemical species do not generate small atomic displacements typical of atomic vibrations within a given basin Γ. This is where molecular dynamics excels. This hybrid method proves highly efficient for simulation of HEAs.Reference Widom, Huhn, Maiti and Steurer82
To further enhance equilibration, MC/MD can be supplemented with replica exchange,Reference Yao, Gao and Widom83 in which independent runs at neighboring temperatures are swapped with a Boltzmann-like probability eΔ(1/T)ΔE. In this manner, the proper weighting of the equilibrium ensemble is maintained at every temperature, while ensemble diversity is enhanced by swapping in independent configurations. An important variant of this method utilizes replicas with differing compositions and swaps atomic species between cells.Reference Niu, Windl and Ghazisaeidi84
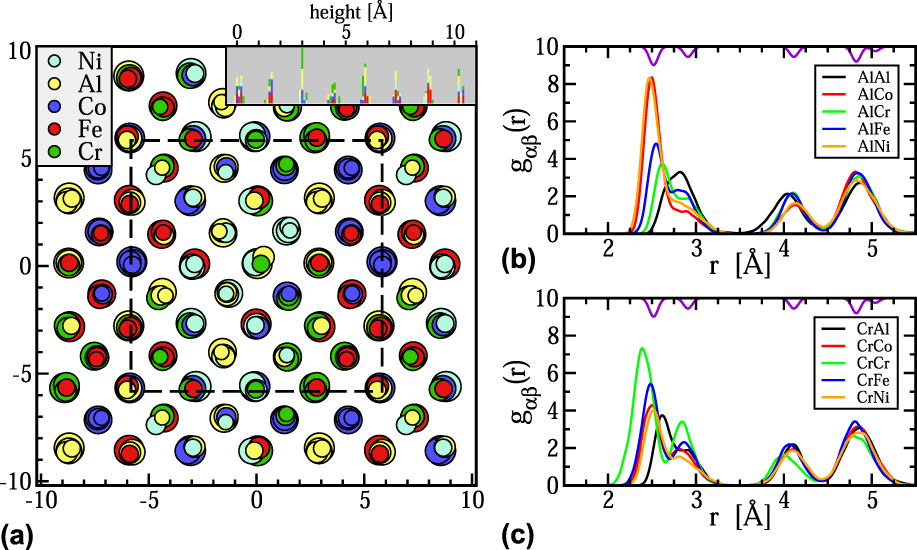
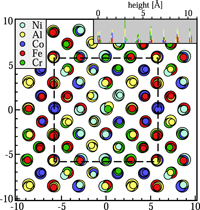
Hybrid MC/MD has been extensively applied to refractory alloys.Reference Gao, Zhang, Gao, Zhang, Ouyang, Widom and Hawk4,Reference Feng, Liaw, Gao and Widom65,Reference Widom75,Reference Widom, Gao, Yeh, Liaw and Zhang85,Reference Feng and Widom86 Figure 4(a) shows the structure of Al1.33CoCrFeNi at T = 300 K simulated using hybrid MC/MD with replica exchange. The basic structure is BCC, but lattice distortion is evident in the displacement of atoms from their ideal positions. The lattice distortion arises from a combination of a static atomic size effect and a dynamic contribution from thermal atomic vibrations.Reference Widom75,Reference Feng and Widom86 In terms of the mean square deviation from ideal sites 〈|ΔR|2〉, the lattice distortion reduces the diffraction peak intensity at the reciprocal lattice vector G by the Debye–Waller factor e−2W with  $2W = {1 \over 3}\left\langle {{{\left| {\Delta {\bf{R}}} \right|}^2}} \right\rangle {\left| {\bf{G}} \right|^2}$ and also creates diffuse scattering in the vicinity of the Bragg peaks.Reference Widom75 Local atomic species-resolved lattice distortion can also be experimentally probed through XAFS.Reference Oh, Ma, Leyson, Grabowski, Park, Körmann and Raabe87 Chemical ordering is evident in the alternation of Al-rich and transition metal-rich columns (see near the upper right-hand corner of the cell). The equilibrium phase at this composition contains domains of B2-like order and also tends to segregate Cr atoms from the other speciesReference Santodonato, Zhang, Feygenson, Parish, Gao, Weber, Neuefeind, Tang and Liaw68 (see near the lower right-hand corner). This is perhaps clearer to visualize in the radial distribution functions shown in Fig. 4(b). First examine the distribution of atoms surrounding Al. The transition metal atoms, especially Co and Ni, primarily lie at the near-neighbor distance from Al, while the Al atoms lie at the second neighbor distance from each other. Meanwhile, notice the strong nearest and second neighbor peaks of Cr with itself.
(a) Simulated structure of Al1.33CoCrFeNi at T = 300 K viewed along the [001] direction. Colors indicate atomic species while sizes indicate vertical height. The simulation cell is outlined in dashed lines and extends periodically outside. The inset shows the vertical density profile. (b) and (c) Partial radial distribution functions g αβ(r) showing the atomic distributions around Al and Cr atoms. Purple curve at top is radial distribution function of elemental Cr.

D. Correlation functions and mutual information
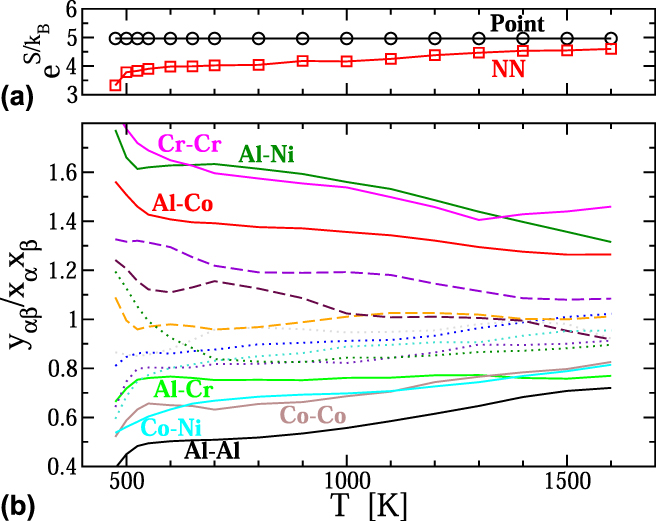
Given a set of configurations selected from the equilibrium ensemble by Monte Carlo simulation of using either a cluster expansion or hybrid MC/MD, a variety of statistical and geometrical properties of the ensemble can be computed. Of particular interest are correlation functions,Reference Fernández-Caballero, Wróbel, Mummery and Nguyen-Manh88 notably the near neighbor pair frequencies y αβ. The ratio between these frequencies and their uncorrelated expectations, e.g., y αβ/x αx β, reveals the preference for certain chemical species to associate. Figure 4 illustrates the nearest neighbor (NN) pair correlation functions from MC/MD replica exchange simulations of Al1.33CoCrFeNi. Notice how the deviations of y αβ/x αx β from 1 grow as the temperature drops, with increasing frequency of Co and Ni as neighbors of Al (and corresponding loss of these species as their own neighbors), and similarly the increasing frequency of Cr as its own neighbor.
Short-range chemical order necessarily reduces the configurational entropy relative to the ideal mixing value of Eq. (1). The correlation function y αβ provides information about the likely chemical species β occupying a site adjacent to any given atom of species α. This can be quantified through the notion of mutual information
 $$I\left[ {{y_{\alpha \beta }};\;{x_\alpha }} \right] = \sum\limits_{\alpha \beta } {{y_{\alpha \beta }}\ln \left( {{{{y_{\alpha \beta }}} / {{x_\alpha }{x_\beta }}}} \right)} \quad .$$
In view of the equivalence of entropy and information, the mutual information can be subtracted from the ideal entropy to derive an improved estimate of the true entropy,Reference Jaynes89,Reference Gao and Widom90
 $$S \approx {S_{{\rm{ideal}}}} - 4{k_{\rm{B}}}I\left[ {{y_{\alpha \beta }};\;{x_\alpha }} \right]\quad ,$$
where the factor of 4 arises because there are 4 NN bonds per site. This expression can also be derived as a special case of Kikuchi’s cluster variation method,Reference Widom75,Reference Kikuchi91,Reference Gao, Gao, Hawk, Ouyang, Alman and Widom92 and it can be generalized to liquids.Reference Gao and Widom90 Applying Eq. (1) to the composition Al1.33CoCrFeNi results in S ideal = 1.602k B or  ${{\rm{e}}^{{S / {{k_{\rm{B}}}}}}} = 4.96$. This value is shown in Fig. 5(a) and labeled as “Point” because each single site contributes independently. Notice that the value of S is slightly less than ln(5) = 1.609 because the composition deviates slightly from equiatomic. The entropy loss due to the mutual information of “NN” pairs is small at high temperatures close to melting but grows substantially as temperature drops.
Entropy and pair correlations y αβ/x αx β of Al1.33CoCrFeNi obtained from MC/MD simulation with replica exchange. In (a), the single point (ideal mixing) entropy is reduced by the information content of the NN pair correlations [see Eq. (23)]. In (b), species pairs αβ that deviate strongly from independence are labeled.

E. CALPHAD
CALPHAD is the last major technique we shall introduce. Standing for Calculation of Phase Diagrams, CALPHAD is based on interpolation techniques for thermodynamic functions, utilizing experimental or first-principles computed data for elements, and known binary and ternary alloy systems, to approximate the free energies of phases at compositions where data are lacking.Reference Kaufman and Bernstein8 Interpolation on this data set yields approximate free energies G (i)(T; x(i)) for multiple phases i at specified compositions or composition ranges. Finally, the convex hull is computed over a desired range of compositions and temperatures. Several companies offer databases and associated software tools, notably PANDAT and Thermo-Calc,Reference Mao, Chen and Chen93 each of which have developed databases geared toward the study of HEAs. There is also an open source effort.94
The validity of CALPHAD rests on the accuracy and completeness of its underlying database. Traditional databases were structured around one or a few base elements such as aluminum, iron, or nickel, with additional alloying elements intended to be present in low concentrations. Thermodynamic data for intermetallic compounds at intermediate compositions are sparse, and existing phases are often absent from the databases, requiring careful adjustment and optimization when a new alloy system is to be explored. Nonetheless, CALPHAD is an invaluable tool for obtaining a qualitative global view of the phase diagram, including many of the potential phases that may occur and how phase selection is affected by variation of temperature and composition. It can motivate critical experiments that in turn can be used to revise and improve the database. Several example applications of CALPHAD to HEAs and MPEAs are given below.
V. EXAMPLE APPLICATIONS
Many pioneering studies in HEAs exemplify the above techniques and shed light on their structures and phase stability. In the following, a few examples of the application of CPA, supercells, cluster expansion, and finally CALPHAD are described.
A. CPA
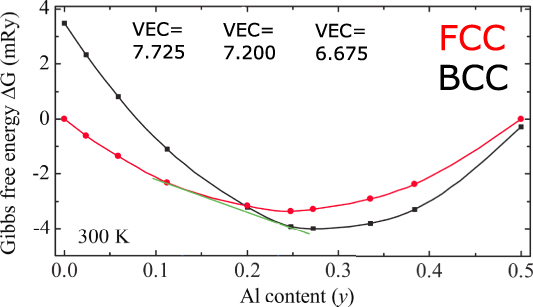
We begin with example applications of the CPA. One of the first papers on HEA mentioned the BCC to FCC transition in Aly(CoCrFeNi)1−y as the Al content y increases.Reference Yeh, Chen, Lin, Gan, Chin, Shun, Tsau and Chang2,Reference Wang, Wang, Wang, Tsai, Lai and Yeh95 Note that this composition can also be written as AlxCrCoFeNi, with y = x/(4 + x). Figure 6 plots the CPA-calculated free energiesReference Tian, Delczeg, Chen, Varga, Shen and Vitos96 of the BCC phase (black) and the FCC phase (red) as functions of y. The enthalpies are taken from the CPA, while the entropies are assumed to be ideal mixing, i.e., Eq. (1) with x Al = y and x α = (1 − y)/4 for CoCrFeNi. The two curves cross near y = 2, indicating an exchange of stability, with greater Al content to the right favoring BCC and lower Al content to the left favoring FCC. However, the crossing region itself is thermodynamically unstable, as the pure phase free energies lie above the convex hull, defined by the common tangent construction and indicated in green. For Al content in this region from y = 0.13 to y = 0.24, a two phase mixture of FCC and BCC is predicted.
Gibbs free energy G = H − TS of Aly(CrCoFeNi)1−y as a function of aluminum content y. Calculated at T = 300 K (adapted with permission from Ref. Reference Tian, Delczeg, Chen, Varga, Shen and Vitos96). VEC is the valence electron count.

This prediction is in excellent agreement with experiments on the HEA Aly(CrCoFeNi)1−y,Reference Wang, Wang, Wang, Tsai, Lai and Yeh95,Reference Kao, Chen, Chen and Yeh97 which exhibit single phase FCC at low Al content and single phase BCC at high Al content, with mixed FCC and BCC in between. We can understand this progression qualitatively from the perspective of valance electron count (VEC). Scanning across the periodic table, we see that BCC structures are prevalent at low valence and FCC structures are prevalent at high valence. Moving to alloys (both simple binariesReference Lee and Hoffmann98 and HEAsReference Gao, Zhang, Gao, Zhang, Ouyang, Widom and Hawk4,Reference Guo, Ng, Lu and Liu99,Reference Singh, Smirnov and Johnson100 ), it appears that BCC extends up to VEC about 6.5 or 6.87, and FCC beyond 7.8 or 8, with complex structures, mixed behavior or phase coexistence expected in between.
CPA is also capable of modeling chemical ordering. The Strukturbericht L12 (Pearson cP4, prototype AuCu3) structure singles out the cube corner site in the FCC unit cell relative to the three face center sites. A study by Niu et al.Reference Niu, Zaddach, Oni, Sang, Hurt, LeBeau, Koch and Irving101 addresses the chemical ordering of CrCoFeNi on the FCC lattice by preferentially occupying the cube corner site with one of the four species. They showed that separating the Cr atom significantly lowers the energy and that this energy drop is related to the antiferromagnetic spin orientation of Cr relative to the remaining elements. A more general CPA-based study of chemical ordering in AlxCrCoFeNi utilized calculated the linear response of the energy to general spatial variation in composition.Reference Singh, Smirnov and Johnson100 In the equiatomic compound x = 1, they predict depletion of Fe at the cube corner for FCC structures, and creation of Strukturebericht B2 (Pearson cP2, prototype CsCl) order between Al and Co at cube corner and body center, respectively, in the BCC phase. The magnetically driven phase transformation may mechanically strengthen the HEA.Reference Niu, LaRosa, Miao, Mills and Ghazisaeidi102
B. Supercell with first-principles entropies
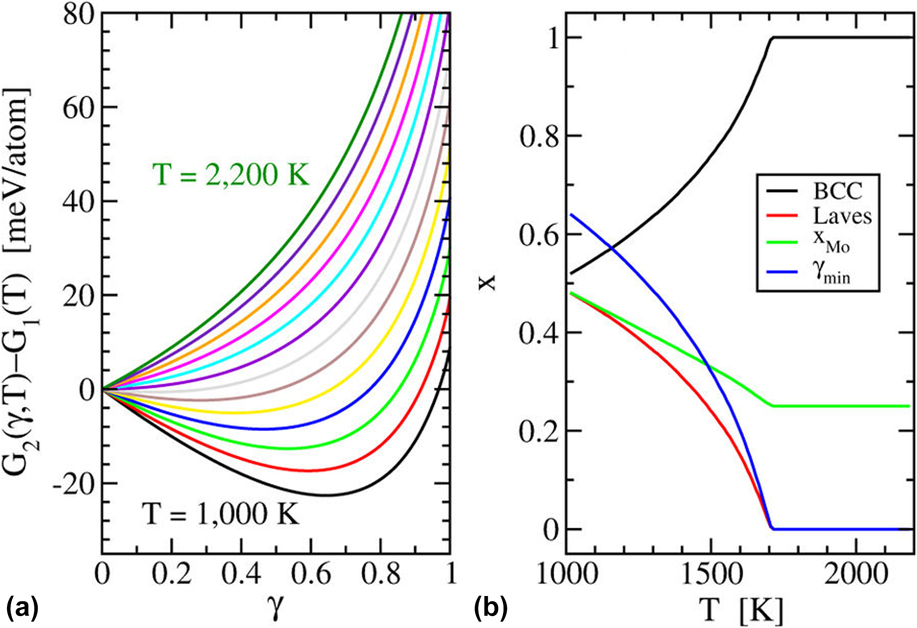
Beyond the CPA, Feng et al.Reference Feng, Liaw, Gao and Widom65 calculated the free energy of a previously unknown quaternary, CrMoNbV, through explicit inclusion of configurational, vibrational, and electronic free energies (see Fig. 7). This quaternary was chosen because expected competition from precipitation of a CrNbV Laves phase made it an interesting test of the concept of entropic stabilization. Hybrid Monte Carlo/molecular dynamics simulations were used to generate supercells with suitable chemical short-ranged order, resulting in approximately 10% enhancements of near-neighbor frequencies of pairs from different columns of the periodic table (Cr and Mo each prefer to be neighbors of V and Nb). Chemical short-ranged order reduces enthalpies by approximately 6 meV/atom; however, the order is sufficiently weak that the loss of substitutional entropy as given by Eq. (23) is negligible. Competing phase free energies were likewise calculated, including Cr–V substitutional entropy on one of the sublattices of CrNbV as given by Eq. (20). By calculating the free energy difference between the two phase mixture and the original equiatomic HEA, as a function of the CrNbV fraction precipitated, a transition was predicted at T = 1600 K. Subsequent experimental test confirmed a reversible transition from the two-phase mixture at low temperatures to the single-phase HEA at high temperatures. All terms in the entropy (configurational, vibrational, and electronic) favored the HEA, with the configurational term being dominant.
(a) Free energy change from single phase HEA to a two-phase mixture; (b) Phase fractions as functions of temperature (reprinted with permission from Ref. Reference Feng, Liaw, Gao and Widom65; made available through the Creative Commons Attribution 4.0 International License [http://creativecommons.org/licenses/by/4.0/]).

A similar approachReference Wang, Yan, Zhu, Wang, Wu, Hui, Otis, Shang, Liu and Chen103 applied to the Mo–Nb–Ta–V–W quinary refractory HEA and its alloy subsystems calculated G(x, T) for 178 potentially competing phases, from pure elements up through the HEA. It determined the full temperature-dependent phase diagrams of the quinary and the five constituent quaternary alloy systems.
C. Extrapolation from binaries
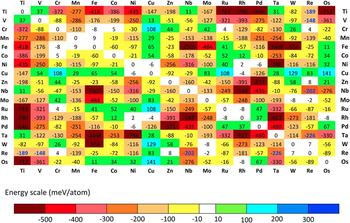
Recognizing that binary alloys are frequent and potent competitors for stability against HEAs, a group from Oak Ridge National Lab proposed to seek stable single phases by restricting the formation enthalpies of their constituent binary subsystems to a narrow range from modestly negative (compound-forming) to weakly positive (segregating).Reference Troparevsky, Morris, Kent, Lupini and Stocks104 Lower (i.e., most negative) enthalpy limits were set by the value of −T AnnealingΔS Mixing, while upper limits were set by a similar requirement against phase separation. They took data from existing databases of first-principles formation enthalpy, several of which are available online (see Fig. 8).105–108 In this manner, it proved possible to rationalize the successful single-phase compounds such as FeCoNi alloyed with Cr, Pd, or Mn, but not with Mo, Ti, or V due to strong interactions with Fe and/or Ni.
Interaction energy matrix of Troparevsky et al. (reprinted with permission from Ref. Reference Troparevsky, Morris, Kent, Lupini and Stocks104; made available through the Creative Commons Attribution 3.0 License [https://creativecommons.org/licenses/by/3.0/]) based on data from AFLOW (Ref. 105) and the Alloy Database (Ref. Reference Widom and Mihalkovic107).

The same approach implies a rapid fall-off of the number of potential single-phase compounds containing N = 5, 6, or 7 elements because each additional element is likely to interact unfavorably (either bind or repel too strongly) with one or more of the other elements in the compound. A generalization of this claimReference Widom6 suggests that in the composition space of an N-component alloy system, the stable compounds have an increasing probability to lie within M-component alloy subsystems, with M < N. The most likely values of M are 2 or 3. Thus, the use of binary interactions to screen for stability of multicomponent alloys is an excellent first approximation. If they were supplemented with data on ternaries then nearly all potential competitors would be accounted for.
D. Cluster expansions
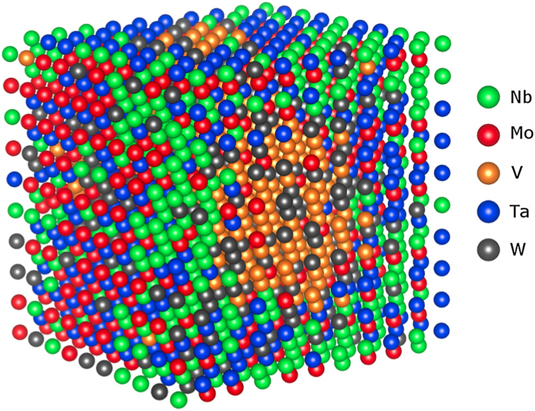
Cluster expansions are effective Hamiltonians that efficiently describe the ground state energy of a given distribution of chemical constituents. They have been applied to several refractory element HEA-forming compounds based on BCC lattices, including the quinary Mo–Nb–Ta–V–W,Reference Fernández-Caballero, Wróbel, Mummery and Nguyen-Manh88 and three quaternaries, Cr–Mo–Nb–V,Reference Feng, Liaw, Gao and Widom65,Reference Widom75,Reference Widom, Gao, Yeh, Liaw and Zhang85 Nb–Ti–V–Zr,Reference Widom75,Reference Widom, Gao, Yeh, Liaw and Zhang85 and Mo–Nb–Ta–W.Reference Huhn and Widom69,Reference Widom, Gao, Yeh, Liaw and Zhang85,Reference Körmann, Ruban and Sluiter109 Given an effective Hamiltonian, rapid search can reveal ground states exhibiting a wide variety of differing patterns of chemical order in alloy ground states. They can also be utilized in Monte Carlo simulation to reveal temperature-driven order–disorder phase transitions. Figure 9 illustrates the outcome of such a simulation of Mo–Nb–Ta–V–W, which simultaneously displays domains of chemical order and phase separation along with partial substitutional disorder.Reference Fernández-Caballero, Wróbel, Mummery and Nguyen-Manh88 Specifically, Mo and Ta segregate into a domain that exhibits local B2-like chemical order, while Nb, and especially V, separate from each other and from Mo–Ta. Finally, W appears to mix readily into the other domains.
Simulated structure of Mo–Nb–Ta–V–W at T = 400 K reveals domains of chemically ordered Mo–Ta, and partially segregated domains of Nb and V (reprinted with permission from Ref. Reference Fernández-Caballero, Wróbel, Mummery and Nguyen-Manh88).

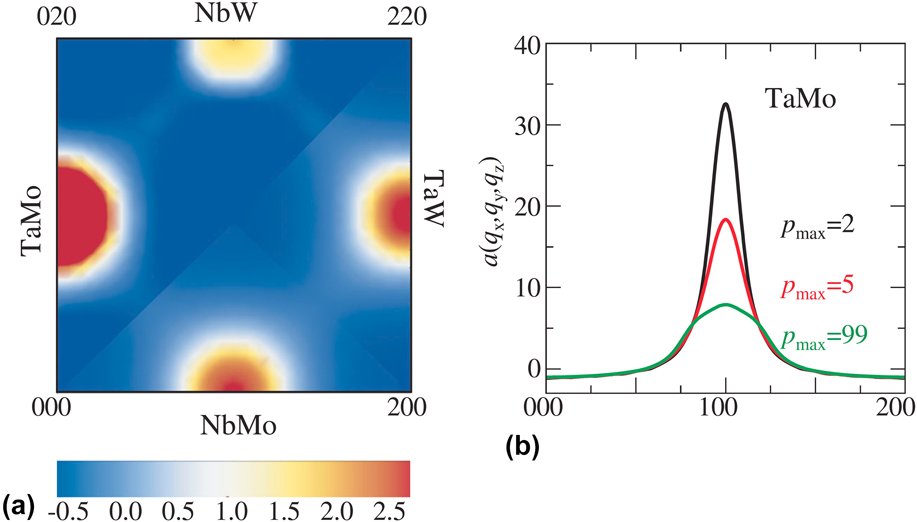
The prevalence of short-range order is illustrated in Fig. 10, which plots the diffuse diffraction intensities related to short-range chemical order in MoNbTaW. In a BCC solid solution, Bragg peaks obey BCC extinction rules, namely the (hkl) peaks are extinct whenever h + k + l is an odd integer. However, these odd peaks are present in chemically ordered variants of BCC such as B2. Short-ranged B2 order, like that seen between Mo and Ta in Fig. 9, can lead to diffuse peaks at the forbidden positions, as is shown in Fig. 10(a), which illustrates the intensity at positions (hkl) = (010) for MoTa, (120) for NbW, (210) for TaW, and (100) for NbMo.
(a) Diffuse diffraction peaks indicating short-ranged B2-type chemical order in simulations at T = 1300 K. (b) Including interactions of increasing range diminish the strength of the B2 short-range order (reprinted with permission from Ref. Reference Körmann, Ruban and Sluiter109; made available through the Creative Commons Attribution License [http://creativecommons.org/licenses/by/4.0/]).

Fitting a cluster expansion is difficult. The series may require many terms,Reference Körmann, Ruban and Sluiter109 even for a binary alloy, and the number of M-body terms grows roughly as N M for N species. The number also grows rapidly with the diameter of the cluster. The series coefficients may converge poorly as additional terms are added. Regularization methods such as compressive sensing can significantly aid in fitting the coefficients of the cluster expansion,Reference Nelson, Hart, Zhou and Ozoliņš110,Reference Nelson, Ozoliņš, Reese, Zhou and Hart111 but such tools have not been applied to HEAs to date. An illustration of the need for convergence is evident in Fig. 10(b), which shows that the strength of the Mo–Ta peak diminishes substantially as the number of pairwise interactions in the cluster expansion is increased.
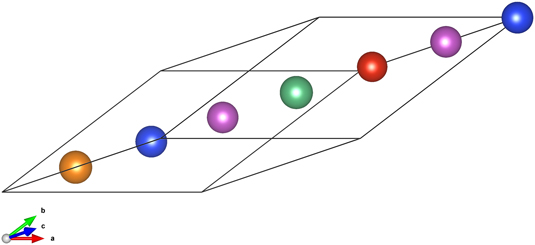
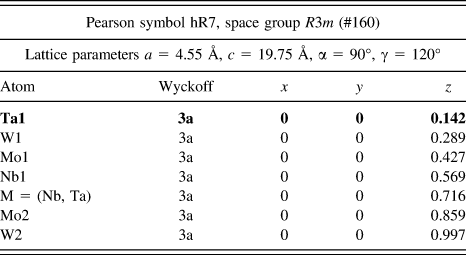
Owing to small fitting errors in the cluster expansion, the cluster expansion ground states may not properly identify the true DFT ground states. It is profitable to carefully relax and converge the DFT energies of all the predicted ground states as well as the low-lying states above the convex hull. In this manner, it was possible to identify quaternary ground state structuresReference Widom, Gao, Yeh, Liaw and Zhang85 of MoNbTaW that were not identified by the original cluster expansion. These Pearson type hR7 ground state structures are illustrated in Fig. 11. Their crystal structures are given in Table I.
Predicted (see Ref. Reference Widom, Gao, Yeh, Liaw and Zhang85) stable Pearson type hR7 quaternary phases Mo2NbTa2W2 and Mo2Nb2TaW2. Atomic species are colored as shown. The red position can be either Nb or Ta.

Crystallographic structure data of the predictedReference Widom, Gao, Yeh, Liaw and Zhang85 stable quaternary phases Mo2NbTa2W2 and Mo2Nb2TaW2.

E. CALPHAD method
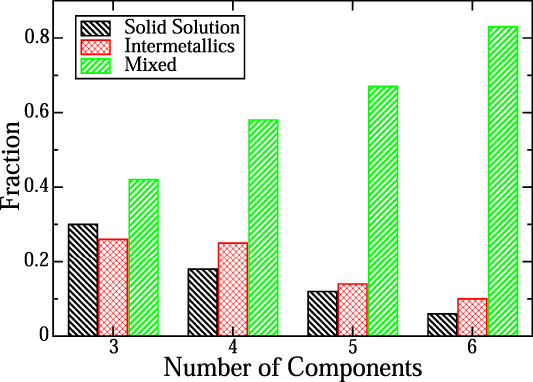
CALPHAD has been widely applied to the study of HEAs and MPEAs because it provides fast screening of many alloy systems. A notable early effort to identify MPEAs with solid solution phases evaluated over 130,000 alloy systems.Reference Senkov, Miller, Miracle and Woodward5 In addition to a tentative classification of alloy systems into categories such as solid solution-forming, intermetallic phase-forming, and mixed phase-forming, it provided a key conceptual advance. Contrary to the notion that increasing the number of components, N, necessarily favor formation of solid solutions through the increased configurational entropy, it turned out that the increased formation enthalpy of competing phases such as intermetallics grew more quickly than the ln(N) growth of the entropy. Hence, as N grows, the fraction of alloy systems exhibiting solid solution phases actually decreases, as illustrated in Fig. 12. The reason is that in the high dimensional composition space with large N, most extrema of the free energy occur on the surface of the space, corresponding to alloy subsystems containing fewer elements.Reference Widom6
Frequency of the structure as a function of the number of chemical species (adapted with permission from Ref. Reference Senkov, Miller, Miracle and Woodward5; made available through the Creative Commons Attribution 4.0 License [http://creativecommons.org/licenses/by/4.0/]). Solid Solution denotes a single phase solid solution. Intermetallics denotes one or more complex intermetallic structures form. Mixed means at least one each of solid solution and intermetallic.

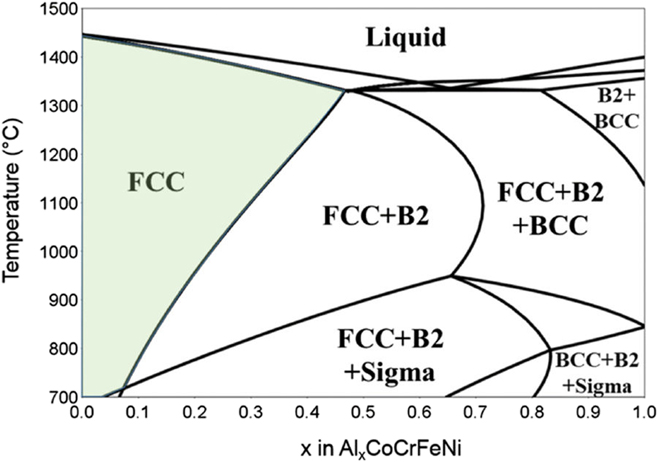
An essential ingredient of the concept of HEAs is that the configurational entropy aids in stabilizing a single phase. Since the entropy enters the free energy multiplied by temperature, as TS, it is reasonable to expect that the HEA should be stable at high temperature but transform into an ordered structure or decompose into a mixture of ordered structures at low temperature. Indeed, the third law of thermodynamics, requiring that entropy vanishes in the limit as T → 0 K, prevents solid–solid solutions in equilibrium at low temperature. Hence phase diagrams such as illustrated in Fig. 13Reference Taylor, Lu, Saal, Frankel and Scully112 are typical of CALPHAD predictions for MPEAs. At high temperature, the FCC CoCrFeNi solid solution accepts Al to form AlxCoCrFeNi up to x = 0.4. As temperature drops, the single-phase FCC region shrinks toward x = 0, losing stability first to a B2 phase consisting of chemical order between Al and transition metal atoms on a BCC lattice (see, e.g., Fig. 13), and then to a combination of B2 and a Cr-rich sigma phase.
CALPHAD-predicted phase diagram of AlxCoCrFeNi (reprinted with permission from Ref. Reference Taylor, Lu, Saal, Frankel and Scully112; made available through the Creative Commons Attribution 4.0 International License [http://creativecommons.org/licenses/by/4.0/]). Notice the shrinking range of the single-phase FCC solid solution as temperature drops.

VI. SUMMARY CONCLUSION
In summary, we reviewed basic principles of thermodynamics and the essential tools of quantum mechanics and statistical mechanics necessary to calculate thermodynamic stability from first principles. We gave several examples of their application to HEAs and related compounds. Specifically, we discussed the application of the CPA,Reference Tian14,Reference Yonezawa and Morigaki41,Reference Tian, Delczeg, Chen, Varga, Shen and Vitos96,Reference Singh, Smirnov and Johnson100,Reference Niu, Zaddach, Oni, Sang, Hurt, LeBeau, Koch and Irving101,Reference Youssef, Zaddach, Niu, Irving and Koch113–Reference Tian, Varga, Shen and Vitos119 supercell and SQS methods,Reference Gao, Niu, Jiang and Irving38,Reference Jiang and Uberuaga40,Reference Rogal, Bobrowski, Körmann, Divinski, Stein and Grabowski66,Reference Körmann and Sluiter120–Reference Rak, Rost, Lim, Sarker, Toher, Curtarolo, Maria and Brenner123 empirical pair- and embedded atom-potentials,Reference Maiti and Steurer124–Reference Choi, Kim, Seol and Lee131 and the Miedema approximation.Reference Widom6,Reference Takeuchi and Inoue56,Reference Takeuchi, Gao, Qiao, Widom, Gao, Yeh, Liaw and Zhang58–Reference Yang and Zhang61,Reference Yadav, Mukhopadhyay, Mishra, Mukhopadhyay and Srivastava132–Reference King, Middleburgh, McGregor and Cortie134 We explained how these may be combined for direct free energy calculation,Reference Feng, Liaw, Gao and Widom65,Reference Widom, Gao, Yeh, Liaw and Zhang85,Reference Wang, Yan, Zhu, Wang, Wu, Hui, Otis, Shang, Liu and Chen103,Reference Fernandez, Widom, Cuevas, Ares, Bodega, Leardini, Mihalkovič and Sánchez135 incorporated into cluster expansions,Reference Huhn and Widom69,Reference Lederer, Toher, Vecchio and Curtarolo70,Reference Widom, Gao, Yeh, Liaw and Zhang85,Reference Fernández-Caballero, Wróbel, Mummery and Nguyen-Manh88,Reference Körmann, Ruban and Sluiter109,Reference Gao, Suzuki, Schweiger, Doǧan, Hawk and Widom136 used as the basis for computer simulation,Reference Niu, Windl and Ghazisaeidi84–Reference Fernández-Caballero, Wróbel, Mummery and Nguyen-Manh88,Reference Körmann, Ruban and Sluiter109,Reference Körmann and Sluiter120,Reference Meraj and Pal125,Reference Xie, Brault, Thomann, Yang, Zhang and Shang127,Reference Choi, Jo, Sohn, Lee and Lee130,Reference Choi, Kim, Seol and Lee131,Reference Wang, Li, Fang, Liu and Zhang137,Reference Sharma, Singh, Johnson, Liaw and Balasubramanian138 and exploited the resulting correlation functions.Reference Gao, Zhang, Gao, Zhang, Ouyang, Widom and Hawk4,Reference Widom75,Reference Widom, Gao, Yeh, Liaw and Zhang85,Reference Gao and Widom90,Reference Gao, Gao, Hawk, Ouyang, Alman and Widom92 Finally, we related these methods to the CALPHAD approach,Reference Senkov, Miller, Miracle and Woodward5,Reference King, Middleburgh, McGregor and Cortie134,Reference Zhang, Zhang, Chen, Zhu, Cao and Kattner139–Reference Choi, Jung, Jo, Lee and Lee148 which historically has been empirical but now can be augmented with databases of first-principles derived information.
ACKNOWLEDGMENTS
I wish to acknowledge fruitful collaboration on high-entropy alloys with Jan Wrobel, Duc Nguyen-Manh, Bojun Feng, Rui Feng, Peter Liaw, William Huhn, and Michael Gao. Additional discussions with Fritz Körmann, Marcel Sluiter, Douglas Irving, Stefano Curtarolo, Chris Woodward, Zi-Kui Liu, and G. Malcolm Stocks are gratefully acknowledged. I am especially indebted to Michael Gao for introducing me to the subject of high-entropy alloys. Simulations of AlxCoCrFeNi were supported by a grant of computer time from the DoD High Performance Computing Modernization Program at the Air Force Research Laboratory DoD Supercomputing Research Center (AFRL-DSRC). The remainder of this work was supported by the Department of Energy under Grant No. DE-SC0014506.