I. INTRODUCTION
Sheet metal forming is a well-known procedure in the processing industry, where plates (t > 6 mm) and sheets (6 mm > t > 0.15 mm) are deformed into coveted shapes by stretching and shrinking the dimensions of all its volume elements in the three principal directions: the rate at which these loads are applied, the range of operating temperatures and pressures, and the material thickness virtually dictating the metal-forming processes. While there are established industrial methods to form metallic plates (∼few mm thick) of any material, considerable difficulties are experienced in adapting the conventional technique to deform thin metal sheets/foils (thickness 0.1–1 mm) to the desired shape. High-velocity forming of thin sheets is a popular method of obtaining shapes that are difficult to obtain from conventional manufacturing techniques.
High-velocity forming using electric/magnetic fields and explosive gases is used in industry to form thin sheets. This acts as a frictionless punch and its energy transfer (kinetic energy) is efficient. Hence, considerably less energy is required in this process compared to conventional sheet metal-forming processes. Due to high strain rates involved in such forming processes, the microstructure and textural evolution are likely to be different from conventional processing routes, where the strain rates are an order of magnitude lower.
The conventional shock tube was first used by Stoffel Reference Stoffel1,Reference Stoffel2 to investigate the dynamic behavior of shock wave-loaded plates. He compared the mechanical response of the dynamically deformed plates with quasistatically deformed plates by simulation using viscoplastic models. The microstructural and textural response was not studied. The property of a material greatly depends on its microstructure and texture. Reference Shabadi, Suwas, Kumar, Roven and Dwarkadasa3 Investigations on changes in texture after shock wave loading were made previously via different methods of shock-loading, particularly flyer plate-type experiments. Earlier literature has many contradicting views regarding changes in crystallographic orientation after shock-wave loading. De Angelis and Cohen Reference Cohen, Nelson and De Angelis4 had observed texture change in shock-loaded copper. Dhere et al. Reference Dhere, Kestenbach and Meyers5 also observed texture changes in commercially pure aluminum after shock wave deformation. However, no texture change was reported in copper and nickel by Higgins Reference Higgins6 and Trueb. Reference Trueb7 Microstructural changes were also looked into the material after shock loading. Reference Rose and Berger8 The literature also has reported uniform dislocation, cell substructure, and higher dislocation densities compared to conventional deformation for the same strain, microtwinning, and misorientation limited to low values.
In the previous study, we looked into the formability and microstructural response of Al–alloy via shock loading. Reference Ray, Jagadeesh and Suwas9 In the present study, we examine the microstructure and texture change in shock-loaded pure copper. To investigate the effect of initial texture on response of a shock-loaded material, we have obtained initial samples with different textures by conventional unidirectional rolling (UDR) and multistep cross rolling (MSCR). Reference Suwas, Singh, Rao and Singh10–Reference Gurao, Sethuraman and Suwas12 The motivation for the present work is to explore the possibilities of using shock-wave loading to deform thin metal sheets and to investigate the changes in microstructure and texture. We have chosen oxygen-free high-thermal-conductivity (OFHC) copper which has medium stacking fault energy (SFE) to study the response of annealing twins to shock forming.
II. EXPERIMENTAL APPROACH
A. Material and processing
OFHC copper was used in the present investigation. We have received Cu in the form of 5-mm-thick hot-rolled sheets and processed it by cold-rolling either in UDR or MSCR. In multistep cross rolling, the sheets were rotated 90° about the sheet normal after each pass. All the samples were reduced by 10% in each pass to obtain a final thickness of 0.5 mm. The rolled sheets were annealed at 400 °C for 1 h from differently processed sheets and disks of 80 mm diameter were cut.
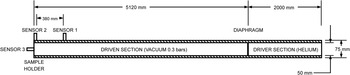
The disks obtained were subjected to a high strain rate loading normal to their rolling plane in a conventional shock tube, wherein a normal shock front is produced by creating a sharp pressure difference in the medium. This is achieved by sudden bursting of a diaphragm, which separates a high-pressure gas (in driver section) from the low-pressure gas (in driven section) (Fig. 1). The pressure in the driven section of the tube was maintained at 0.3 bars. The driver section of the tube was filled with helium gas to a pressure to rupture the diaphragm. As the critical pressure reaches the driven section, the diaphragm ruptures suddenly, and a compression wave is formed, which travels in the driven section that rapidly steepens to form a shock front. The shock wave compresses the gas in the driven tube as it travels. The moving shock front is exposed to the disk fixed concentrically at the other end of the driven tube, deforming flat disk into a hemispherical cap. The deformed disk is cut transversely along the initial rolling direction for further analysis.
Schematic layout of the conventional shock tube. Reference Ray, Jagadeesh and Suwas9

Commercially pure aluminum disks were used as a diaphragm. The critical bursting pressure of the diaphragm is controlled by disk thickness and grove depth of the cross indent made passing through the center of the diaphragm. The cross indent assures the bursting of the diaphragm along the specified fracture plane in a fast and controlled manner. The strength of the shock front formed depends on the pressure ratio it created in the driver and driven sections of the tube. The bursting pressure of the diaphragm and thus the pressure in the driver section can be varied by using a different diaphragm of different thicknesses and depth of the indent. Two diaphragms (21/5 and 1.61/3) were used for obtaining shock of different strengths. In the notation, say 21/5, 2 represents the thickness of diaphragm in mm and the exponent denotes the fraction of the diaphragm thickness dented. Pressure at various points in the shock tube is measured using piezoelectric pressure transducers. The shock pressure profile and shock speed can be obtained from pressure reading of sensors 1 and 2 (position shown in the schematic of Fig. 1). A third transducer (sensor 3) was flush-mounted at the end flange to calculate the impulse and the peak over-pressure felt by the sample.
B. Strain measurements
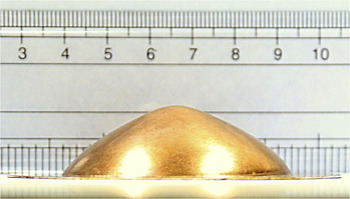
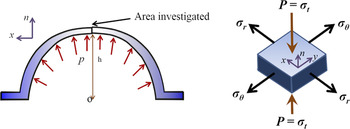
A deformed Cu disk is shown in Fig. 2. Its cap shape can be seen in the figure. The strain at any point in the shock-loaded sheets is represented completely by strain along three directions, namely, circumferential strain (εθ), radial strain (εr), and thickness strain (εt). Figure 3 shows the schematic of the deformed sample and also illustrates the principal stress direction.
Cap formed after shock wave deformation.

Schematic representation of deformed sheet and the stress in the unit element.

The thickness strain (εt) in disk deformed in cap shape Reference Ray, Jagadeesh and Suwas9 is given by
 $${\varepsilon _{\rm{t}}} = {\rm{ln}}{{{\rm{\pi }}{r^2}} \over {2{\rm{\pi }}\rho h}} = {\rm{ln}}{{{r^2}} \over {2{\rm{\rho }}h}}\quad ,$$
where
 $${\rm{\rho }} = {{{r^2} + {h^2}} \over {2h}}\quad ,$$
where h = mid-point deflection, r = radius of exposed area = 25 mm, and ρ, the radius of curvature.
The strain in the material can be calculated from the mid-point deflection (h). Thus, the mid-point displacement was measured using a height gauge after the ‘cap’ was sectioned along the center of the disk to measure the thickness strain in the area of interest.
C. Microstructure and texture characterization
The deformed samples were sectioned for microtexture and texture characterization along the rolling direction using electro-discharge machining (EDM). Bulk X-ray texture measurements were made on the rolling plane of the sample, and electron back-scattered diffraction (EBSD) investigation was done on the transverse plane of the samples.
Bulk texture measurements were carried out in Bruker D8 Discover (Bruker Corporation, Karlsruhe, Germany). The rolling plane of the sheet was polished to 3000 grade sheet. X-ray texture measurement was carried out on Schulz reflection mode using Cu Kα radiation. Incomplete pole figures corresponding to typical FCC reflection planes, {111}, {200}, {220}, and {311}, were measured experimentally. LaboTex software (LaboSoft s.c., Krakow, Poland) was used for calculating the orientation distribution functions (ODFs) from the measured pole figure and for further quantitative texture analysis. Orthorhombic sample symmetry was imposed for texture representation in initial and deformed samples.
EBSD measurements were done on the transverse surface of the sample. The sample was polished via conventional metallographic technique followed by electro-polishing using D2 electrolyte (250 mL phosphoric acid, 500 mL distilled water, 250 mL ethanol, 50 mL propanol, and 5 g urea) in Struers Lectropol-5 (Struers A/S, Stuttgart, Germany). EBSD was performed with a QUANTA scanning electron microscope (SEM; FEI Company, Hillsboro, Oregon) with an accelerating voltage of 20 kV and a spot size of 5. The step size of the scan was varied from sample to sample but was kept within the range of 0.4–1 µm. OIM™ Analysis software was used for the postprocessing of the EBSD scan.
III. RESULTS
A. Impulse measurement and effective strain calculation
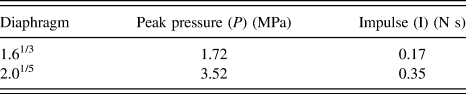
Shock waves of different peak pressures and impulses were generated using different diaphragms. The pressure experienced by the sample was measured by replacing the experimental sheet with sensor 3 at the location shown in Fig. 1. The impact pressure recorded from sensor 3 is reported in the previous work. Reference Ray, Jagadeesh and Suwas9 The impulse values calculated are tabulated in Table I.
Different pressure levels for each diaphragm.

The macroscopic strain in the spherical caps for different impact pressures was calculated from Eqs. (1) and (2) using the mid-point deflection (Table II). The results clearly indicate that the macroscopic strain is well within the low strain regime (18–36%).
Effective strain measured for the deformed samples.

B. Texture evolution
1. Shock-loaded cold-rolled and annealed UDR sheet
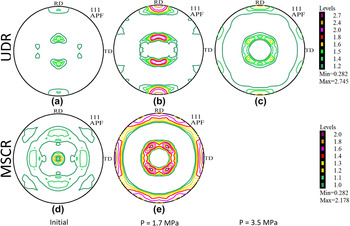
The evolution of the texture resulting from shock wave deformation was determined by measuring pole figures using X-ray diffraction. Figure 4 displays the (111) pole figures of the UDR sheets before and after shock deformation. There is a clear change in the texture after shock wave treatment from the initial texture as seen from the (111) pole figure.
(111) pole figures of (a) UDR sample, (b) UDR sample shock-loaded at P = 1.7 MPa, (c) UDR sample shock-loaded at P = 3.5 MPa, (d) MSCR sample, and (e) MSCR sample shock-loaded at P = 1.7 MPa.

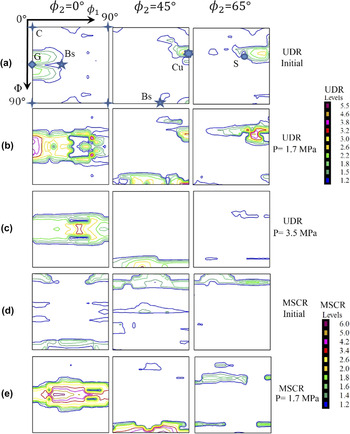
The ϕ2 sections (ϕ2 = 0°, 45°, and 65°) of the ODF for all deformed samples are shown in Fig. 5, which show the important texture components for the fcc material: copper {112}〈111〉 (Cu), S{132}〈643〉, cube {100}〈001〉 (C), brass {110}〈112〉 (Bs), and Goss {110}〈100〉 (G). The texture of initial UDR sample is weak with major components being Cu, S, and G. After shock deformation at P = 1.7 MPa, the α-fiber develops. The maximum intensity is at G with intensity spread toward Bs. The Cu component strengthens for P = 1.7 MPa along with S. The α-fiber of the UDR sample, deformed at P = 3.5 MPa, weakens compared to P = 1.7 MPa shock-loaded deformed condition with G component weakening. The shifted Bs component remains stable, but Cu and S components have reduced drastically.
Selected ODF sections ϕ2 = 0°, 45°, and 65° for the (a) UDR sample, (b) UDR sample subjected to shock deformation at P = 1.7 MPa, (c) UDR sample shock-loaded at P = 3.5 MPa, (d) MSCR sample, and (e) MSCR sample shock-loaded at P = 1.7 MPa.

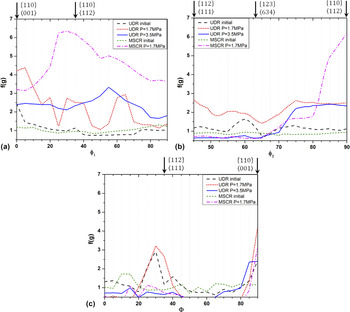
The fiber connects important rolling texture components in the ODF section. The variations in the texture intensities [f(g)] are quantitatively represented by the fiber plots (Fig. 6). The α-fiber contains G and Bs components, the β-fiber Cu, S, and Bs components, and the τ-fiber of the Cu and G components. For P = 1.7 MPa shock-loaded UDR sample, G, Cu, and Bs components develop along with the fractions of S. When the sample is deformed to high strain at P = 3.5 MPa, Bs is a stable component followed by G. The Bs component develops with intermediate G, Cu, and S components. An examination of the intensity levels shows that the overall texture first strengthens and then weakens with strain. The Bs component gets strengthened with increasing strain, but shifts for the sample deformed at P = 3.5 MPa, as can be seen in α- and τ-fibers.
Texture fiber plots for the UDR and MSCR samples after individual shock-loaded conditions: (a) α-fiber, (b) β-fiber, and (c) τ-fiber.

Thus, the texture strengthens for the sample deformed at a peak pressure of P = 1.7 MPa with all the texture components of the deformation texture, namely, Cu, G, Bs, and S strengthening. As the strain increases further as a result of a higher peak pressure, that is, P = 3.5 MPa, the Bs component remains stable, while the other component weakens. The Bs component grows at the expense of the other component.
2. Shock-loaded cold-rolled and annealed MSCR sheet
Pole figure measurements were also done for the shock-loaded MSCR sheets. The (111) pole figures and the relevant φ2 sections of the ODF for the shock-loaded and initial MSCR sheets are shown in Figs. 4 and 5, respectively. The initial texture of MSCR sample is weaker and different from the UDR sample (Fig. 6). The MSCR sample has a relatively weaker texture compared to the UDR sample. On shock deformation at P = 1.7 MPa, the Bs component strengthens significantly. The G components also strengthen along with Cu and S in a manner similar to the UDR sample deformed at the same peak pressure level. The intensity of Bs component is significantly higher compared to the G, Cu, and S components. The Bs component in high-volume fraction develops at the relatively lower pressure levels compared to the UDR samples.
3. Quantitative analysis
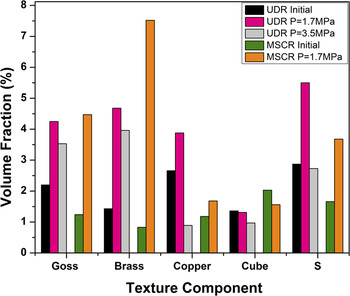
The volume fraction of each texture component is calculated by integrating the elemental volume Δφ1·ΔΦ·Δφ2 with 10° integral range corresponding to each texture component in the orientation space. The volume elements with the Euler angles close to the ideal values correspond to the respective texture component. Figure 7 shows the volume fraction of relevant texture components. It clearly shows that the Bs component strengthens with strain and stabilizes at the expense of Cu, S, and C components, while the G component remains mostly stable. The mechanisms associated with heterogeneous deformation are deformation twinning, deformation banding, and shear banding. If the twin fraction increases with deformation, the fraction of G and Bs will increase as observed in TWIP steel. Reference Vercammen, Blanpain, De Cooman and Wollants13 In the shock-loaded sample, the Bs component forms at relatively low strain values. In the present case, the volume fraction of the Cu component is small.
Volume fractions of typical FCC texture components at different conditions for UDR and MSCR samples.

C. Microstructure evolution
1. Shock-loaded cold-rolled and annealed UDR sheet
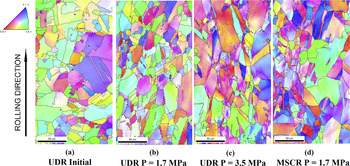
The EBSD-generated inverse pole figure micrographs (IPF maps) for the initial and deformed sheets are shown in Fig. 8 . The color in IPF map represents the orientation of the grain as depicted in the color-coded triangle. The crystal plane parallel to transverse direction (TD) of the sample is represented in the IPF maps (Fig. 8). The maps clearly show that the grains have stretched along the shock direction or perpendicular to the rolling direction (along the normal direction of the original sheet). The color variation was absent in the grain indicating recrystallized grains in the UDR sample prior to applying shock, but can be observed in the grains indicating strain inside the grain after shock treatment.
Inverse pole figure (IPF) maps of (a) UDR sample, (b) UDR sample shock-loaded at P = 1.7 MPa, (c) UDR sample shock-loaded at P = 3.5 MPa, and (d) MSCR sample shock-loaded at P = 1.7 MPa.

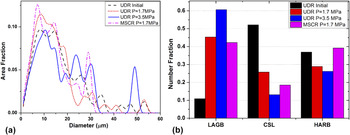
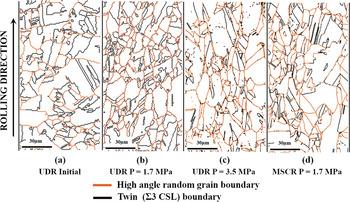
Figure 9(a) shows grain size distribution, while Fig. 9(b) displays grain boundary character distribution (GBCD) for these materials after deformation. For the UDR sheets, the grain size distribution shows only a little change after deformation. The undeformed annealed Cu has a high twin [which is a Σ3 coincidence site lattice (CSL)] boundary fraction. On deformation, there is a significant increase in low-angle grain boundary (LAGB) fraction and the twin boundary fraction decreases significantly. The high-angle random boundary (HARB) fraction decreases with strain for UDR material, whereas it increases slightly for the MSCR material. To get a clear picture of grain boundary (GB) network in the material, a grain boundary map is shown separately in Fig. 10. The orange lines in the figure indicate HARB, which is a grain boundary when the misorientation between adjacent grains is more than 15°. The black lines represent twin boundaries. LAGBs are not shown for clarity. The twin boundary is abundant and well-connected in the UDR sample. After shock treatment, the connectivity of twin boundary is broken and the number of twin boundary is reduced. The connectivity of twin boundary degrades and its number reduces with an increase in shock pressure or effective strain.
(a) Area fraction grain size distribution of various samples. (b) GBCD—number fraction for all shock-loaded samples.

Grain boundary (GB) map of (a) UDR sample, (b) UDR sample shock-loaded at P = 1.7 MPa, (c) UDR sample shock-loaded at P = 3.5 MPa, and (d) MSCR sample shock-loaded at P = 1.7 MPa. The orange line indicates HARB and the black line the twin (Σ3 coincidence site lattice) boundary.

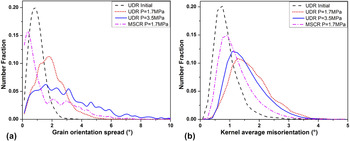
The grain orientation spread (GOS) is the point-to-point orientation deviation within a grain with respect to the local grain orientation. A higher GOS suggests higher amount of deformation in the material. The GOS plot is shown in Fig. 11(a). The orientation spread for the starting UDR material resembles a Gaussian distribution. With an increase in the effective strain, the mean of the distribution increases and the distribution becomes flatter implying uniform strain in grains. The GOS value is mostly within 5° misorientation even for the deformed sample indicating high fraction of very low-angle grain boundaries (VLABs) to LAGB.
(a) GOS plot and (b) KAM plot for UDR sample; UDR sample shock-loaded at P = 1.7 MPa, at P = 3.5 MPa, and MSCR at P = 1.7 MPa.

The kernel average misorientation (KAM) indicates the local misorientation in the grain with respect to its neighbor. The KAM plot is shown in Fig. 11(b). KAM plot has Gaussian distribution, and with deformation the KAM distribution broadens. It is interesting to note that the KAM distribution for UDR sample shock-loaded at P = 3.5 MPa has less width than the sample deformed at the pressure P = 1.7 MPa. The average KAM for any sample is less than 3°.
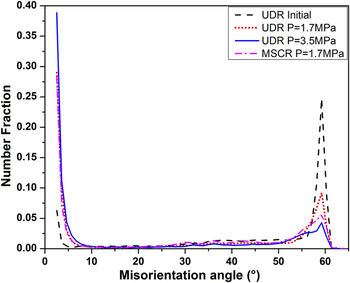
The misorientation plot (Fig. 12) shows that the material with higher strain has a larger fraction of LAGB. The fraction is high for misorientation less than 5° indicating that majority of the LAGBs are VLAB. The twin boundary fraction has reduced drastically with strain for the UDR samples as indicated by reduction in the height of the peak at 60° misorientation. This peak has flattened toward the lower misorientations with strain.
Misorientation angle plot for UDR sample; UDR sample shock-loaded at P = 1.7 MPa, at P = 3.5 MPa and MSCR sample at P = 1.7 MPa.

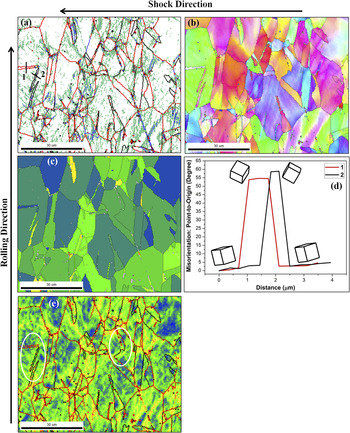
To observe the pattern of microstructural changes, a selected region of UDR sample deformed at P = 3.5 MPa has been examined in more detail. This sample is chosen as it has the highest strain. The GB map, IPF map, grain average misorientation (GAM) map, misorientation profile along some directions, and KAM map are shown in Fig. 13. The GAM map shows maximum orientation difference in individual grains. In the IPF map shown in Fig. 13(b), the planes perpendicular to the shock direction (parallel to normal plane) are represented. This is done as at first the bulk X-ray texture data are measured in this plane, which gives reference with respect to shock impingement direction. The unit cells imposed in misorientation line profile plot [Fig. 13(d)] show the local crystal orientation along the line. The KAM map for the same region also provides a view of variation in local misorientation and hence the strain distribution within the individual grain. Brandon’s criteria (θ < 15°/√Σ) is used as relaxation criteria for identifying twin (Σ3 CSL) boundaries. The GB map indicates that many twin boundaries surrounding the original twin grain have changed their character to HARB fully or in certain segments. It seems like that the twins which were aligned along the shock direction have a lower GAM. Annealing twins initially present in the material can be identified based on shape and misorientation. The boundary surrounding such twins has a mixed character, i.e., it has a segmented twin and HARB boundary character. The change in character of twin boundary to HARB seems to be dependent on the orientation of the twin, parent grain, and the direction of application of shock. The transformation in nature of the boundary from twin to HARB is accompanied by relaxation in local strain, as can be observed in the KAM map. The misorientation profile shows how the crystal orientation changes along the initial twin. The misorientation along the twin with intact twin boundary has a proper twin orientation relation with respect to the parent grain. The twins, whose boundaries have changed their character to HARB, though have a misorientation value near 60° and within Brandon’s criteria, the crystal orientation relationship is not satisfied as per the prescribed axis–angle pair combination (〈111〉 60°).
Plots for UDR sample deformed at P = 3.5 MPa. (a) Grain boundary map. The red line indicates the HARB, black line twin (Σ3 CSL) boundary, green-line VLAB (2–5°), and blue-line LAGB (5–15°). (b) Rotated IPF map showing plane orientation perpendicular to shock or parallel to normal plane. For color code, refer to Fig. 8. (c) Grain average misorientation map showing the average misorientation in various grains. The color scale is from minimum blue to maximum red with cutoff of 5° misorientation. The misorientation line profile along lines 1 and 2 in (a) is shown in (d). (e) KAM map showing the local misorientation inside the grains. The line represents boundary type as in (a). The white ellipse marks the region showing different boundary type surrounding twins. Note the KAM around the different boundaries surrounding the twin. All scale bars in the maps are 30 μm in size.

2. Shock-loaded cold-rolled and annealed MSCR sheet
MSCR and annealed sheets were characterized in the same manner as the shock-loaded unidirectional rolled sheets. The IPF map, grain size distribution and GBCD, the GB map, the GOS plot along with KAM plot, and the misorientation angle plot for the shock-loaded MSCR sample are shown in Figs. 8–12, respectively. The grain size distribution does not change much after deformation. However, the grain boundary character distribution changes with an increase in the fraction of LAGB and a decrease in twin boundary fraction in a similar manner as the deformed UDR sheets. The GOS distribution spreads and flattens along the tail region to a higher (>2°) GOS value similar to the UDR sheet. However, the peak is shifted to a lower GOS value, which was not expected. Similar observation can be made from the KAM map where the peak has broadened and shifted to a higher value of KAM but is still less compared to KAM spread for UDR sample shock loaded at P = 1.7 MPa, and similar to P = 3.5 MPa shock-loaded UDR sample. The misorientation map indicates an increase in misorientation at angle <5° and a drastic drop in the number fraction of misorientation at 60°, which corresponds to the twin (Σ3 CSL) boundary. The peak in misorientation at 60° has broadened toward a lower misorientation angle.
D. TEM studies
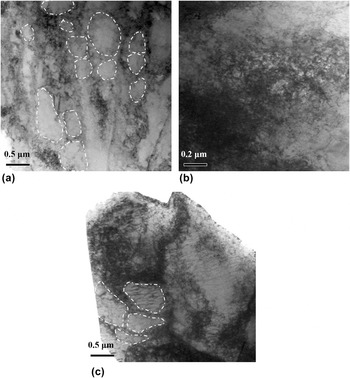
A detailed and finer-level microstructural characterization, using transmission electron microscope, was made for the UDR annealed copper sample after shock loading of P = 3.5 MPa. The initial samples, prior to shock treatment, were annealed at 400 °C for 1 h, which is well above the recrystallization temperature for Cu. In such a well-annealed material, dislocation density is expected to be too low. Hence, the dislocation structures observed in the deformed sample are attributed to shock treatment.
Figure 14 shows the bright field images of the deformed sample showing a typical dislocation substructure formed in the material. Cell structure and dislocation arrangement are evident in Fig. 14(a). The region with high and uniform dislocation density can also be observed in Figs. 14(b) and 14(c). Fig. 14(c) also indicates the formation of some subgrains.
TEM bright field image of the UDR sample deformed at 3.5 MPa showing dislocation substructure within a grain. A few subgrains are shown in white.

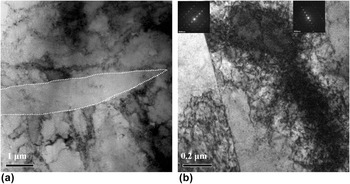
Figure 15(a) shows a deformation twin of typical lenticular shape. The twin width is 1 μm. The region in the twin has no dislocations. It should be noted that not many deformation twins were observed under TEM in the area of investigation, particularly because of the very narrow electron transparent region available. Deformation twin of lenticular shape could not be captured in EBSD. Figure 15(b) shows dislocation at a twin grain boundary. The two grains are identified as twins by diffraction pattern. They are big in size implying that they are the annealing twin present in the initial annealed sample. At the boundary of this twin, dislocations have piled up at the upper segment of the twin boundary having passed through the lower segment. Twin boundary is effective in hindering the dislocation motion across the boundary essentially confirming the changing nature of the initial twin boundary from the twin boundary (upper segment) to HARB (lower segment) upon deformation.
TEM bright field image of the UDR sample deformed at 3.5 MPa illustrating (a) recovered grain or deformation twin, and (b) inhomogeneous dislocation across grain boundary in grains. The diffraction pattern for the two grain in (b) is shown as an inset. The deformation twin boundary is indicated by white line.

IV. DISCUSSION
The Cu plates are shock-loaded along the plane of the disk. The state of stress in the material is similar to that experienced under deep drawing or MSCR. The material experiences compression along the thickness (shock) direction. Tensile stress is experienced in the plane of the disk. The material flows along the circumferential direction. The maximum strain experienced is 36% when the thickness reduction is maximum. Noticeable texture changes are observed in this region. Both UDR and MSCR rolled and annealed samples have undergone similar changes in the development of texture and microstructure.
A. Effect of shock-loading pressure and strain on texture
The examination of pole figures and the ODFs clearly reveals a similarity in textures of MSCR sample deformed at P = 1.7 MPa and UDR sample deformed at P = 3.5 MPa. Both these materials show Bs-type texture, while the MSCR sample shows a stronger texture with high Bs component fraction. The MSCR sample deformed at P = 1.7 MPa and the UDR sample at P = 3.5 MPa has nearly equal strain, i.e., 30.8 and 36.4%, respectively. It was reported earlier that such low strains do not induce any appreciable texture transition on planar shock-loading in Cu6 and Al5, though appreciable changes in microstructural features like development of dislocation substructure and deformation twinning were observed. It appears that texture development is mainly due to deformation geometry. However, in the present work, microstructural features resemble at signatures of large strain deformation. It, therefore, appears that the high strain rate as well as similar deformation levels could be the reason for the development of texture. This explains the formation of similar texture for equally strained samples. The UDR sample deformed at P = 1.7 MPa is the intermittent texture formed toward the final Bs-type texture.
B. Effect of initial texture
The initial UDR sample has strong texture with Cu and S as major texture components. The initial MSCR sample had a comparatively weaker texture. Thus, it is easier for the texture of the MSCR sample to develop into the final Bs-type texture on shock-assisted deformation into cup shape than the UDR sample, which has initial strong texture and needs to break down to the final Bs-type texture. Stronger Bs-type texture was obtained with 30.8% strain in MSCR compared to the final texture obtained with UDR sample and 36.4% strain. The texture developed in the material depends on the strain path. Reference Gurao, Sethuraman and Suwas12,Reference Sidor, Petrov and Kestens14,Reference Roy, Singh, Suwas, Kumar and Chattopadhyay15 The final texture is Bs type for both the materials although the starting textures were different.
C. Texture change
Bs-type texture has been developed on shock-assisted deformation of Cu sheet. This texture is reported to develop on MSCR of Cu. Reference Gurao, Sethuraman and Suwas12,Reference Sidor, Petrov and Kestens14,Reference Roy, Singh, Suwas, Kumar and Chattopadhyay15 As the deformation geometry and overall material flow in the present shock-assisted forming process are similar to MSCR process, Bs-type texture evolves in both the cases. The formation of Bs-type texture, in general, is attributed to an extensive deformation banding, deformation twinning, or/and shear banding. Reference Leffers and Ray16 In the absence of shear banding, Bs-type texture is attributed to deformation twinning and the absence of volume effect of deformation twins. Reference Vercammen, Blanpain, De Cooman and Wollants13,Reference Leffers and Ray16 Deformation banding is observed clearly from VLAB in GB map [Fig. 13(a)]. Deformation twinning is also observed, though not extensively. In the present case, Bs-type texture evolution is likely to be due to the deformation banding and deformation twinning but without volume effect.
D. Microstructural change
Microstructurally, to some extent, the initial equiaxed grains have elongated along the circumferential direction (along rolling direction in Fig. 8). No nucleation of new grains was observed. Subgrains have formed as indicated by an increase in the fraction of LAGB [Fig. 9(b)] and visible in TEM images [Figs. 14 and 15(a)]. Deformation twins are also observed. They are rare in medium-SFE materials like Cu and form under a special condition as in the deformation of nanocrystalline Cu. Reference An, Lin, Wu and Zhang17,Reference An, Wu, Zhang, Figueiredo, Gao and Langdon18 It is possible even for a low SFE material like steel to show dominant complicated dislocation and grain boundary activities instead of deformation twinning under HPT. Reference An, Lin, Sha, Huang, Ringer, Zhu and Liao19
The dislocation substructure (Fig. 14) observed in the deformed sample (P = 3.5 MPa) appears similar to that observed by Rose and Berger. Reference Rose and Berger8 These features clearly indicate the formation of “forest of dislocations” after shock loading. The dislocations are nucleated uniformly at the shock front and lag behind as suggested in the deformation model by Meyers. Reference Meyers20 The recovery or cell formation by dislocation rearrangement after shock loading is due to thermal recovery on temperature rise during shock loading as reported in the case of nickel. Reference Higgins6
The texture component with {110} plane parallel to the sheet plane, namely, the brass and Goss texture components, has remained stable and further developed during deformation. The GBCD plot [Fig. 9(b)] clearly shows that VLAB (LAGB in graph) fraction has increased while the twin boundary and HARB fraction have decreased. Between twin and HARB, the fraction of HARB has increased and that of twin boundary decreased with increasing shock pressure and strain. The interplay between changing fraction of twin and HARB is attributed to the change in the character of twin boundary to HARB. This can be clearly observed in GB map (Fig. 10), which shows only twin boundary and HARB, with a part of twin boundary changing to HARB confirming the change in boundary character from twin boundary to HARB. The overall boundary fraction has reduced due to the generation of new VLABs as a result of subgrain formation. The twin boundary surrounding the twin has changed to HARB fully or in segments. In a few twin grains, the twin boundary character has not changed at all, as shown in Fig. 10.
Long-range misorientations are very small and the orientation spread within a grain is limited to a maximum of 5° in the present case, which is in agreement with the earlier reports on shock deformation of Al5 and Cu6. This is primarily because of the near-uniform dislocation nucleation along the shock front.
In the initial sample, the continuity of HARB in GB network is regularly broken by the twin boundary, as a result of the mechanical and thermal history of the sample. On deformation, HARB continuity in GB network has improved due to the change in the character of the twin boundary to HARB.
E. Change in twin boundary character
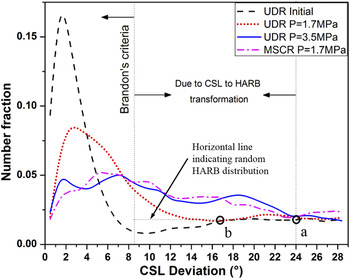
Figure 16 is the CSL deviation plot of twin (Σ3 CSL) boundary, which is the major CSL boundary in the present study. The plot shows deviation of twin boundary from the ideal misorientation, but is still considered as a twin boundary. Brandon’s criteria, which are very lenient, are used to set the upper limit for deviation from the ideal twin misorientation. The Brandon’s criteria are well followed by twin deviation for the annealed UDR sample. There is a dip in the number fraction before flattening out. The plateau level is considered as an indicator of the random distribution of HARB, which is shown in Fig. 16 by a horizontal line. For the shock-loaded sample, it is clear from the twin (Σ3 CSL) deviation plot that the curve flattens out and the fraction with a high twin deviation increases with strain indicating more twin boundaries deviating from the ideal twin misorientation. The number fraction of the twin deviation becomes equal to the number fraction corresponding to the random distribution of HARB and then flattens. The meeting points ‘a’ (for MSCR P = 1.7 MPa and for UDR P = 3.5 MPa shock-loaded sample) and ‘b’ (for UDR P = 1.7 MPa shock-loaded sample) are marked in Fig. 16. The region between Brandon’s criteria and this meeting point gives information about the fraction of twin boundary, which changed to HARB. The region is marked in the plot for MSCR P = 1.7 MPa and UDR P = 3.5 MPa shock-loaded sample. It is the same for both the mentioned cases and they have similar strain values. The meeting point for UDR P = 1.7 MPa shocked sample is on the lower side, which is expected as the strain in this case is lower. This essentially confirms the twin boundary character changing to HARB upon shock deformation in all the deformed samples. The extent or fraction of the boundary transformation is strain-value dependent. The transformation of twin boundary to HARB is attributed to the pile up of dislocation at twin boundary.
Twin (Σ3 CSL) deviation plot obtained from EBSD data for UDR sample, UDR sample shock-loaded at P = 1.7 MPa and at P = 3.5 MPa, and MSCR sample at P = 1.7 MPa.

The orientation of twinned grains explains the segmented transformation in twin boundary to HARB. Polycrystals seldom deform homogeneously. The strain in a grain and its homogeneity depend on the grain orientation. In the present case, the grain with {110} parallel to sheet plane has uniform strain, while the other oriented grains have deformed in inhomogeneous manner as shown in Fig. 13. The {100} cube-oriented grains have been observed to undergo severe and inhomogeneous deformation. Because of the geometry of deformation, grains with {110} plane parallel to the sheet plane have multiple primary slip systems
 ${1 \over 2}\left\{ {111} \right\}\left\langle {1\bar 10} \right\rangle$
being activated together due to the high Schmid factor value, and hence experience uniform strain. This is not the case for the grains with other orientation. There is a general tendency of rotation of such grains toward {110} orientation on deformation, as can be seen in Fig. 13. This supports the X-ray of bulk texture result leading to the evolution of texture components with {110} planes parallel to the sheet plane, namely, the Bs and G texture components.
Different twins in grain have undergone different degrees of deformation. In Fig. 13(c), the GAM map is used as an indicator of intragranular strain and the KAM map as a local strain variation within the grain. Even within a grain, different twins have different GAM values depending on the twin orientation. The twins with initial {110} plane parallel to the sheet plane have a lower GAM value, while the other twins have higher GAM owing to the inhomogeneous deformation as explained earlier. In the {110}-oriented twins, due to the homogenous dislocation activity within the twin, the dislocation pile-up at twin boundaries is uniform in all directions. If we account dislocation pile-up as the primary reason for change in boundary character from twin boundary to HARB, then the change of the entire GB character from twin to HARB is preferentially observed primarily for the {110}-oriented twins owing to the homogeneous dislocation pile-up throughout the GB length. The dislocation activity is inhomogeneous within the grain for twins with other orientations, and the dislocation pile-up at GB is nonhomogeneous along the length of GB. Thus, the change in GB character in such grains is observed along certain segments of GB or not at all. This preposition is supported by Fig. 15(b).
V. CONCLUSIONS
Pure copper sheets with different starting textures were subjected to deformation under shock waves and the resultant deformed cap was investigated for the evolution of microstructure changes and the crystallographic texture. The analyses of the experimental results led to the following conclusions:
-
(1) The texture evolution is attributed to deformation geometry, which depends on the effective strain and the strain rate. Brass-type texture develops with a prominent Bs component. The path of texture evolution depends on the initial texture. The final texture is the same for different initial textured samples.
-
(2) The cube and copper texture components have a tendency to diminish, while the S-, Goss-, and brass-texture components strengthen with deformation. The Bs component is due to deformation geometry, i.e., the state of stress. The grains with {110} plane parallel to the sheet plane deform homogeneously, while those with other orientations tend to acquire this orientation primarily because it has the possibility of activation of multiple slip systems. Thus, for homogeneous deformation during forming grains with {110} plane oriented along the sheet plane are preferable.
-
(3) With increasing effective strain, there was no significant change in the grain size distribution; however, a significant increase was observed in the low-angle “misorientations”.
-
(4) Large fraction of the new VLAB and limited LAGB form under the influence of shock wave. Long-range misorientation formation is very small. Misorientation is limited to less than 5°.
-
(5) The grain orientation spread increases with strain; however, it remains restricted to less than 5°. A “forest” of dislocations was left behind leading to strain hardening in the material.
-
(6) Deformation banding and deformation twins are observed in materials.
-
(7) The twin (Σ3 CSL) boundaries corresponding to the annealing twin get transformed to HARB on shock-induced deformation. The fraction of transformed boundary increases with effective strain, which can be segmented depending on the twin-grain orientation with respect to shock direction. The fraction of boundary transformation is a function of strain. The transformation is attributed to dislocation pile up at GB, as confirmed by TEM. Annealing twins with initial {110} plane orientation parallel to the sheet plane/perpendicular to shock direction have their twin character changed to HARB owing to uniform pile-up along the length of the GB.